


Services on Demand
Article
 English (pdf)
 Article in xml format
 Article references
Indicators

Related links
-
 Cited by Google
 -
 Similars in Google
Share

 Permalink
Journal of Energy in Southern Africa
On-line version ISSN 2413-3051
Print version ISSN 1021-447X
J. energy South. Afr. vol.29 n.3 Cape Town Aug. 2018
http://dx.doi.org/10.17159/2413-3051/2018/v29i3a5596
ARTICLES
Road transport vehicles in South Africa towards 2050: Factors influencing technology choice and implications for fuel supply
Fadiel AhjumI, *; Bruno MervenI; Adrian StoneII; Tara CaetanoI
IEnergy Research Centre, University of Cape Town, Private Bag X3, Rondebosch 7701, South Africa
IISustainable Energy Africa, Westlake Business Park, Tokai, South Africa
ABSTRACT
The South African transport sector is estimated to emit 60 MtCO2eq and require 800 PJ of energy, similar in scale to industrial energy demand and emissions. The sector is forecast to potentially eclipse industry in this regard if conventional vehicle choices and travel modes persist. This paper explores scenarios of transport technology choices and demand in a future of uncertain fuel and technology costs, and the consequences for energy supply and greenhouse gas emissions. It explores the extent of electric vehicle (EV) adoption and the implication of fuel migration from petroleum products. The preference for alternative fuels such as hydrogen, liquid biofuels and natural gas is also investigated. The evolution of road transport in South Africa towards 2050 is investigated utilising the South African TIMES model, a full energy sector least-cost optimisation model that relies on a rich technological database of the entire energy supply and demand system. Hydrogen fuel cell vehicles are shown to be a viable option in freight and public transport, potentially meeting 70% of travel demand by 2045. The private passenger and light commercial sectors emerge as the main market for electric vehicles, potentially accounting for 80% of new vehicle sales by 2045. Electricity as a transport fuel could account for 30% of fuel supply and reduce transport emissions to half of present day estimates. However, the key uncertainty driving EV adoption is future vehicle costs and crude oil prices, which could dampen EV uptake. Another main finding is that petroleum-dependent vehicles remain an important vehicle class, and that re-investment in existing crude oil refineries to conform to Euro5 standards is a likely requirement. There seems to be little indication, however, that additional refining capacity would be economically viable within the planning horizon.
Keywords: energy; electric vehicles; hydrogen; modelling; GHG emissions
1. Introduction
Transport is the primary consumer of liquid fuels in South Africa (Merven et al., 2012). Demand for energy in the sector is forecast to grow to 24-37% of total energy demand by 2050, possibly representing the largest sectoral demand for energy in South Africa (Department of Energy (DoE), 2016). The key question is how these energy needs will be met, considering the uncertainty of future fuel prices, technology costs and options, as well as efficiency gains. This question was addressed by putting significant effort into an expansion of the transport sector representation in the South African TIMES (SATIM) model.
The Integrated Energy Plan (IEP), which represents the country's key integrated energy planning strategy notes the 'lack of coordinated and integrated planning in the energy sector' that resulted in underinvestment in domestic electricity and petroleum product supply capacity (DoE, 2017). Future commodity prices, electric vehicle (EV) penetration rates,1 a CO2 emission constraint and refinery investments are highlighted as key uncertainties in determining the future energy supply requirements for the transport sector. Furthermore, the National Transport Master Plan 2050's (NATMAP 2050) assertion is that 'transport in South Africa will also promote a low-carbon economy by offering transport alternatives that minimise environmental harm' (Department of Transport (DoT), 2016).
Numerous sector-specific studies have been conducted in transport, but the IEP is a singular instance of a full economic sector energy supply and demand modelling study for South Africa. Transport sector studies vary from municipal to national scale, with different modelling approaches employed to address contextual objectives. Municipal studies typically require spatio-temporal models for peak traffic flows and road congestion in the context of urban planning (City of Cape Town, 2016; Nijhout et al., 2001; Perold and Anderson,
2000). Venter and Mohammed (2013) utilised survey data to construct a detailed household transport energy budget model within the Nelson Mandela Metropolitan area, Eastern Cape Province, South Africa, to assess socio-economic and land-use drivers of transport modal choices and share of household energy consumption. The NATMAP 2050 is currently the only national-scale study with a spatially disaggregated analysis of transport and future energy demand. The NATMAP 2050 discusses sectoral energy demand to contextualise the impact of transport, but besides the IEP, integrated full-sector studies are lacking. Gajjar and Mondol (2015) conducted a similar techno-economic study of alternative vehicle adoption in the country, but analysed the transport sector in isolation with a focus on passenger vehicles only.
The motivation for the analyses presented in this study was to provide a complementary perspective to the IEP and NATMAP 2050, with emphasis on the three main sectors of road transport: freight, private, and public transport. The study examined the implications for energy supply and demand and associated emissions that relate to future scenarios of national road transport and fuel supply approaching 2050. It did not consider land-use and air quality externalities associated with road transport or behavioural changes arising from technological innovation. The research questions for the study were: How might current and emerging transport technologies and fuels help South Africa transition to a low-carbon economy? What implications does this have on the upstream energy supply infrastructure outlook to 2050? What techno-eco-nomic drivers influence the adoption of EVs in South Africa?
2. Methodology
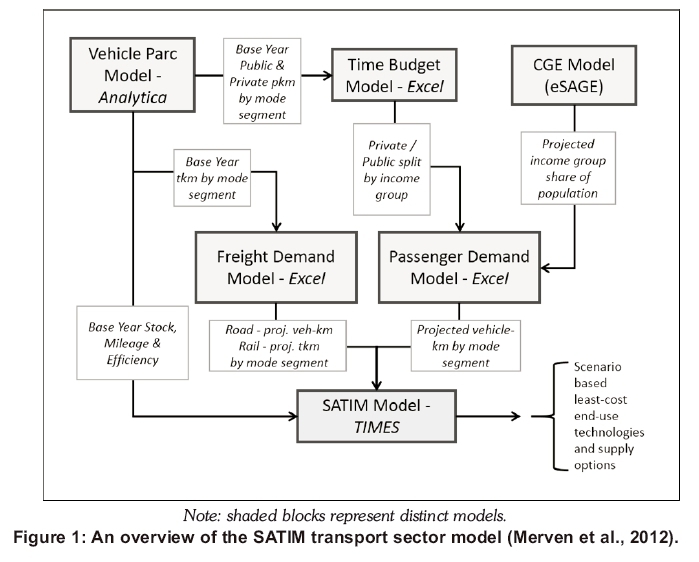
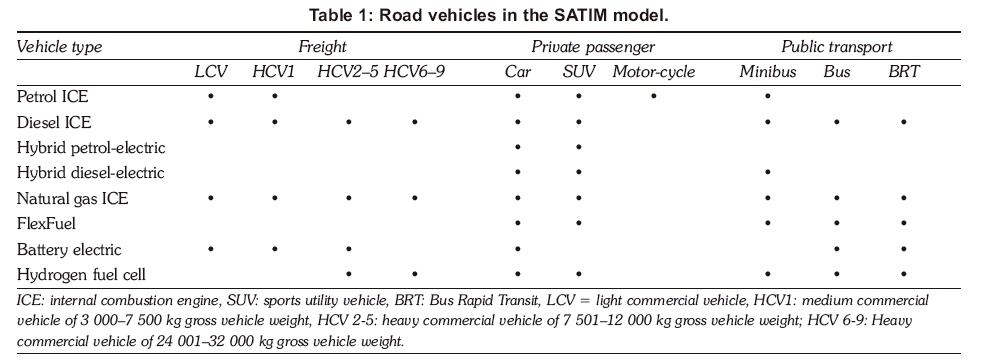
The method implemented followed closely that adopted by Merven et al. (2012) and is illustrated in Figure 1. A vehicle parc model, also described by Merven et al., and revised by Stone et al. (2018), is used to establish the characteristics of the 20002014 vehicle parc for South Africa. The range of vehicle technologies analysed is presented in Table 1.
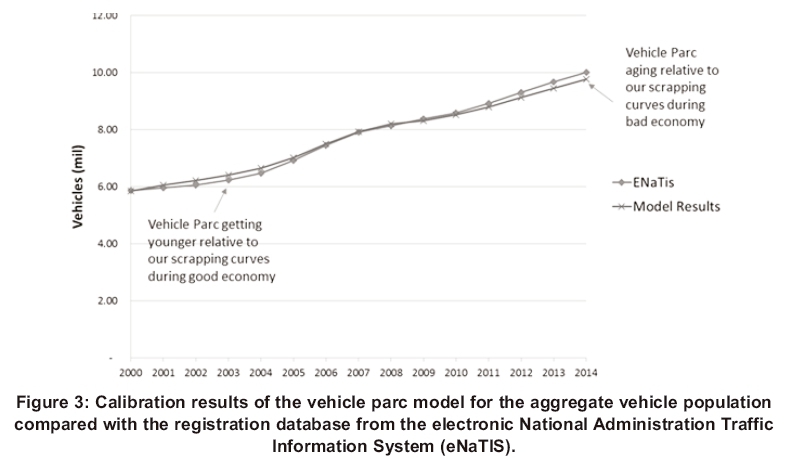
The vehicle parc was estimated utilising data from the National Association of Automobile Manufacturers of South Africa (NAAMSA) and the electronic National Administration Traffic Information System (eNaTiS) registration database as illustrated in Figure 2. Scrapping factors derived from Weibull distributions were determined for each vehicle class to reconcile eNaTIS data.
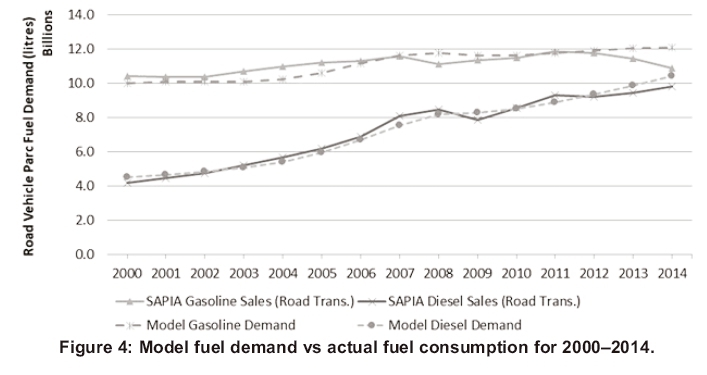
Vehicle mileage decay, which is required for vin-taging the vehicle parc, fuel economy and occupancy factors (load factors for freight t-kms), were estimated from the literature for which local data is scant. The calibration process is such that the final fuel energy demand conforms to road transport fuel sales adjusted for non-road use (e.g. Eskom diesel usage). Exemplary results for fuel and vehicle model calibration are shown in Figures 3 and 4.
The model estimate of the vehicle parc is in good agreement with the national registration database for the calibration period despite a noticeable departure in fuel consumption from actual sales for the period 2013-2014. This is presumably from a reduction in vehicle activity because of a combination of fluctuating economic growth (Trading Economics, 2017) and an inflection in the rate of fuel price increases for 2013-2014 occurring at the calibration period horizon. The deviation in fuel demand highlights the inability of the model to capture historic short-run supply-demand shocks. However, since the model is employed to aid strategic planning of energy supply of 20 years or more, such perturbations are less consequential for long-run analyses.
A general computable equilibrium economic model, eSAGE, is used to project sectoral economic growth via gross domestic product (GDP) and household income, given certain assumptions around population growth, productivity growth and global commodity prices (Alton, 2014). The household income projections and sectoral growth projections are taken to a passenger demand projection model and to a freight demand projection model.
The ownership of passenger cars in the passenger demand projection model is split between three income groups and a miscellaneous category to accommodate commercially- and government-owned cars. With population projections for each of the income groups, the passenger demand projection model uses assumptions around private vehicle ownership by income group, vehicle mileage, vehicle occupancy, public mode shares, average mode speeds, and a travel time budget to derive vehicle-km demand by passenger vehicle class for households. This is combined with a transport-GDP linked projection of the non-household owned cars to give a total passenger vehicle-km demand projection for road vehicles. The passenger-km projections by rail are derived from assumptions around future mode shares.
The freight demand projection model takes sector GDP projections and, based on assumptions around load factors and mode shares, makes projections of vehicle-km for different freight vehicle classes. The projections for ton-km are derived from assumptions around future mode shares.
Vehicle-km projections for road vehicles are then exogenously imposed in SATIM, which is used to project the least-cost technology and fuel mix to meet the projected vehicle-km and passenger-km demands, while also meeting other goals such as national emissions constraints.
Two sets of assumptions for the demand projections are used in this analysis:
1. Reference:
-
Passenger: Private vehicle ownership, annual mileage and occupancy are kept constant at the base year calibrated levels.
-
Freight: Mde share between road and rail is kept constant at the base year calibration level.
-
It is assumed that the efficiency of conventional internal combustion engine vehicles (ICEVs) improves annually at a rate of 0.5%.
2. Efficiency improvements and mode switching (EMS):
-
Passenger: Private vehicle ownership decreases, annual mileage decreases and occupancy increases relative to the base year calibration level over time, resulting in an increase in public transport share;
-
Freight: The share of rail corridor transportation increases as migration of road-to-rail freight is promoted.
-
It is assumed that the efficiency of conventional ICE vehicles improves annually at a rate of 0.75%.
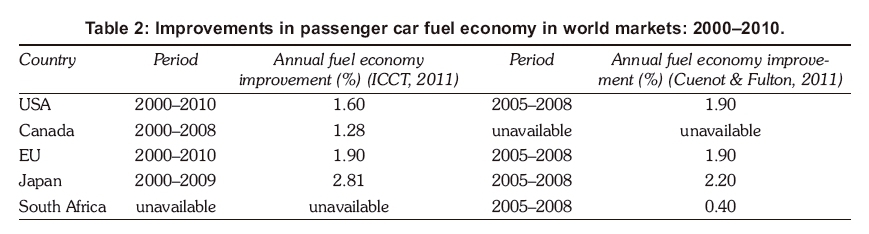
Fuel efficiency and future assumptions are based on data summarised in Table 2. These two sets are combined with variations in other SATIM parameters to generate the set of scenarios presented and discussed in this paper. The scenario development section describes the full matrix of scenario parameters. The demand projections generic to all scenarios and model assumptions are further described in Merven et al. (2017).
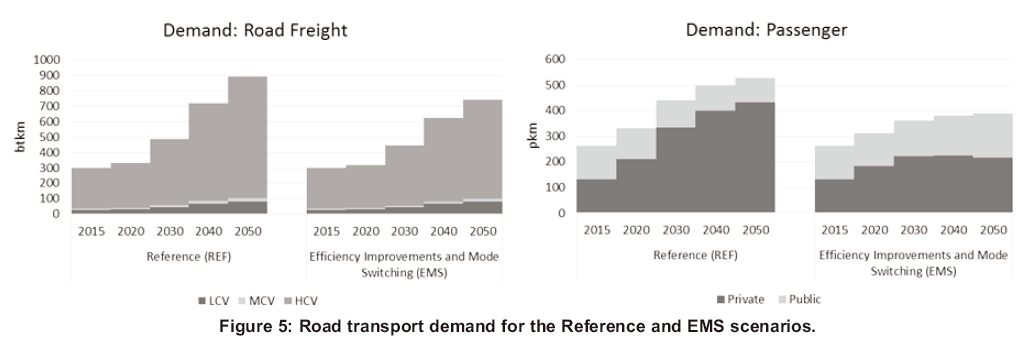
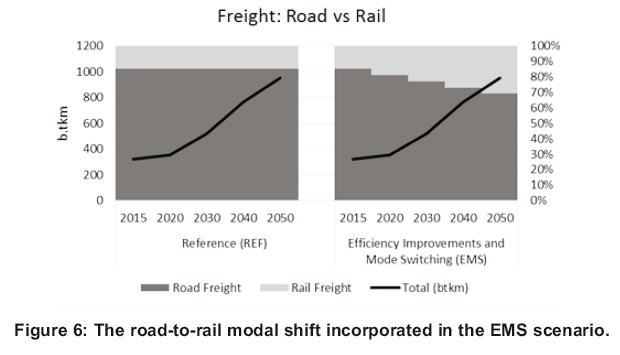
The demand forecasts for both freight and passenger transport are shown in Figure 2. In the freight sector, as indicated in Figure 3, the forecast demand for ton-kms is unchanged, with the primary reduction in road transport demand attributed to an increase in road-to-rail migration. In the Reference scenario, the share of rail freight remains constant at 15%, but grows to approximately 30% by 2050 in the EMS case. The reduction in passenger-kms in the EMS case is considered to occur as occupancy rates increase, private car ownership (high trip length) decreases and private car activity decreases.
3. Scenario development for the energy model
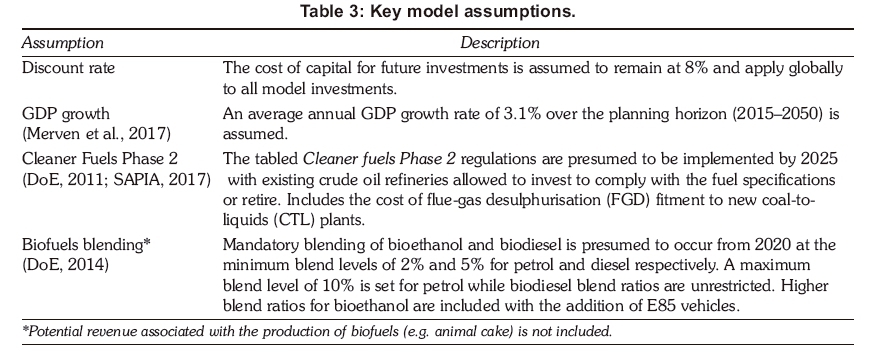
The state of road transport in South Africa in 2050 is subject to a multitude of interacting factors, which, by their inherent uncertainty, requires the formulation of a coherent set of scenarios describing feasible futures for the transport sector. Table 3 presents assumptions on key drivers that apply to all scenarios.
3.1 Scenario matrix and descriptions
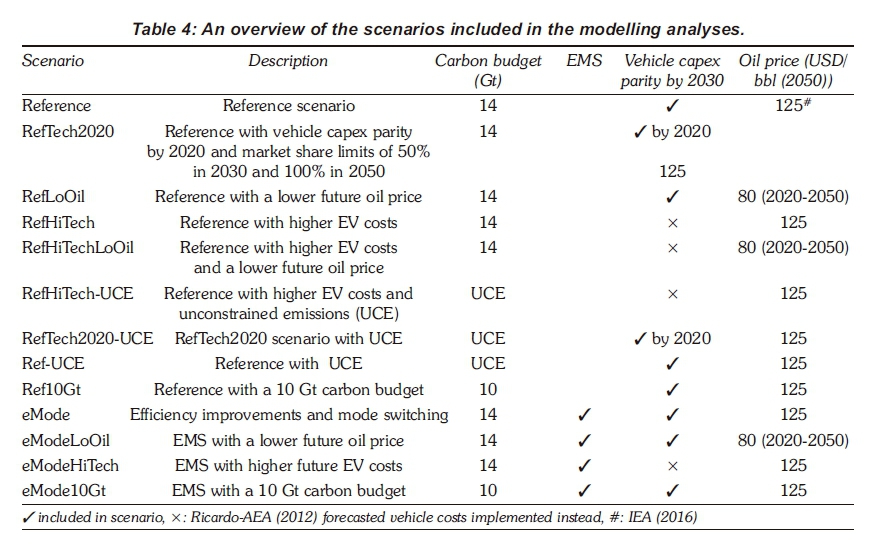
The portfolio of scenarios modelled for this study is summarised in Table 4, which details the four most important factors driving the evolution of transport considered: the national carbon budget, the level of progression to be achieved in mode switching and efficiency improvement, the investment cost of new and emerging technologies (vehicle CAPEX), and the oil price. It is anticipated that a carbon budget of 14 Gt of CO2eq is imposed for the country and juxtaposed with the case of unconstrained emissions (Burton et al., 2016). As discussed earlier, the EMS case presents an alternative growth pathway for demand and technological progress. Despite disruptions to the conventional model of private vehicle ownership from market entrants such as Uber and the Bus Rapid Transit system, private vehicle ownership remains an aspirational goal for most households as it enables a high degree of personal mobility (Naughton, 2014; Williams, 2016).
The future choice of private vehicle is thought to be largely influenced by the initial purchase cost, with alternative technology choice a secondary consideration (Deloitte, 2014). The Ricardo-AEA (2012) 'Review of the efficiency and cost assumptions for road transport vehicles to 2050' forms the basis of comparative vehicle costs and on-road efficiency in SATIM. Given the inherent high uncertainty in forecasting long-term future investment costs (Wolfram and Lutsey, 2016; Pelletier et al., 2014), an optimistic case of vehicle purchase cost parity is included to gauge the sensitivity of technological adoption rates to purchase price. Bevis et al. (2013) suggested 2015-2020 as an EV parity date in the study of EV adoption drivers. For this study 2020 and 2030 are modelled as tentative years for purchase cost convergence (USA DoE, 2017; Carring-ton, 2016). It is assumed that both freight and passenger EVs would incur lower maintenance costs, which, including the cost of battery replacement over the vehicle life, would be 20% less than a conventional ICE vehicle that represents the lower value of reported and calculated ranges (Stone, 2017; Pelletier et al., 2015; e-Mobility NSR, 2013).
3.2 Refuelling and charging infrastructure costs
The prevalence of a particular vehicle technology is influenced by the availability of refuelling (or recharging) options (ESAA, 2014; 2013; van den Bulk, 2009). The extent of fuel distribution is, in turn, driven by comparative investment costs, which ultimately affect the cost of fuel. Distribution costs for competing fuels are shown in Table 5. The utility costs refer to the expansion of the centralised transmission and distribution network. The EV charging costs and efficiencies assume Level 2 charging for both residential and commercial premises and is adapted from USA data (Smith and Castellano, 2015; Snyder, 2012; Forward et al., 2013).

4. Results and discussion
The results of the optimisation modelling are presented and discussed according to themes of future transport technologies in the vehicle fleet, the impact on local refineries and the impact on the power sector. For the modelling horizon of 2050, the results are shown for the transitionary years 2030 and 2045. These milestone years provide an indication of a potential inflection and consequent transformation of the transport sector.
4.1 Demand and technology preference
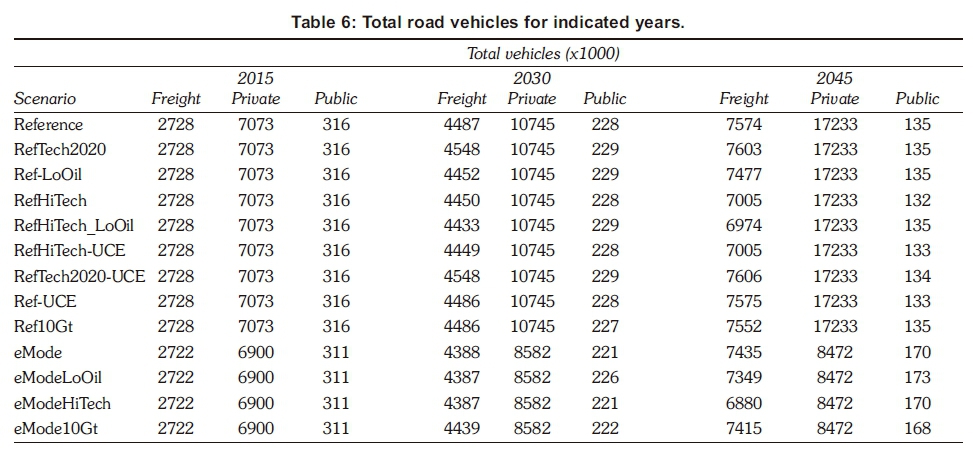
It was found that oil-based vehicles in 2015 dominate in the transport fleet and comprise petrol and diesel vehicles. Although in the model this class of vehicle includes hybrid range-extended and E85 vehicles, which depend on petroleum products, these vehicles are negligible in 2015. Table 6 lists the total fleet population for 2015 and for the selected milestone years. The private and freight vehicle fleet in SATIM is projected to grow by 260% in 2045 in the Reference scenario. The EMS scenario reduces the private vehicle fleet by approximately half as occupancy rates increase and public transport is promoted, resulting in about 25% increase in the public transport fleet in 2045. The public transport sector fleet in 2015 is dominated by minibuses.
In both the Reference and EMS cases, public transport is migrated to larger buses, which explains the decline in the public vehicle fleet in all the scenarios.
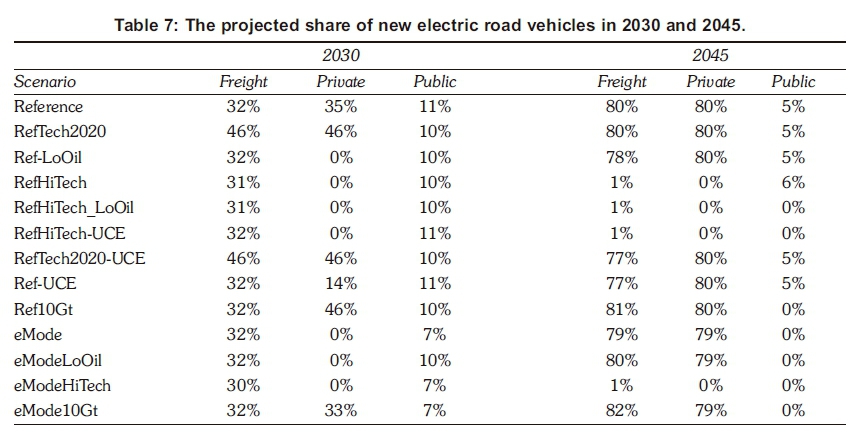
Table 7 displays the SATIM-projected share of new EVs in road transport. A preference for private and light duty freight EVs is observed, with EVs potentially accounting for 80% of new vehicles in 2045. Public transport EVs are less favoured, potentially accounting 5% of new vehicles in 2045.
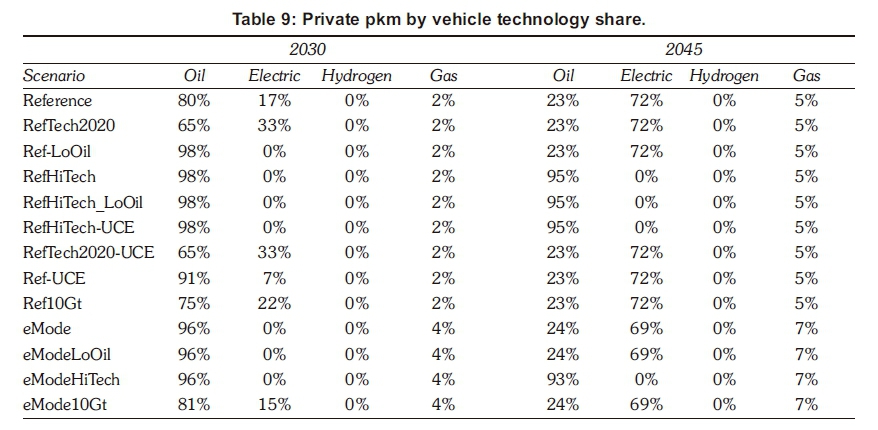
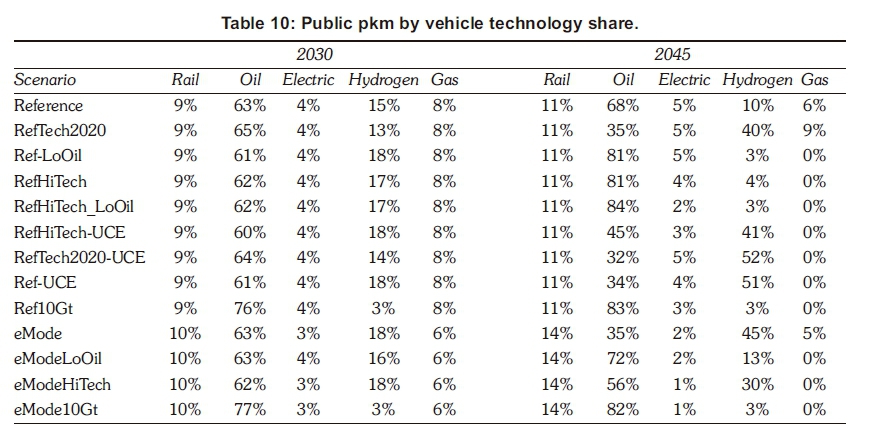
Tables 8-10 present the share of transport demand for each class of road transport vehicle: freight, private and public. Common to all three tables is the continued preference for oil product vehicles should the future oil price level at approximately USD 80/bbl rather than the IEA (2016) forecast of USD 125/bbl by 2050. This delays the economic preference for alternative vehicles towards the latter half of the planning horizon (2045). In particular, the penetration of EVs appears to be sensitive to future projected costs, with minimal uptake if vehicle purchase parity is not realised during the period.
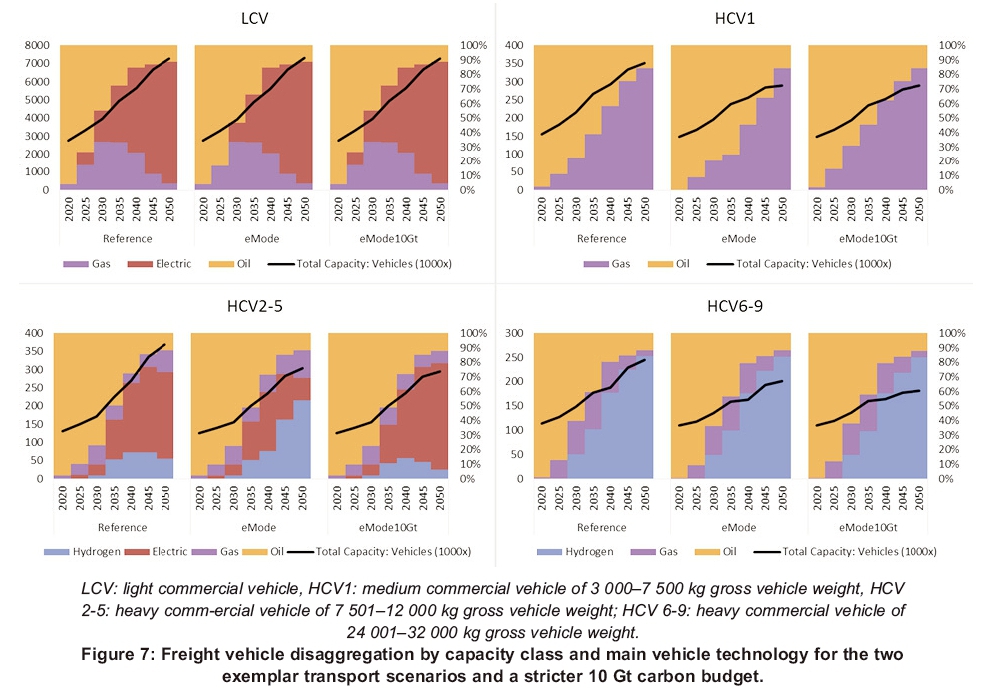
The ICEV shares in freight are less than in the passenger sector, ranging from 40-70%. This is largely because of the higher scrappage rates (capacity decay curves) attributed to freight vehicles resulting in a higher rate of fleet replenishment (Supplement, Table 42). In the interim period, 2015-2030, natural gas vehicles (NGVs) and hydrogen fuel cell vehicles (HFCVs) emerge as alternatives, with freight EVs contributing a minor role. Figure 7 illustrates the EV preference in freight vehicles for three scenarios typifying the transport scenario paths in the present study. The figure depicts vehicle technology preference by disaggregated freight class. It is observed that EVs by capacity are largely confined to light commercial vehicles, for which the tkm share grows to about 10% in 2045. The HCV6-9 category, which is larger by load class, is responsible for the bulk of road traffic, and a preference for HFCVs is noted, displacing oil and gas vehicles in the later period. The incurred additional cost of hydrogen production relative to diesel and natural gas is offset by the lower MJ per km of HCFVs (Supplement, Tables 3 and 5).
Table 9 shows that private EVs remain economically unattractive when there is about 30% premium relative to a petrol ICEV (Supplement, Table 3).
In the absence of tariff distortion, a purchase cost premium appears to be the main barrier. A smaller 10 Gt carbon budget does not appear to influence an earlier migration to EVs as the results are comparable to the 14 Gt Reference scenario. Similarly, efficiency gains in ICEs as incorporated in the EMS (eMode) scenarios do not impact the preference for private EVs. The EVs also appear as the main alternative to oil ICEs, with the choice of gas ICEs having minimal impact.
Results for the public transport sector are more varied relative to the freight and private sectors. Table 10 shows that, generally, hydrogen vehicles in public transport are advantaged when emissions are unconstrained (UCE) or an increasing share of passenger travel is met by public transport (eMode). A higher share of public passenger travel demand is met by HFCVs if vehicle costs are comparable by 2020. Lower future oil prices (LoOil) advantages oil-fuelled vehicles. These include minibuses, comprising hybrid and e85 fuel vehicles. Gas vehicles that meet close to 10% of demand are preferred over EVs, which have a minimal footprint in the fleet, providing less than 5% of public passenger travel demand. The travel mode shift to rail remains constant during this time at about 10%. Gas vehicles appear less likely to meet passenger demand towards 2050 as HFCVs are generally preferred. The future price of oil is a determinant in vehicle choice, as a lower future oil price (LoOil) favours diesel vehicles. The Ricardo-AEA (2012) paper suggested marginal price variation for HFCVs and NGVs compared with diesel vehicle; and main trade-offs are fuel cost and vehicle efficiencies. Ignoring distribution losses, which are minimal compared with production efficiency, HFCVs are in the order of 30-40% more efficient than ICEs (diesel and gas) and therefore fuel cost appears the driver of choice in the LoOil scenarios, which favour oil vehicles in 2045. The cost advantage of diesel fuel over hydrogen gas lies in the range of 580% (Supplement, Table 5). For the UCE scenario, hydrogen fuel, via the favoured steam methane reformation (SMR) process, enjoys approximately 10% advantage over diesel and it is in the Reference UCE scenarios that HFCVs are most favoured in public transport with 50% of passenger travel met in 2045. Conversely the LoOil and 10 Gt scenarios markedly reduce the share of HFCVs as hydrogen fuel becomes up to 80% more costly. Hydrogen production is curtailed because of the CO2-eq emissions associated with the SMR process, which is preferred over the more carbon-intensive coal-gasification and energy intensive electrolysis processes.
The generation portfolio in the power sector that would promote electrification of transport is further discussed in Section 4.3 along with the impacts on refinery capacity and production.
4.2 Fuel production and supply
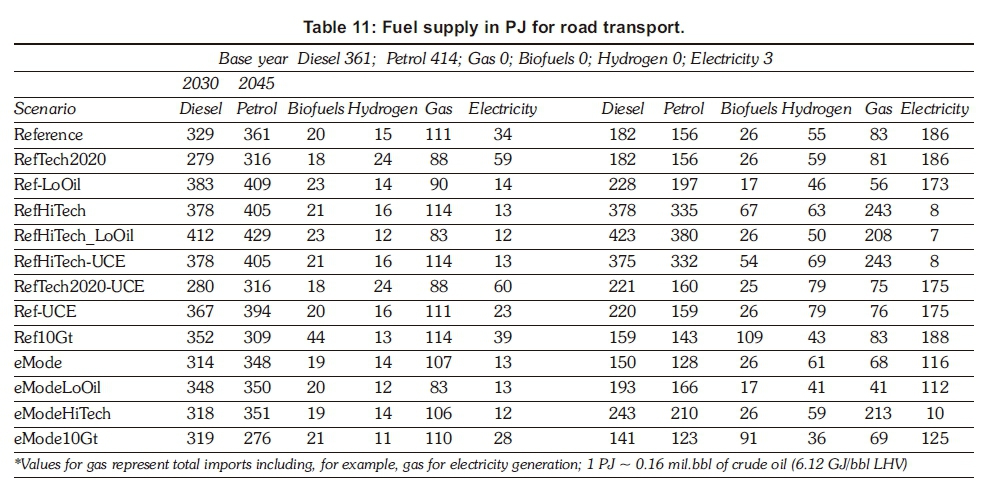
Table 11 provides an indication of the extent of domestic fuel supply and the reliance on imported finished product. The values shown are in peta-joules for ease of comparison of energy utility of fuels and include estimated 2015 fuel supply values as a reference. Fuel consumption by road transport in 2015 is estimated to be about 365 PJ of diesel and 422 PJ of petrol. Electricity as a fuel for passenger travel amounts to 3 PJ. Crude oil dependency for road transport, relative to 2015, decreases by about 85% in 2030 to about 55% in 2045 for the scenarios favouring higher market shares of EVs. A purchase cost premium of 20-30% in 2050 for EVs would see crude oil imports at similar levels to 2015 during 2030-2045. The importation of crude oil potentially increases at greater than 30% of present day levels by 2045 if future prices are less than USD 80/bbl.
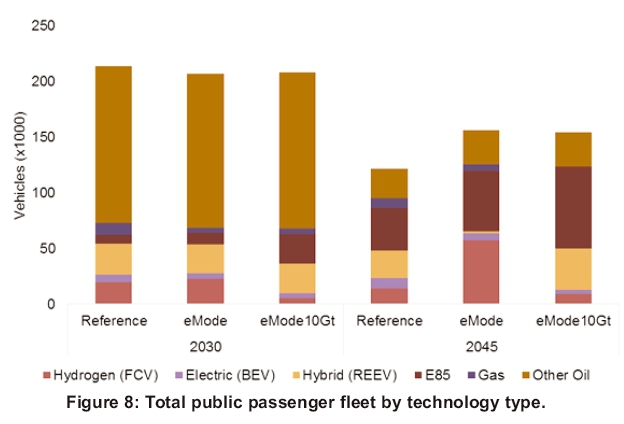
The prevalence of oil product vehicles in 2030 results in diesel and petrol remaining important fuels and together accounting for 75-90% of fuel supply. Supply of finished oil product, including imports, varies between approximately 50 and 75% by 2045. The petrol:diesel supply ratio in 2015 is about 1.15, indicating a preference for petrol ICE vehicles that remains until 2030 with the ratio exceeding 1. The ratio by 2045 exceeds 1, as diesel vehicles dominate in the ICE fleet. These results do not reflect externalities associated with diesel ICE emissions, which future regulations may limit (SAPIA, 2008). Liquid biofuels as a share of total liquid fuel supply remains low at 3% in 2030 and up to 8% in 2045 and is mainly utilised in the public transport sector in the minibus taxi fleet. The tabled mandatory fuel blend regulation is the primary driver of supply, except for the 10 Gt scenarios for which a 25% share of total liquid fuel supply is achieved, of which biodiesel is the preferred fuel. The minibus public transport fleet is the primary consumer of bioethanol, with E85 vehicles accounting for 40-50% of the total fleet; followed by HFCVs with 30-40%; and conventional diesel and petrol vehicles (Other oil) accounting for 20% in2045 (Figure 8).
A high level of oil product supply in 2045 results if EV vehicles do not achieve purchase parity and lower crude oil prices occur during the planning period. The scenarios that realise a high level of EVs in the vehicle fleet would reduce oil product supply from about 90 to 75% of total supply in 2030. Electricity as a transport fuel ranges from 1-7% of supply in 2030 to 1-30% of supply in 2045. The higher values reflect optimistic EV vehicle purchase costs, which results in a reduction in overall transport energy supply requirements from approximately 1 100-700 PJ for the Reference demand scenarios and 800-500 PJ for the EMS demand scenarios.
Freight road transport is the main consumer of natural gas. Natural gas as a transport fuel appears to stabilise at 10-20% of fuel supply from 2030 to 2045. Higher levels of supply of 20-30% in 2045 are reached for the pessimistic EV cost scenarios.
The 10 Gt scenarios increase gas imports by about 25% (200-230 PJ), which is primarily required for electricity generation.
A lower level of liquid fuel supply occurs under a stricter carbon budget, given the reliance on domestic coal-to-liquids (CTL) for 20-30% of fuel supply. This, which represents 20% of existing domestic refinery capacity (Table 12), accounts for about 10% of national emissions (excluding land use) with emissions of about 47 Mt CO2-eq/annum, compared with 3 Mt CO2-eq/annum for total crude oil refinery activity (Lozynskyy et al., 2014). A 10 Gt carbon budget scenario would require a cessation of CTL production before the technical retirement date in 2040, as indicated in Table 12. No new investment in CTL occurs except in the UCE scenarios. The UCE scenarios, which represent both pessimistic and optimistic EV adoption, would invest in new CTL capacity in the order of 25% of the existing CTL capacity. This amounts to about 40 000 bbl/day, or the equivalent of the existing gas-to-liquids plant in Mossel Bay. Gas-to-liquids is not discussed in the research presented here, as direct combustion ICE vehicles are preferred because of higher well-to-wheel fuel efficiencies, hence no new investment in GTL occurs.
The decision on the upgrade of existing crude-oil refineries to Euro5 fuel standard in 2025 is modelled as previously introduced (Table 3). Referring to Table 12, investment in the refurbishment of existing refineries occurs to meet fuel supply demand rather resort to imported product (Table 11). The pessimistic EV adoption scenario RefHi-Tech_LoOil, comprising higher EV costs and lower oil prices, would favour additional investment in new crude oil refinery capacity in the order of 25% of existing capacity or about 130 000 bbl/day (the Natref inland refinery has a reported capacity of 108 000 bbl/day).
Although the capacity of crude oil refineries remain fairly constant across the scenarios, their utilisation varies from 70-90% in 2030 to 40-90% in 2045. The low utilisation results from either the impost of a stricter 10 Gt carbon budget or high levels of EV shares in the road vehicle fleet, particularly private passenger vehicles, which comprise the bulk of road vehicles.
4.3 Electricity supply and emissions
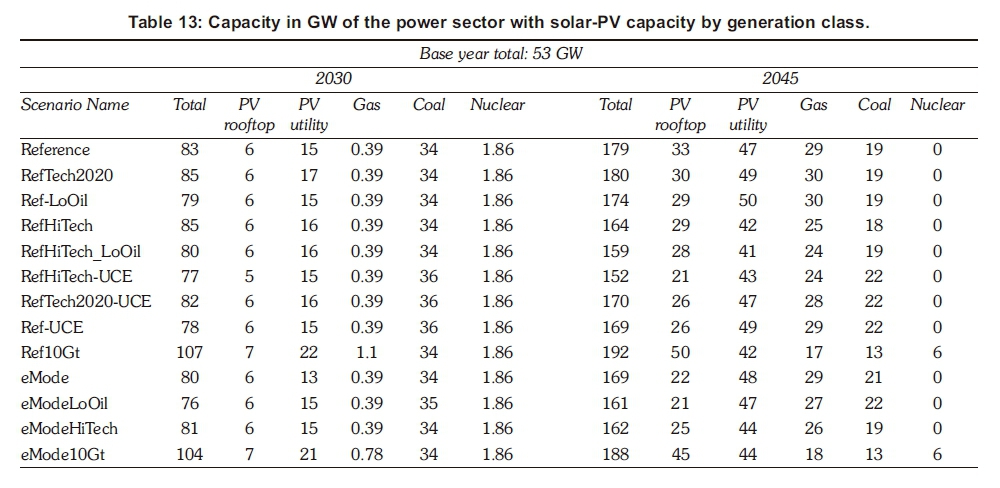
The electrification of road transport would shift fuel demand to the power sector, and the imposition of a carbon budget allows the model to optimise the carbon budget across the supply and demand sectors. Liquid biofuels was introduced as an option and RE for electricity supply presents another opportunity for low-carbon transport. Table 13 contrasts the generation capacity across the scenarios. Table 13 includes the disaggregated capacity of sSolar-PV generation by type, i.e., utility generation transmitted via the centralised transmission network; or roof-top distributed generation (without storage). The UCE scenarios represent the counter-factual generation capacity.
The optimistic EV scenario RefTech2020 requires an additional 10-20 GW of capacity compared with the pessimistic RefHiTech-UCE and RefHiTech_LoOil scenarios, which require about 75-150 GW of capacity in 2030-2045. The HiTech costs and LoOil price scenarios, which increase the reliance on refinery oil product and gas, have the effect of reducing the capacity required by the power sector. Since EVs are ~50% more fuel efficient than ICE equivalents, 20 GW of additional capacity reduces the total energy supply to transport by approximately 30% (Table 11).
New nuclear capacity of 6 GW is required to meet the 10 Gt scenario by 2045. An additional 5 GW of rooftop PV in the Reference 10 Gt case results in a marginal increase in total capacity of 4 GW such that the total power sector capacity of 192 GW represents the largest power sector build.
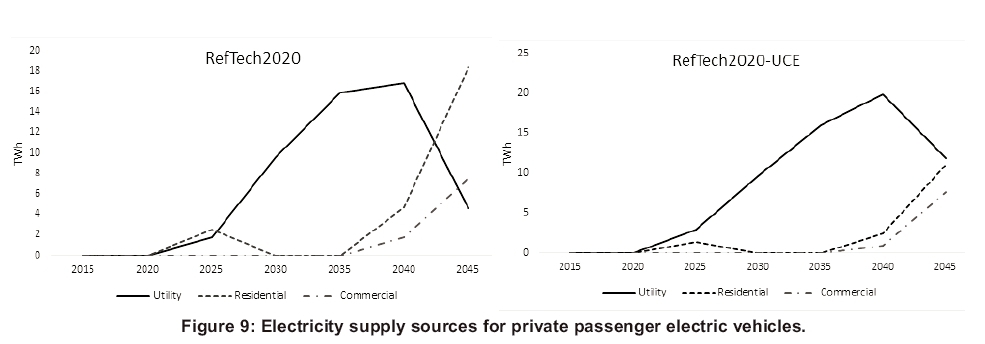
Figure 9 displays the electricity supplied to private passenger vehicles for the RefTech2020 scenario and its counterfactual UCE case. Private passenger fleet in 2030 consumes 70% of the 10 TWh supplied to road transport. The bulk of electricity supplied is utility-generated. Electricity is supplied in similar proportion via residential and utility-based supply in the initial phase of an earlier EV deployment (2020-2025). In 2025, residential electricity is favoured with a supply ratio of 1.4 for the reference 14 Gt scenario compared to a supply ratio of 0.5 for the UCE scenario where utility-based supply is preferred. As the EV fleet grows to reach 45% of new vehicles in 2030 and meet 33% of passenger private travel, utility-based electricity becomes the predominant supply. The modelling period 2035-2045 suggests a convergence of supply preference towards residential and commercial electricity as rooftop PV capacity grows.
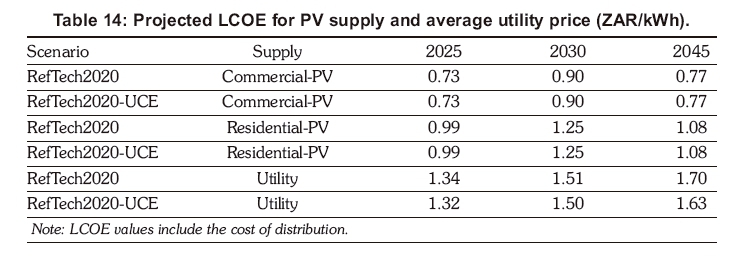
Although Table 14 suggests an economic preference for distributed PV throughout the period, PV supply is assumed to incorporate nil storage and thus only generates during daytime, with peak generation occurring around midday. The EVs in the national fleet are currently assumed to be charged on average constantly and therefore exhibit a uniform profile.
Improvement of the current EV model to incorporate and gauge the effects of driver behaviour with higher resolution time-of-use charging profiles and battery degradation effects is planned for future research (Nicholas et al., 2016; Pellettier et al., 2015; Wietschel et al., 2013).
Road transport electrification appears to have little impact on electricity prices, as the generation cost trajectory exhibits little variation across the scenarios except for the 10 Gt carbon budget scenarios, which act as the primary stimulus of an increase in generation cost (Figure 10). A general trend of increasing generation cost from 0.60 ZAR/kWh to 0.85 ZAR/kWh is observed, with the 10 Gt scenario approaching 1.10 ZAR/kWh, which is largely due to earlier investment in solar-PV (Table 13).
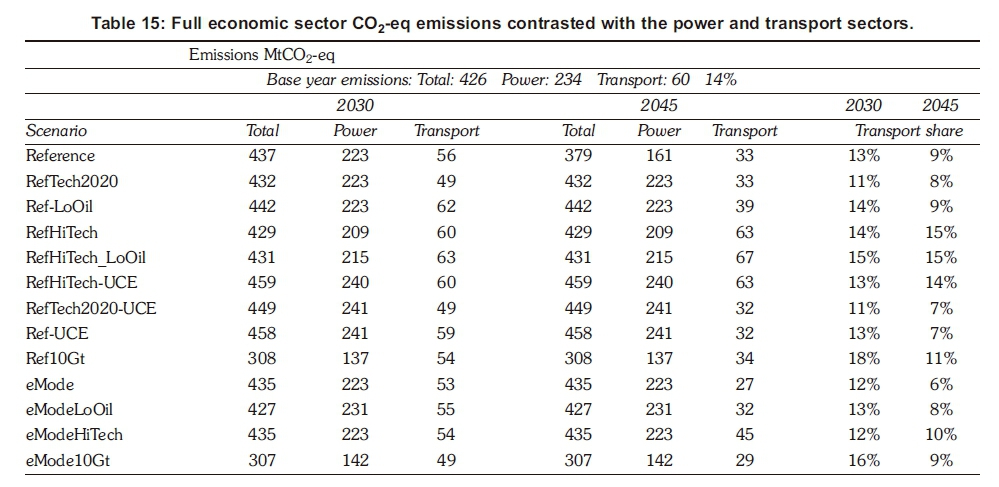
The subsequent GHG emissions associated with the transport sector and its share of the national budget is summarised in Table 15. Also included for comparison are the estimated values for 2015. In terms of magnitude, transport emissions generally appear to plateau at their 2015 levels by 2030. Optimistic EV purchase costs would result in a decline in relative emissions by 2030 and result in a 50% reduction in present day emissions by 2045 from 60 to 30 Mt CO2-eq. A lower future oil price and EV cost premium of up to 20-30% would plateau transport emissions across the planning period at 60 Mt CO2-eq, which is largely caused by the reliance on hybrid vehicles in the private passenger sector.
The EMS scenario with optimistic future vehicle cost exhibits the lowest emission trajectory, with a value of 27 Mt CO2-eq in 2045. The EMS scenarios are, however, not distinguished by their overall transport emissions as values occur in a similar range as the other scenarios.
The transport sector emissions, as a share of the national GHG emissions, would remain at current levels of about 14%, with high markets shares of oil product hybrid vehicles. This potentially decreases to less than 10% should there be a large uptake of EVs. The GHG emissions from the power sector appear to plateau across the planning period at their present-day level of approximately 235 MtCO2eq for all scenarios except the Reference and 10 Gt scenarios.
5. Conclusions
The South Africa TIMES model was used to examine how the transport sector would help South Africa transition to a low-carbon economy; how new and emerging technologies - more specifically electric vehicles - could play a role; and what would be the implications for the supply of transport fuels in the medium-to-long-term future. Oil product vehicles, which include hybrid and E85 vehicles, remain an important vehicle class until at least 2030. In all three road transport sectors (freight, private and public), lower forecast crude oil prices -USD 80/bbl from 2020 rather than USD 125/bbl by 2050 (IEA, 2016) - would encourage petroleum product consumption, increasing the share of internal combustion engine (ICE) vehicles during the interim horizon (2030). Crude oil dependency for road transport could plateau or increase to greater than 30%, relative to present day levels, should the price of oil reach less than USD 80 /bbl. Such a scenario effectively forestalls the emergence of electric vehicles (EVs) until the latter half of the planning horizon (2045), where EV preference is insensitive to oil price.
The results, however, suggest that uncertainty in vehicle purchase cost is the primary determinant of the rate and level of penetration of EVs into the vehicle fleet. Should vehicle cost parity be realised, EVs could account for a high share of in the future fleet, accounting for approximately 80% of new light vehicle sales in 2045 for both freight and private transport. Electricity would account for ~30% of transport fuels and reduce transport energy supply requirements by about 30% in 2045.
The power sector would consequently require an additional 10-20 GW of capacity during the later period, 2030-2045, increasing the importance of electricity as a road transport fuel. Emissions from transport would plateau in 2030 at their current estimated 60 MtCO2-eq in 2015 and decline to 30 MtCO2-eq by 2045, equating to less than 10% of national greenhouse gas emissions (excluding land use) present and future, as emissions from the power sector are expected to plateau at present-day levels with increased investment in renewable energy, specifically solar-PV (both utility and distributed) and gas.
Hydrogen fuel also emerges as an important alternative fuel for public transport and freight in the future. Within the freight sector, light commercials are the predominant adopters of bEV technology, whereas hydrogen fuel cell vehicles (HFCVs) are preferred for the bulk of the heavy vehicle fleet (>24 ton capacity) due to their extended range and higher well-to-wheel fuel efficiencies compared to diesel and gas. Diesel and gas remain important fuels. Uncertainty over future oil prices and EV costs could result in diesel and gas ICE vehicles respectively contributing 30% and 20% of freight demand in 2045.
A stricter carbon budget deters investment in HFCVs, due to the emissions associated with production, and instead favours biodiesel. Excepting the 10 Gt scenarios, a limited preference for biofu-els exists in the transport fleet and features mainly in the minibus public transport fleet.
Furthermore, the modelling indicates that investment in the refurbishment of crude-oil refineries to meet revised regulations for cleaner fuel standards is economically preferred over imported finished product.
The exploration of a number of scenarios with the SATIM model demonstrates the importance of a holistic, full-sector assessment encompassing technology preference, emissions, fuel consumption and supply options, as was noted in the results presented. However, when considering the transformation of transport, price distortions and policies such as fuel taxes and vehicle tariffs can act powerfully in the long term to either hinder or promote sustainable transport.
A limitation of this paper was the response in energy demand to driver behaviour and charging habits, research which requires a more granular temporal demand profile for EVs by driver profile. Also, at present the SATIM model does not incorporate distributed solar-PV with storage and its effects on the supply sector and transport vehicle choice. This remains the subject of further research including further detailed transport sector-specific analyses.
Notes
1. Electric vehicle in this paper refers to battery electric vehicles.
2. Supplementary material can be found at https://jour-nals.assaf.org.za/jesa/article/view/5596.
References
Alton, T., Arndt, C., Davies, R., Hartley, F, Makrelov, K., Thurlow, J. and Ubogu, D. 2014. Introducing carbon taxes in South Africa. Applied Energy 116, 344354. https://doi.org/10.1016/j.apenergy.2013.11.034 [ Links ]
Bevis, K., Smyth, A. and Walsh, S. 2013. Plugging the gap - can planned infrastructure address resistance to adoption of electric vehicles? Paper delivered at the European Transport Conference 2013. Conference theme: Low emission vehicles - providing infrastructure and achieving higher levels of usage. University of Hertfordshire, England. [ Links ]
Burton, J., Caetano, T., Hughes, A., Merven, B., Ahjum, F. and McCall, B. 2016. The impact of stranding power sector assets in South Africa: Using a linked model to understand economy-wide implications. Online: http://www.erc.uct.ac.za/sites/defaul/files/image_tool/images/119/Papers-2016/2016-Burtonetal-Impact_stranding_power_sector_assets.pdf [ Links ]
Caetano, T., Merven, B., Hartley, F. and Ahjum, F. 2017. Decarbonisation and the transport sector: A socioeconomic analysis of transport sector futures in South Africa. Journal of Energy in Southern Africa 28(4): 9-18. https://doi.org/10.17159/2413-3051/2017/v28i4a2945 [ Links ]
Carrington, D. 2016. Electric cars 'will be cheaper than conventional vehicles by 2022'. Online at: https://www.theguardianxom/environment/2016/feb/25/electric-cars-will-be-cheaper-than-conventional-vehicles-by-2022 [ Links ]
City of Cape Town. 2016. Transport for Cape Town: Strategies, policies and plans. Online at http://www.tct.gov.za/en/strategies/ [ Links ]
Cuenot, F and Fulton, L. 2011. International comparison of light-duty vehicle fuel economy and related characteristics. Paris: International Energy Agency. [ Links ]
Deloitte. 2014. Global automotive consumer study. Exploring consumers' mobility choices and transportation decisions. Deloitte LLC, United Kingdom. [ Links ]
Department of Energy. 2011. Discussion document on the review of fuel specifications and standards for South Africa. Government Gazette No. 33974. Government Printer: Pretoria. [ Links ]
Department of Energy. 2014. Draft position on the South African biofuels regulatory framework. Government Gazette No. 37232. Government Printer: Pretoria. [ Links ]
Department of Energy. 2016. Draft Integrated energy plan (IEP) report. Department of Energy, South Africa. Pretoria. 25th November 2016. [ Links ]
Department of Energy. 2017. Presentation to the portfolio committee on energy updates on IEP. Department of Energy, South Africa. 14 February 2017. [ Links ]
Department of Transport. 2016. National Transport Master Plan 2050 Synopsis report. Online: http://www.transport.gov.za/web/department-of-trans-port/natmap-2050 [ Links ]
E-Mobility NSR (North Sea Region Electric Mobility Network). 2013. Comparative analysis of European examples of schemes for freight electric vehicles. Online at http://e-mobility-nsr.eu/fileadmin/user_upload/downloads/info-pool/E-Mobility_-_Final_report_7.3.pdf [ Links ]
Energy Supply Association of Australia. 2013. Sparking an electric vehicle debate in Australia. Discussion paper, November 2013. ESAA. Melbourne, Australia. [ Links ]
Energy Supply Association of Australia (ESAA). 2014. Developing a market for natural gas vehicles in Australia. Discussion paper, June 2014. ESAA. Melbourne, Australia. [ Links ]
Forward, E., Glitman, K. and Roberts, D. 2013. An assessment of level 1 and level 2 electric vehicle charging efficiency. To investigate potential applications of efficiency measures to various electric vehicles and their supply equipment. Vermont Energy Investment Corporation. Canada. [ Links ]
Gajjar, H. and Mondol, J.D. 2015. Techno-economic comparison of alternative vehicle technologies for South Africa's road transport system. International Journal of Sustainable Transportation 10(7): 579589. http://dx.doi.org/10.1080/15568318.2015.1026007 [ Links ]
International Council on Clean Transportation (ICCT). (2011). Global comparison of light-duty vehicle fuel economy/GHG emissions standards August 2011 update. International Council on Clean Transportation. [ Links ]
International Energy Agency (IEA). 2016. World Energy Outlook 2016. IEA, Paris. [ Links ]
Jechura J. 2015. Hydrogen from natural gas via steam methane reforming. Colorado School of Mines. USA. Online at: http://inside.mines.edu/~jjechura/EnergyTech/07_Hydrogen_from_SMR.pdf [ Links ]
Lozynsky, Y., Neelis, M., Blinde, P, Lewis, Y, Cohen, B., van der Merwe, A.B. and Patel, I. 2014. Emissions intensity benchmarks for the South African carbon tax. Technical support study. Ecofys. Utrecht. [ Links ]
Merven, B., Stone, A., Hughes, A. and Cohen, B. 2012. Quantifying the energy needs of the transport sector for South Africa: A bottom-up model. Energy Research Centre, University of Cape Town. Online: http://www.erc.uct.ac.za/sites/defaul^files/image_tool/images/119/Papers-2012/12-Merven-etal_Quantifying_energy_needs_transport%20sector.pdf [ Links ]
Naughton, N. 2014. Millennials drawn to car-sharing services, but eventually, they buy. Online at http://www.autonews.com/article/20140726/RETAIL/307289990/millennials-drawn-to-car-sharing-ser-vices-but-eventually-they-buy (Accessed: 03 April 2017) [ Links ]
Nicholas, M., Tal, G., and Turretine, T. 2016. Advanced plug-in electric vehicle travel and charging behavior. University of California, Davis. Online: https://itspubs.ucdavis.edu/wp-content/themes/ucdavis/pubs/download_pdf.php?id=2712 [ Links ]
Nijhout, P. Wood, R. and Moodley, L. 2001. An example of public transport modelling with Emme/2. 20th South African Transport Conference: Meeting the Transport Challenges in Southern Africa. South Africa, 16 - 20 July 2001. Document Transformation Technologies, South Africa. [ Links ]
Ortmann, G.F 1985. The economic feasibility of producing ethanol from sugar-cane in South Africa. PhD dissertation, University of Natal, Pietermaritzburg, South Africa. [ Links ]
Pellettier, S., Jabali, O. and Laporte, G. 2014. Battery electric vehicles for goods distribution: A survey of technology, market penetration, incentives and practices. Interuniversity Research Centre on Enterprise Networks, Logistics and Transportation, Canada. [ Links ]
Pellettier, S., Jabali, O. Laporte, G. and Veneroni, M. 2015. Goods distribution with electric vehicles: Battery degradation and behaviour modeling. Interuniversity Research Centre on Enterprise Networks, Logistics and Transportation. Canada. [ Links ]
Perold, A.D. and Andersen, S.J. 2000. An appropriate strategic modelling approach for South Africa. Presented at: South African Transport Conference: Action in Transport for the New Millennium. South Africa, 17-20 July 2000. Document Transformation Technologies, South Africa. [ Links ]
Ricardo-AEA. 2012. Road vehicle cost and efficiency calculation framework 2010-2050. Report #ED57444. United Kingdom. [ Links ]
South African Petroleum Industry Association. 2008. Petrol and diesel in South Africa and the impact on air quality. SAPIA, South Africa. [ Links ]
South African Petroleum Industry Association. 2017. Cleaner fuels II. Online at http://www.sapia.org.za/Key-Issues/Cleaner-fuels-II (Accessed 30 March 2017) [ Links ]
Smith, M. and Castellano J. 2015. Costs associated with non-residential electric vehicle supply equipment. Factors to consider in the implementation of electric vehicle charging stations. Department of Energy, USA. [ Links ]
Stone, A. 2017. Personal communication: Estimating relative maintenance costs for electric vehicles. [ Links ]
Stone, A., Merven, B., Maseela, T. and Moonsamy, R. 2018. Providing a foundation for road transport energy demand analysis: The development of a vehicle parc model for South Africa. Journal of Energy in Southern Africa 29(2): 29-42. https://doi.org/10.17159/2413-3051/2018/v29i2a2774 [ Links ]
Snyder, J. 2012. Financial viability of non-residential electric vehicle charging stations. Luskin Center for Innovation. University of California, Los Angeles. [ Links ]
Trading Economics. 2017. South Africa GDP growth rate. Available online: https://tradingeconomics.com/south-africa/gdp-growth [ Links ]
United States of America Department of Energy. 2017. Vehicle cost calculator. Alternative fuels data center. Online: http://www.afdc.energy.gov/calc/ (Accessed: 04 April 2017) [ Links ]
Van den Bulk, J. 2009. The development of the costs and benefits of cars powered by gasoline, electricity and hydrogen in the Netherlands in the period 2008-2030. Wageningen University. Netherlands. [ Links ]
Venter, C.J. and Mohammed, S.O. 2013. Estimating car ownership and transport energy consumption: a disaggregate study in Nelson Mandela Bay. Journal of the South African Institution of Civil Engineering 55(1): 2-10. Online: http://www.scielo.org.za/scielo.php?script=sci_arttext&pid=S1021-20192013000100001&lng=en&tlng=en [ Links ]
Wakeford, J.J. 2013. Preparing for peak oil in South Africa. An integrated case study. Chapter 2: Energy. Springer. DOI 10.1007/978-1-4614-9518-5. [ Links ]
Wietschel M., Plotz P, Kuhn A., and Gann T. 2013. Market evolution scenarios for electric vehicles. Fraunhofer Institute, Karlsruhe, Germany. [ Links ]
Williams, G. 2016. The disruption in car ownership. Online at http://www.fin24.com/Finweek/Opinion/the-disrup-tion-in-car-ownership-20160517 (Accessed: 03 April 2017). [ Links ]
Wolfram, P and Lutsey, N. 2016. Electric vehicles: Literature review of technology costs and carbon emissions. Working paper 2016-14. The International Council on Clean Transportation. Online: http://www.theicct.org/lit-review-ev-tech-costs-co2-emissions-2016. [ Links ]
* Corresponding author: Tel: +27 (0)21 650 2577; Email: mf.ahjum@uct.ac.za

