


Services on Demand
Article
 English (pdf)
 Article in xml format
 Article references
Indicators

Related links
-
 Cited by Google
 -
 Similars in Google
Share

 Permalink
Journal of Energy in Southern Africa
On-line version ISSN 2413-3051
Print version ISSN 1021-447X
J. energy South. Afr. vol.29 n.3 Cape Town Aug. 2018
http://dx.doi.org/10.17159/2413-3051/2018/v29i3a3058
ARTICLES
Novel measurement and verification of irrigation pumping energy conservation under incentive-based programmes
M.E. Storm*; R. Gouws; L.J. Grobler
School of Electrical, Electronic and Computer Engineering, North-West University, Potchefstroom Campus, Private Bag X6001, Potchefstroom 2520, South Africa
ABSTRACT
In most countries the agricultural sector, especially crop irrigation, is a considerable energy consumer. Farm irrigation studies in South Africa showed that energy and water is wasted on a large scale and there is a large potential for improving efficiency. The present study focusses on the measurement and verification (M&V) of irrigation pumping energy conservation measures (ECMs) under the Eskom Standard Product Programme funding mechanism in South Africa. A novel M&V methodology was developed to quantify ECM impacts under the Programme, which has special conditions and unique M&V requirements, which makes normal approaches inapplicable. Methods were designed to effectively determine conservative but representative impacts without continuous power demand profile measurement. The design involved unique methods to quantify operational demand reduction, annual energy consumption and annual average demand reduction impacts. The design was broadened to include pumps irrigating multiple crop areas and different kind of crops. The methodologies and
techniques developed were validated and verified through establishing independent cross-check measures. The paper discusses a regional top-down M&V approach to verify the actual total energy efficiency and load reduction on the electricity grid for a specific region.
Highlights
● Irrigation energy conservation measures under incentivised programmes.
● The M&V of irrigation pumping energy efficiency under the Eskom Standard Product Programme.
● Instantaneous and average demand reduction with annual energy consumption reduction.
● Quantify impacts without continuous power demand profile measurement.
Keywords: energy efficiency; demand side management; variable speed drive; load reduction; crop load factors
1. Introduction
Most countries use irrigation pumping to increase crop yield, to different extents depending on climate and yearly precipitation. In most of the world about 70% of freshwater demand is for irrigation, and in barren and semiarid regions the value reaches 90% (Molden, 2007). Irrigation in South Africa, compared with other sectors, is by far the biggest water user (Du Plessis, 2009). According to the Department of Water and Sanitation (DWS) 20132015 annual strategic overviews of the water sector in South Africa, 62% of South Africa's yearly rainfall water yield was used in those years for agricultural purposes (DWS, 2013; DWS, 2015). On the energy front, the agricultural sector in South Africa contributed 4.7% of electricity sales in 2016, according to Eskom's integrated results (Eskom IDM, 2016). Internationally, Naylor (1996) found irrigation to be the major energy consumer at farm level in other countries. On-farm irrigation pumping is responsible for 23-48% of direct energy consumption allocated for crop production (Hodges et al., 1994; Singh et al., 2002; Lal, 2004), with the figure highly dependent on climatic regions, farming practices, crop type and use of utility power.
The agricultural sector is prone to energy and water wastage through inefficient practices, poor irrigation systems and leaks (Standard Product Programme irrigation supplementary measurement verification and guideline, 2013). Energy and water wastage can be improved or managed by energy conservation measures (ECMs), which can be irrigation energy efficiency (EE) projects or projects which shift the irrigation pumping load away from power utility peak periods. The ECMs can be utility-driven projects or incentivised programmes such as the following:
-
government- or utility-funded energy service company projects, such as the Eskom integrated demand management programme (2017);
-
the EE rebates or tax rebates like those covered by Section 12L of the South African income tax act (South Africa Government Gazette 2013, 2013);
-
the EE trading mechanisms such as white certificate schemes (Tyler et al., 2011) or carbon-trading through schemes like the clean development mechanism (Winkler and Van Es, 2007);
-
vertically integrated national appropriate mitigation actions (Dazé et al., 2016); or
-
the anticipated South-African carbon tax (Department of National Treasury South Africa, 2015).
Under the Eskom demand side management (DSM) programme, now known as the Eskom integrated demand management (IDM) programme, many load-shifting and EE projects were carried out in residential, commercial, industrial and mining environments. These included several farming irrigation pumping load-shifting projects (Storm et al., 2008). Projects were mainly interventions that could have a large Eskom peak period demand reduction or a significant EE impact, where some projects implemented both evening peak load-shifting and EE by simultaneous application.
All projects needed to show credibility, and measurement and verification (M&V) had to be applied to evaluate attained impacts (Van der Merwe, 2011), since public funding was provided by the National Energy Regulator of South Africa (NERSA) for the Eskom projects. Intensive M&V on these projects was therefore performed to assess project impacts and report to the stakeholders. The function of M&V is to independently and objectively quantify project impacts and sustainability of impacts over an agreed contractual project life (Den Heijer, 2010). All M&V practices were based on the international performance M&V protocol (IPMVP Committee, 2012). From this, South African M&V practice guidelines (Den Heijer, 2010) were developed, culminating in the establishment of a national standard: SANS 50010:2011 (South African Bureau of Standards (SABS), 2011), recently updated to SANS 50010:2018 (SABS, 2018).
As well as large DSM projects, small-scale EE projects can also add to the national IDM energy use performance improvement and were therefore also implemented to reduce energy consumption for cost saving. The Eskom Standard Product Programme (SPP) was established to provide rebates for these small projects and fasttrack implementation and associated performance assessments at a lower overall assessment cost. A project and a programme essentially differ in that a programme is an ongoing roll-out of a fixed technology over many sites, while a project considers a set target defined over certain site(s) (Coetzee et al., 2012) and is not limited to a specific technology. An energy-saving rebate under the SPP is paid to participating parties who replace a standard old, inefficient technology with a standard and proven EE technology. The technologies initially allowed under the SPP included EE lighting, heat pumps, EE shower-heads and solar water heating (Van der Merwe, 2011).
An Eskom IDM energy advisor team (Scheepers et al., 2013) also set out to establish an Eskom programme for irrigation demand reduction and EE. Here, some larger projects fitted under the Eskom Standard Offer Programme (Eskom IDM), which still required conventional M&V (Hibberd, 2011; Den Heijer et al., 2010). The majority of potential projects needed to fit under the SPP, however. According to Van der Merwe (2011) these SPP small-scale projects require a generalised approach that gives acceptable saving impact indication. This M&V approach recognises a deemed saving rather than a measured saving as with conventional M&V. Several projects could be implemented per site subject to a single project size, each limited to 100 kW average demand reduction during weekdays, and a maximum total of 250 kW impact per site.
Conventional M&V of irrigation projects has already proved to be exceptionally challenging (Storm et al., 2016). It is difficult to determine the efficiency or inefficiency of water usage in irrigated agriculture because it is a 'multiple input - multiple output process' (Malana and Malano, 2006; Rodríguez Díaz et al., 2004). The difficulty of conventional irrigation M&V called for a new and unique M&V methodology to quantify ECM impacts under the SPP and other incentive-based programmes. The focus of this study is therefore M&V on irrigation SPP projects and the novel M&V methods developed to quantify the impacts of these projects.
2. Conventional M&V methods vs SPP M&V requirements
Conventional M&V methods are normally applied on ECM projects with a large demand or EE reduction. This was common practice on large irrigation projects under the Eskom DSM programme, where the ECM intervention cost is high and the total M&V cost involved only a fraction of the total project. The large EE or demand reduction achieved relates to large incentives paid to the ECM project owners. Many implemented demand reduction projects have moved several MW from the evening peak to other times.
It is important for all stakeholders within such an environment to have very accurate M&V results with a high confidence level. Also, the exact project performance must be tracked over the entire project life to ensure that the project targets are met. Here, M&V is critical and the associated cost easily justifiable. The M&V process on these projects require the following critical components and actions (Storm et al., 2008; Van der Merwe, 2011):
-
properly define the baseline boundary, which include ECM intervention and all interactive effects;
-
define an energy governing factor as;
-
proper M&V demand profile metering (billing class in most cases) is required;
-
define a functional baseline metering period to capture all project variations and circumstances - anything from a few months to several years;
-
baseline model development - the baseline typically consisting of average weekday, Saturday and Sunday demand profiles;
-
baseline assumptions made on project parameters and conditions where the baseline is applicable;
-
a baseline service level adjustment method to adjust the baseline relevant to the operation conditions it would have experienced if the ECM was not implemented. This is done by using the referenced energy driver; and
-
calculate savings over the project life. This is normally done on a monthly or quarterly year basis. The participating members in the project receive incentives based on the results of the M&V project performance reports.
This conventional M&V method requires extensive baseline development and independent M&V specialists are required throughout the project life to track ongoing savings. Metering and data gathering can be cumbersome and also very expensive.
The SPP M&V approach fundamentally differs from the traditional M&V in the following aspects:
-
no profile metered baseline period and no reference energy drivers;
-
no ongoing metering is performed on the ECM after implementation;
-
no profile baseline development; and
-
the incentive is paid to participating parties at the beginning of the project, on a projection of the savings over the following three years. There is, therefore, no ongoing tracking of the project performance.
Considering these, the SPP has unique requirements that make conventional M&V approaches inapplicable. A new M&V methodology was required to assess SPP ECMs and quantify projected impacts without conventional M&V methods, while still having an acceptable confidence level.
3. Novel integrated M&V methodology for the SPP
A novel integrated M&V methodology was developed to conservatively quantify load reduction and energy efficiency resulting from ECMs under the SPP. The scientific approach was developed through a comprehensive study of all SPP requirements, project parameters, system boundaries and approach limitations. The integrated methodology includes the key components displayed in Figure 1.
Specific methodology design validation and verification parameters were set as Figure 1(a), (c) and (d).
Figure 1(b) shows the key concepts of the integrated methodology described in the present study. The ECM evaluation looked at how an evaluation criterion can be devised to assess different ECM approaches to ultimately find a sustainable and quantifiable ECM. This then considered how this ECM was applied and how it led to demand reduction and energy saving. The design of assessment/measurement procedures examined the following:
-
design a measurement procedure to assess actual attainable impacts through the chosen ECM;
-
design a measurement procedure to accurately apply the aforementioned even when the ECM was already implemented, and no baseline measurements were possible; and
-
design a measurement procedure to accurately isolate and quantify the impact of the preferred ECM where other ECMs were also implemented.
Case studies following compartment (iii) of Figure 1(b) were performed to evaluate the actual attainable impacts of the chosen ECMs. Compartment (iv) shows the design of a SPP measurement methodology that includes:
-
establish a measurement method to quickly and effectively quantify a conservative but representative load reduction or load shift without profile measurement. Broaden this method for an irrigation pump feeding multiple crop areas and having more than one crop type per centre pivot; and
-
establish a functional method to quantify annual conservative but representative energy use impacts of an irrigation pump from the load reduction values. Then broaden the method to an irrigation pump feeding multiple crop areas and having more than one crop type per centre pivot.
Figure 1(a) shows that design validation is done by adhering to the SPP requirements, project parameters, system boundaries and approach limitations. As a design verification in Figure 1(c), all methods and procedures must be aligned with international M&V protocols and standards. Here, the IPMVP and SANS 50010:2011 was applied. Not all the steps are fully discussed in this study because of the size and complexity of the development. Figure 1(d) gives an independent method to validate the SPP M&V methodology and the actual results obtained from ECMs under the SPP. This is further disused in Section 8.
4. The ECM evaluation
Compartment (i) in Figure 1(b) presents ECM evaluation as the first key concept of the integrated M&V methodology. This section considers an ECM evaluation by discussing what ECM technologies can be implemented and how these can be applied to lead to demand reduction and energy saving.
4.1 The ECM evaluation criteria
Since no standard tried and proven irrigation EE technology had been found for the SPP, a study on inefficient irrigation practices and possible ECMs was performed (Storm et al., 2008). It considered what ECMs can be implemented to give measurable and sustainable energy saving over the project life with a high confidence level. The study concluded that pump system design and setup system improvements can satisfy these requirements. The technology chosen to best fit the SPP was variable speed drives (VSDs), through which the pumping system can be optimised to achieve demand reduction and energy saving.
4.2 Application of ECM: How it leads to demand and energy saving
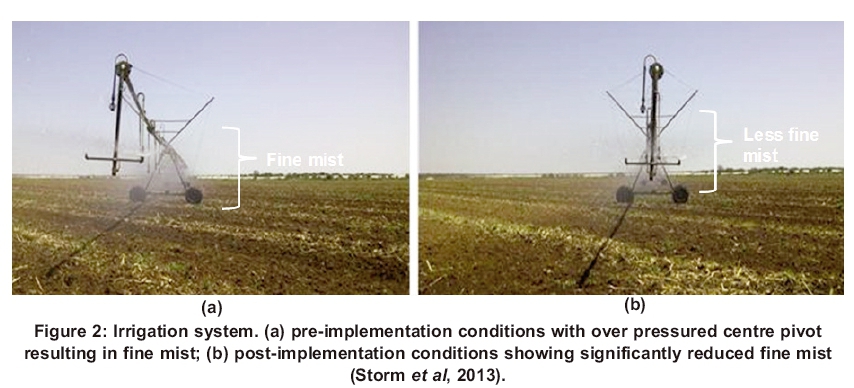
It is important to note that a VSD on its own will not necessarily improve EE. The VSD, however, is a 'tool' that enables EE, which is not possible with standard pumping equipment. Figure 2(a) shows a centre pivot running in pre-ECM implementation conditions. Generally, it is found that centre pivots are over-pressured, resulting in ineffective irrigation.
In these conditions, the sprinklers create a fine mist, which increases evaporation, thus wasting water and subjecting the pump motor to a higher load by the higher system pressure. In South Africa, it is frequently found that irrigation engineers have overdesigned an irrigation system, especially the older ones. The system can be optimised by reducing the motor speed with a VSD so that the choking valves can be completely opened (Scheepers et al., 2013). The water delivery rate is now controlled by the VSD and no more chocking is required. The pumping system is further optimised by reducing the centre pivot pressure to an optimum level. Figure 2(b) shows less mist is created since the centre pivot pressure was significantly reduced.
This optimal pressure changes the water mist to larger droplets, which have less 'in flight' evaporation (Morris and Lynne, 2006). Since the pump is not chocked anymore and the pressure is lower, a demand reduction as well as EE is realised. The lower pressure also results in less overall water being pumped and less water wasted by evaporation.
5. Design measurement procedures
Compartment (ii) in Figure 1 presents the design of measurement procedures as the next key concept. These design procedures are necessary to quantify the actual attainable impacts through SPP ECMs. The measurement procedures described relate to the conventional M&V methods given in Section 2. Although these methods will not be used in actual SPP M&V project impact projection, they are required in the present study to evaluate what real-world impacts can be achieved. Full M&V is, therefore, used to provide a sampled impact result according to certain project characteristics that can then representatively be applied to other similar projects to ascertain their likely EE impact results.
5.1 Measurement procedure to assess actual attainable impacts
The procedures involved baseline audits through independent validators and proper baseline and post-implementation profile measurements by means of reliable metering, as described below.
Baseline conditions audit
An independent validator is required to visit and assess a pump station and the irrigation system setup before any EE initiatives are considered or discussed with the farmer or any farmers in the region. This can be done through independent audits in an area well before any ECM programme. This is necessary to establish proper baseline conditions without interference. It is important that the baseline conditions may not be influenced for example, any discussion with the farmer might influence him to start operating more efficiently, thus changing the baseline operation. And the moment the typical ECM implementation procedures become available or common knowledge, 'creative savings' may surface through changing the system baseline conditions to run more inefficiently before auditors arrive. It is important during the audit that the exact operational conditions are recorded. This includes different crop areas and circles fed by a specific pump, the valve positions for each pumping scenario, and the operational pressure of each irrigation setting.
Metering installation and verification
Before the ECM is implemented, pump station operational data should be collected, through reliable meters installed on each pump in a station. The correctness of all installations must be verified through calibrated check metering. As an example, a case study of a pump irrigation system with three centre pivots is discussed with the aid of Figure 3, where in Figures 3(b) and (c) the meter installation is verified by using a calibrated handheld and a temporary Fluke power meter.
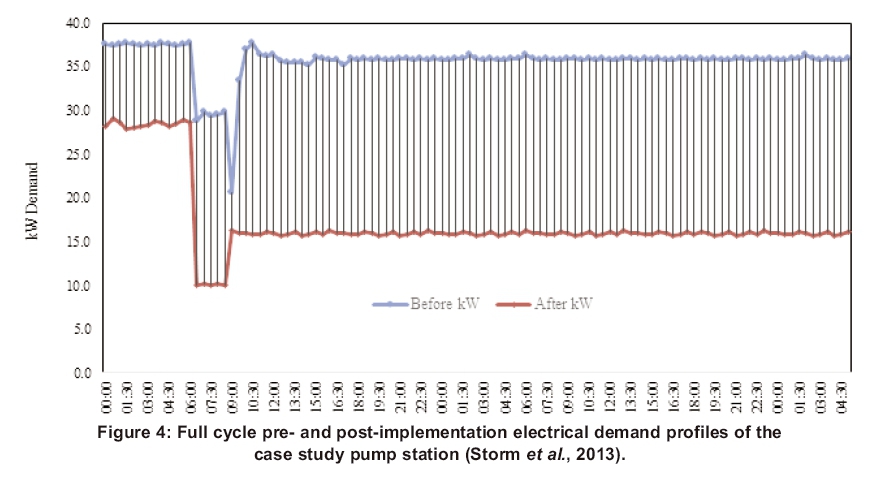
Baseline measurements
After metering equipment installation verification, full baseline data capturing can be started. For sufficient baseline data, the centre pivots go through the full irrigation cycle. With this, all different pumping scenarios and conditions can be recorded. Figure 4 shows the full cycle pre- and post-implementation demand profiles of one of the case study pump stations. The top line shows a 53-hour full irrigation cycle energy demand profile of the irrigation pump, revealing three distinct operational scenarios: the profile starts at about 37 kW, then drops to about 29 kW for about three hours, and then stabilises to about 36 kW for the rest of the period. These three different demand conditions are caused by the pump irrigating the three different centre pivots. Water supply is moved to specific crops through supply lines by changing valves.
Post-implementation metering
After the ECM was implemented and the system optimised, the same irrigation cycle is repeated with the different pumping scenarios. Figure 4 shows the post-implementation demand profile as the bottom line on the graph, allowing a clear comparison with pre-implementation demand. For most of the irrigation cycle there was a typical 20 kW difference. The shaded area between the two profiles represents the energy demand reduction achieved over the full irrigation cycle.
5.2 Assessment where baseline measurements were not possible
In cases where it was not possible to install temporary baseline metering before the ECM, an alternative approach was required to quantify the attained impacts. A measurement procedure was established for determining impacts when the ECM was already implemented. In these cases, valid information from a proper baseline audit is required as per Section 5.1. The pumping system can be brought to pre-implementation (baseline) conditions by setting the VSD back to 50 Hz and returning pipeline valves to the pre-chocking settings and system pressures, thus essentially 'eliminating' the presence of the VSD. Now baseline measurements can be done and compared with post-implementation data to reveal the actual impact. This approach can easily be misused if proper baseline audits were not performed. If baseline audits are not possible, historical data for three months to a year is needed before any ECM implementation is required for suitable M&V. This historical data can be obtained from utility point-of-use profile power metering. From this data, the baseline conditions can be verified. Smaller utility points are, however, not always equipped with profile power meters, but rather with cumulative energy consumption disc meters in kWh. In these situations, additional baseline metering may be required.
5.3 Assessment where other ECMs were also implemented
In the case where other ECMs were implemented with the VSD, a similar approach to that described in Section 5.2 can be followed to accurately isolate and quantify the impact of the VSD. Other ECMs may include an EE pump motor or pipeline efficiency improvements. Comparing the results from proper baseline measurements with the post-implementation results gives the demand reduction due to the VSD and other ECMs. Repeating the method of Section 5.2 and comparing these results with the post-implementation results produces only the impact of the VSD, however. This essentially isolates the VSD impact and excludes the efficiency contribution of other ECMs. With some ECMs, like pipeline efficiency, the exact baseline conditions may not be achieved by applying Section 5.2's method. The pipeline efficiency may result in a lower operational demand with the same baseline valve positions and operational pressure. With both Sections 5.2 and 5.3, it should be noted that M&V is not an exact science and the aim is to quantify representative and conservative savings as prescribed by the IPMVP and SANS 50010:2018.
6. Case studies of actual attainable impact
Case studies were done on 19 VSDs installed on five farms in different areas and provinces. The aim was to quantify the actual attainable demand impacts through metering. The measurement procedures of Section 5, with other newly developed methods, were carried out at several sites to assess and verify demand impacts. Figure 3 shows some of the pump stations assessed during the case study. The line designated 'before' in Figure 4 shows the baseline profile and 'after' the post-implementation profile, where a significant demand reduction can be observed.
6.1 Operational power demand reduction results from case studies
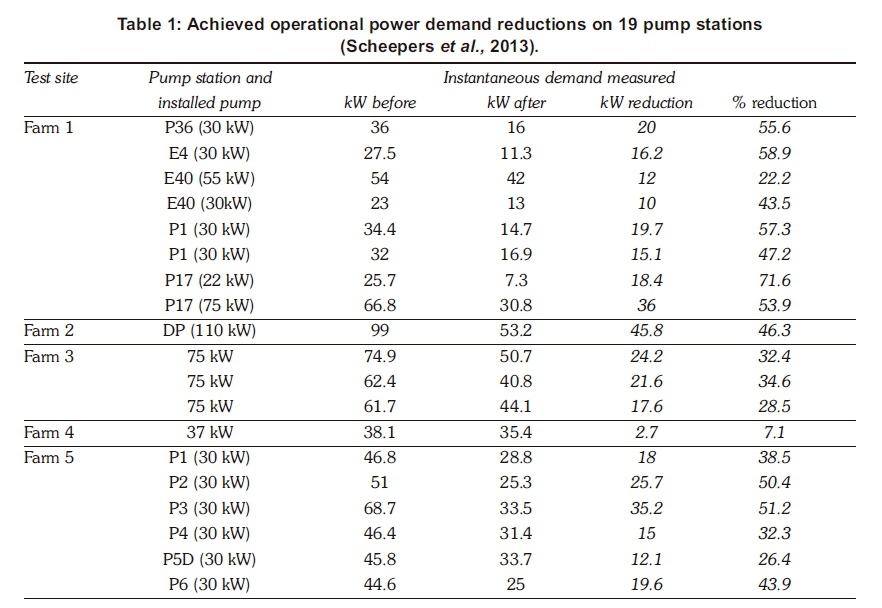
An overall representative electrical demand reduction for the irrigation pump can be calculated from the profile measurements described in Section 5. This was done to portray a single figure of the attainable demand reduction impact of the 19 case study pumps. The profile measurement method of Section 5 was, however, too costly and impractical to use for all of the case study pumps and an alternative measurement technique was required to obtain demand reduction values for some of them. Section 7.1 describes a simple method that was designed for the irrigation SPP to establish a representative but conservative load reduction value. This technique was used to establish the instantaneous demand values given in Table 1, which summarises the pre- and post-implementation demand measured at each case study site, with the actual demand reduction.
The first column in Table 1 (overleaf) lists the test site, while the second gives the pump station name and the installed capacities of the irrigation pump motors. The next two columns show the before and after ECM instantaneous kW, while the kW and percentage demand reduction are given in the last two columns. The lowest demand reduction, 7.1%, was experienced at Farm 4 and the highest, 71.6%, at pump station P17 on Farm 1. The demand reductions measured were not related to the time of day they occurred (such as during peak periods), as the focus was solely on the attainable demand reduction. Taking all 19 sites into account, the average demand reduction achieved was 42.2%. For all measurements, the pre- and post-implementation conditions were kept the same. This is clear evidence of a definite and significant demand reduction. With project circumstances considered, it can be safely concluded that the implementation of a VSD to optimise the irrigation system can lead to real, tangible and significant demand reductions. The achieved demand reductions will directly result in energy consumption saving and, in most cases, water saving as well, as a result of water usage optimisation.
An important aspect that can be addressed in future studies, however, is to establish a method that can also determine the time of day when demand reduction occurs. This would be valuable, as the contribution the SPP irrigation ECMs demand reduction makes over the Eskom peak usage periods could also be determined.
6.2 Further assessments
The 19 pump stations were not the only pumps engaged by the energy advisors, although these were the only ones independently verified. A total of 46 farms and farm sections formed part of a large testing study over South Africa. With collaboration between M&V and the energy advisors a standard site M&V evaluation criterion, as for the 19 pump stations, was agreed upon to be used for all other farm pump stations. Very similar demand reductions to those found for the 19 pump stations were obtained (Storm et al., 2008).
The savings presented in Table 1, and those of the other 37 pump stations, can only be used as a guide on what can possibly be achieved and not as a national or area-specific representation. The pump stations used did not undergo proper statistical sampling (Carstens et al., 2014; IPMVP Committee, 2012; Xia and Zhang, 2013; UNFCC CDM Executive Board, 2012) and were assessed as projects were implemented and evaluation sites became available. For a national or area-specific representation a thorough statistical model needs to be developed, one which considers all factors and variables. Therefore, no area representative confidence level and error margin can be tied to the findings.
In order to establish a national or area-specific representation, a proper M&V cost and accuracy model can guide decisions on how to approach this. Unfortunately, with accuracy the associated M&V cost rises significantly. With the healthy M&V practice of always reporting on conservative savings, incentive programmes can compare M&V accuracy and cost with the additional incentives that can be claimed. As with the M&V of normal irrigation projects, in some cases, even a 50% confidence level may be acceptable, depending on the overall reporting objectives and the value of the savings involved, according to Steyn (2014). Here the claimed savings will inevitably only be a conservative 50% of what was measured. Although it may not appear ideal, this approach may provide sufficient M&V for publicly funded incentive programmes, but simultaneously enable projects which may not have been possible before due to high M&V costs. Here the M&V methods described in the present study are ideal. A critical aspect of M&V that requires more attention, on any type of ECM programme, is metering and data-gathering equipment. In many cases, the costs of these are so high that it is often more than the rebate from the incentive programme. An accurate but cost-effective data-gathering system and approach is required for such projects.
7. Design of a SPP measurement methodology
Section 5 described the design of measurement procedures to quantify the actual measured impacts of SPP irrigation ECMs. In Section 6 these procedures were applied to case studies, where the focus was to assess and quantify the real world impacts resulting from the installation of VSDs on irrigation pumps. Here, measurement practices related to conventional M&V methods were applied. However, the SPP cannot financially justify such extensive measurements on all projects and a simplified standardised assessment method is required to establish attainable demand, and therefore energy consumption, reduction.
7.1 Establishing a simplified assessment method for demand reduction
A method needed to be established for the SPP to measure a conservative, but representative load reduction, without profile measurement. With centre pivots, a conservative approach is to let the centre pivot turn till it reaches the lowest elevation point on the crop circle (Steyn et al., 2013), which requires measurements of a baseline instantaneous demand. This lowest point is the location where the irrigation pump demand is the lowest since the static head is effectively the lowest. These measurements are repeated after the ECM implementation and the results can be compared for the demand reduction. The impact calculated becomes the lowest possible saving that is still attainable. With centre pivots on severely angled crop circles, multiple measurement points may be considered. Crops under micro or sprinkler irrigation have a constant static head and instantaneous measurements can be taken any time after the system stabilised after pump start-up. Irrigation pumps that irrigate multiple crops, as in Figure 4, require a separate assessment for each crop type. A load reduction for each crop is determined.
7.2 Assessment method for annual average demand and energy consumption reduction
Determining the annual energy reduction under the SPP is a difficult study, since the SPP does not allow continuous measurements and the energy consumption saving needs to be determined for a specific crop in a specific area. Without continuous measurement, several other aspects may need to be considered when determining the energy and average demand reduction. These aspects can include:
-
location, climatic region and typical annual rainfall;
-
crop types: irrigation of summer and/or winter crops, more than one type of crop during a single season;
-
irrigation methods and soil type; and
-
is water allocation/registration active in the area?
The best approach found was to incorporate crop load factors (Scheepers et al. , 2013), through which representative irrigation requirements for a crop were established. Crop water requirement is one of the most important aspects to consider for irrigation efficiency since it is a vital part of agricultural planning (Reddy, 2015). Allen et al. (1998) define crop water requirement as: 'the depth of water needed to meet the water loss through evap-otranspiration (ETCrop) of a disease-free crop, growing in large fields under non-restricting soil conditions, including soil water and fertility, and achieving full potential under the given growing environment'.
Crop water requirement is a well-studied field and software programmes are available to assist farmers in determining it. An example of this is CROPWAT (Banik et al, 2014) and the South African SAPWAT (Heerden et al., 2016), which is based on (Allen et al., 1998) using the CLIMWAT (Tegos et al., 2017) weather database comprising of 3262 weather stations from 144 countries. For the SPP the software program SAPWAT was utilised; among many other aspects, it incorporates 50 years of weather data to calculate a load factor for a specific area and crop type.
From the crop load factor, irrigation system setup and ECM load reduction, the annual energy consumption saving with the annual average demand reduction can be estimated. This can be strategically broadened to an irrigation pump, feeding multiple crop areas and having more than one crop type per centre pivot. However, independent M&V assessment of these crop factors was critical to prevent biased or unrepresentative values. A whole alternative method was developed and a study performed to independently evaluate and verify crop load factors calculated for certain areas (Storm et al., 2013). This study involved determining the real-world crop load factors of hundreds of irrigation pumps stations over a four-year period. This massive undertaking is beyond the scope of the present study, but the results showed that the calculated crop load factors were indeed representative and conservative.
8. Validation of methodology through actual electrical grid impacts
A critical question: what is the actual reduction the electricity grid experiences due to these ECMs? Although ECMs will result in probable short-to-medium term (one to three years) representative reductions, the question is how these impacts will be sustained over longer periods. Also, from other types of EE projects evaluated, it emerged that sometimes re-appropriation effects diminished the real attained savings. An example of this is Eskom residential EE projects and CDM projects (Pandaram, 2006; UNFCCC CDM Executive Board, 2010). Once a homeowner realised that ECMs such as a SWH, geyser switch, geyser blanket or EE lighting reduce the electricity bill, the tendency is often to use more electricity on other household appliances, making up the original electricity cost budget, thus, effectively cancelling any attained savings - though with lifestyle improvements.
Normal M&V models do not actively capture this effect since the measurement boundary is only around the equipment part of the project scope and only direct interactive effects with other technologies are monitored. Here, CDM methodologies have additional methods and calculations to account for re-appropriation effects such as leaking and free riding (United Nations Framework Convention on Climate Change Clean Development Mechanism Executive Board, 2010).
It is imperative that programmes such as the SPP must have regulation to avoid re-appropriation effects. Old, ineffective equipment must be collected and destroyed or they will only be used at another place.
A method is required to quantify what the actual impact of ECMs is on the electrical grid. In 2006, there was a massive implementation of accelerated DSM initiatives in the Western Cape province because of a 400 MW supply shortfall (Storm et al., 2009). A top-down M&V methodology was developed and successfully executed to assess the regional demand impact as seen on the electrical grid. Data was gathered from strategic measurement points on regional transmission and distribution power supply lines. The M&V methodology accounted for the following key aspects:
-
average day type demand profiles with temperature adjustments;
-
electricity sales growth and demand market participation;
-
supply losses, municipality curtailment and load shedding; and
-
leased generation, fuel switching, power export and open point shifts in electrical distribution networks.
Strategic measurements were made on the electrical network to isolate key areas effected by ECMs. Measurement data was collected from existing power utility grid meters. Care was taken, since electrical network configuration can chance through shifted open points, which in turn may affect measurement data at certain places (Dalgleish, 2009). A similar approach can be applied to isolate and assess the impacts of regional irrigation ECMs. Through the distribution networks, key high voltage lines than mainly feed irrigation areas or regions can be identified. Power lines which may tap off and feed industries or towns can also be measured so that these can be subtracted from the totals. The model can be refined through moving down to low voltage customer billing utility meters to remove a farm's loads that are not used for irrigation. This is limited to points with utility profile metering. Data extraction can be done in cooperation with utility grid control centres. From historic data, periodic baselines (monthly for instance) can be developed and baseline adjustments fixed.
9. Conclusions
Eskom's Standard Product Programme (SPP) has unique M&V requirements, which make normal M&V approaches inapplicable. The biggest challenge is the absence of continuous metering while still requiring representative and accurate results. A new and unique M&V methodology was designed to quantify energy conservation method impacts under the SPP and other similar incentive-based programmes. This new methodology was used on several pilot sites and proved to be functional, giving the required operation electrical demand reduction values required. These values provided clear evidence that the implementation and use of a variable speed drive to optimise the irrigation system can lead to real, tangible and significant demand reductions. By incorporating crop load factors with the demand reduction values established, representative annual energy consumption and annual average demand reduction impacts were also successfully established. These impacts were validated and verified through an independent cross-check measure which showed that the values obtained were indeed representative and conservative.
References
Allen, R. G., Pereira, L. S., Raes, D. and Smith, M. 1998. Crop evapotranspiration: Guidelines for computing crop water requirements. Food and Agriculture Organization of the United Nations. https://doi.org/10.1016/j.eja.2010.12.001 [ Links ]
Banik, P and Ranjan, S. 2014. CROPWAT Crop water assessment of plain and hilly region using CROP-WAT model. International Journal of Sustainable Materials, Processes & ECO-Efficient 1(3), 1-9. Journal code: IJSMPE [ Links ]
Carstens, C., Xia, X. and Xianming, Y. 2014. Improvements to longitudinal Clean Development Mechanism sampling designs for lighting retrofit projects. Applied Energy, 126:256-265. https://doi.org/10.1016/j.apenergy.2014.03.049 [ Links ]
Coetzee, C. Van der Merwe C.A. and Grobler L.J. 2012. Basic measurement and verification approach for roll-out programmes. Industrial and Commercial Use of Energy conference Proceedings. Online: http://iee-explore.ieee.org/document/6330165/?reload=true. Accessed: August 2018. [ Links ]
Dalgleish, A.Z. 2009. The development, implementation and performance evaluation of an innovative residential load management system. PhD thesis, NorthWest University, Potchefstroom, South Africa. [ Links ]
Dazé, A., Price-Kelly, H. and Rass, N. 2016. NAP Global Network; Vertical integration in national adaptation plan processes. Online: http://napglobalnetwork.org/wp-content/uploads/2016/11/Vertical-Integration-in-NAP-Processes-Guidance-Note.pdf. Accessed: August 2018. [ Links ]
Den Heijer, W. 2010. The measurement and verification guideline for energy efficiency and demand-side management (EEDSM) projects and programmes v10. Online: www.eskom.co.za/idm. Accessed: May 2014. [ Links ]
Department of National Treasury, Republic of South Africa. 2015. Draft carbon tax bill. Online: http://www.treasury.gov.za/public%20comments/CarbonTaxBill2015/Carbon%20Tax %20Bill%20final%20for%20release%20for%20comment.pdf Accessed: August 2018. [ Links ]
Du Plessis, M. 2009. Agriculture: Facts and trends South Africa. Online: http://awsassets.wwf.org.za/downloads/facts_brochure_mockup_04_b.pdf. World Wide Fund for Nature - South Africa. Accessed: August 2018. [ Links ]
DWS [Department of Water and Sanitation]. 2013. Annual strategic overview of the water sector in South Africa. http://nepadwatercoe.org/wp-contenl/uploads/Strategic-Overview-of-the-Water-Sector-in-South-Africa-2013.pdf. Accessed: August 2018. [ Links ]
DWS [Department of Water and Sanitation]. 2015. Annual strategic overview of the water sector in South Africa. http://www.dwaf.gov.za/Downloads/WS/Macro_Planning_Products/STRATEGIC %20OVERVIEW%20OF%20WATER%20SERVICES/. Accessed: August 2018. [ Links ]
Eskom. 2016. Eskom integrated results presentation for the six months ended 31 March 2016. Online: http://www.eskom.co.za/OurCompany/Investors/Integ ratedReports/Pages/Annual_Statements.aspx. Accessed: August 2018. [ Links ]
Eskom Integrated Demand Management. http://www.eskom.co.za/idm. Accessed: August 2018 [ Links ]
Heerden, P. and Walker, S. 2016. Tool to estimate the irrigation water use of crops: revised edition - SAP-WAT 4. Water Research Commission Report, TT 662/16, CAB Abstracts, EBSCOhost. Accessed: March 2018. [ Links ]
Hibberd, A. 2011. University of Cape Town measurement and verification team. Standard Offer pilot program measurement and verification guideline. Online: http://www.eskom.co.za/IDM/MeasurementVerification/Pages/MV_Documents.aspx. Accessed Sept 2017. [ Links ]
Hodges, A.W., Lynne, G.D., Rahmani, M. and Casey, C.F 1994. Adoption of energy and water-conserving irrigation technologies in Florida. Fact Sheet EES 103, Florida Cooperative Extension Service, Institute of Food and Agricultural Sciences, University of Florida. [ Links ]
IPMVP [International Performance Measurement and Verification Protocol]. 2012. International performance measurement and verification protocol. Concepts and options for determining energy and water savings, Volume 1. Online:http://www.eeper-formance.org/uploads/8/6/5/0/8650231/ipmvp_vol-ume_i__2012.pdf. Accessed: September 2017. [ Links ]
Lal, R. 2004. Carbon emission from farm operations. Environment International, 30(7):981-990. https://doi.org/10.1016/j.envint.2004.03.005 [ Links ]
Malana, N.M. and Malano, H.M. 2006. Benchmarking productive efficiency of selected wheat areas in Pakistan and India using data envelopment analysis. Irrigation and Drainage, 55(4):383-394. https://doi.org/10.1002/ird.264 [ Links ]
Molden, D. 2007. Water for food, water for life: A comprehensive assessment of water management in agriculture. London, United Kingdom and Washington D.C, United States: Earthscan. Online: http://www.iwmi.cgiar.org/assessment/files_new/syn-thesis/Summary_SynthesisBook.pdf. Accessed: September 2017. [ Links ]
Morris, M. and Lynne, V. 2006. Energy saving tips for irrigators. Online: http://www.farmsreach.com/welcome/wp-content/uploads/2013/06/EnergySavingTipsforIrrigators.pdf Accessed: September 2017 [ Links ]
Naylor, R.L. 1996. Energy and resource constraints on intensive agricultural production. Annual Review of Energy and the Environment, 21(1):99-123. https://doi.org/10.1146/annurev.energy.21.1.99 [ Links ]
Pandaram, R.S. 2006. Residential load management in South Africa: Challenges and solutions. Domestic Use of Energy conference proceedings. Online: https://drive.google.com/ drive/ folders/0B6M3SFQa2 Dy_ZzE2YThuSFRaU1E Accessed: February 2015. [ Links ]
Reddy, K. C. 2015. Development of crop coefficient models of castor and maize crops. European Journal of Agronomy, 69, 59-62. https://doi.org/10.1016/j.eja.2015.06.003 [ Links ]
Rodríguez Díaz, J.A., Camacho Poyato, E. and López Luque, R. 2004. Application of data envelopment analysis to studies of irrigation efficiency in Andalusia. Journal of Irrigation and Drainage Engineering, 130(3):175-183. https://doi.org/10.1061/(ASCE)0733-9437(2004)130:3(175) [ Links ]
Scheepers, W.H., Gordijn, R., Rossouw, P., Bezuidenhout, N. and Horlock, K. 2013. Eskom Integrated Demand Management energy advisor team. South Africa. [ Links ]
Singh, H., Mishra, D. and Nahar, N.M. 2002. Energy use pattern in production agriculture of a typical village in arid zone, India--Part I. Energy Conversion and Management, 43(16):2275-2286. https://doi.org/10.1016/S0196-8904(01)00161-3 [ Links ]
South Africa Government Gazette. 2013. Regulations in terms of section 12L of the income tax act, 1962, on the allowance for energy efficiency savings. (Notice 971). Government Gazette, 37136:3, 9 December. [ Links ]
South African Bureau of Standards (SABS): South African National Standard (SANS). 2011. Measurement and verification of energy savings. SANS 50010:2011, Edition 1, ISBN 978-0-62626352-2. [ Links ]
Steyn, F. and Rogers, C. 2013. ABB irrigation efficiency team, active research and development on variable speed drive application on irrigation systems. Personal communication. [ Links ]
Steyn, K. 2014. Eskom senior consultant: Energy performance verification. Personal communication. [ Links ]
Storm, M.E., Dalgleish, A.Z. and Grobler, L.J. 2007. Methodology developed to M&V the total impact of the accelerated demand-side management initiative implemented in the Western Cape. Industrial and Commercial Use of Energy conference proceedings, Cape Town. ISBN 0-9584901-7-1. Online: https://drive.google.com/ drive/ folders/0B6M3SFQa2 Dy_WFBOeDRXOFNHb2c Accessed: July 2017. [ Links ]
Storm, M.E., Gouws, R. and Grobler, L.J. 2016. Measurement and verification of irrigation pumping DSM projects: Application of novel methodology designs. Journal of Energy in Southern Africa, 27(4):15-24. https://doi.org/10.17159/2413-3051/2016/v27i4a1647 [ Links ]
Storm, M.E. 2013. Measurement and verification on irrigation Standard Product Programme with load factors. South Africa Energy Efficiency Conference proceedings. Nov 2013. ISBN: 978-0-620-58204-9. [ Links ]
Storm, ME. 2014. Eskom Standard Product Programme supplementary measurement and verification guideline, North-West University. Document available on request. [ Links ]
Storm, M.E., Van der Merwe, C.A. and Grobler, L.J. 2008. M&V of an irrigation pumping project: Case study. Industrial and Commercial Use of Energy Conference Proceedings, Cape Town: 249-254. [ Links ]
Tegos, A., Malamos, N., Efstratiadis, A., Tsoukalas, I., Karanasios, A. and Koutsoyiannis, D. 2017. Parametric modelling of potential evapotranspira-tion: A global survey. Water Switzerland, 9(10). https://doi.org/10.3390/w9100795 [ Links ]
Tyler, E., Du Toit, M. and Burchell, Z. 2011. White certificates and white certificate trading schemes as greenhouse gas mitigation policy options for South Africa. Journal of Energy in Southern Africa, 22(1):18-25. [ Links ]
United Nations Framework Convention on Climate Change Clean Development Mechanism Executive Board. 2010. Indicative simplified baseline and monitoring methodologies for selected small-scale CDM project activity categories, Version 08. Online: https://cdm.unfccc.int/EB/023/ eb23_repan33.pdf. Accessed: September 2017. [ Links ]
United Nations Framework Convention on Climate Change Clean Development Mechanism Executive Board. 2012. Guidelines for sampling and surveys for Clean Development Mechanism projects activities and programme of activities, Version 02.0. Online: https://cdm.unfccc.int/Reference/Guidclarif/meth/met h_guid48.pdf. Accessed: September 2017. [ Links ]
Van der Merwe, C. 2011. The measurement and verification guideline for the standard product programme. Online: http://www.eskom.co.za/IDM/MeasurementVerification/Documents/NWU _M_and_V_Guideline_-_IDM_SP_Programme_v2r2.pdf. Accessed: September 2017. [ Links ]
Winkler, H. and Van Es, D. 2007. Energy efficiency and the Clean Development Mechanism in South Africa: constraints and opportunities. Journal of Energy in Southern Africa, 18(1):29-38. [ Links ]
Xia, X. and Zhang, J. 2013. Mathematical description for the measurement and verification of energy efficiency improvement. Applied Energy, 111:247-256. https://doi.org/10.1016/j.apenergy.2013.04.063 [ Links ]
* Corresponding author: Tel: +27 83 269 7298; email: markuss.mnv@gmail.com

