


Servicios Personalizados
Articulo
 Inglés (pdf)
 Articulo en XML
 Referencias del artículo
Indicadores

Links relacionados
-
 Citado por Google
 -
 Similares en Google
Compartir

 Permalink
Journal of Energy in Southern Africa
versión On-line ISSN 2413-3051
versión impresa ISSN 1021-447X
J. energy South. Afr. vol.29 no.2 Cape Town may. 2018
http://dx.doi.org/10.17159/2413-3051/2017/v29i2a3376
ARTICLE
Comparison of satellite-retrieved high-resolution solar radiation datasets for South Africa
Ana Gracia AmilloI; Lucky NtsangwaneII, *; Thomas HuldI; Jörg TrentmannIII
IEuropean Commission, Joint Research Centre, Institute for Energy and Transport. Renewables and Energy Efficiency, TP 450, 21027 Ispra (VA) Italy
IISouth African Weather Service, 01 Eco park Drive, Eco glades Block B, Cnr Olievenhoutbosch and Ribbon Grass Street, Centurion, Pretoria, South Africa
IIIDeutscher Wetterdienst, 135 Frankfurter Strase, 63067, Offenbach, Germany
ABSTRACT
This study compares the performance of two satellite-based solar radiation methodologies for estimating the solar resource available in South Africa. Data from thirteen stations distributed in six climatic regions were considered. More than one year of hourly values of global horizontal and beam normal irradiance were examined in the validation of the satellite-retrieved estimates at every location. The best satellite method resulted in an overall relative mean bias of 1.41 % for the global horizontal irradi-ance corresponding to almost 3 Wm-2 and exhibited a relative mean bias of 2.85% for the beam normal irradiance estimation (about 7 Wm-2). This satellite-based method was implemented into a geographical information system module, which contained high-resolution terrain data and allowed the effect of the surrounding topography on the estimation of the available solar resource to be considered. These estimates can, therefore, be used as input data for further analysis or applications. As an example, maps of the potential output that could be expected in South Africa from photovoltaic systems were created.
Keywords: satellite retrieved irradiance, global horizontal irradiance, beam normal irradiance, ground stations
1. Introduction
The share of renewable energy systems on the electricity market is steadily increasing, mainly from wind farms and photovoltaic (PV) solar systems [1]. Initially, the transition from conventional power plants to those fuelled by renewable energy sources was led mainly by European countries. However, at present, most of the global market is concentrated in countries like China and India, whose energy policies boosted the installation of power plants of renewable energy sources, where solar PV plays a very important role [2]. A significant case of strong government policy support is South Africa, where the biggest change in terms of investment was recorded, with an increase of 329% from 2014 to 2015, when the installed capacity reached 1.12GW. Through policies like the National Energy Act and the Renewable Energy Independent Power Producer Procurement Programme, South Africa is dedicating a large amount of funding to create a whole network, from manufacturers of modules to other components, like inverters [1].
Strategies to install new PV power plants must be supported by an accurate knowledge of the resource available. Ground measurements are the first choice to describe the irradiance levels at a certain location, providing high quality data, depending on adequate maintenance of the instruments used in the measuring campaign [3]. When no on-site measurements are available, other techniques should be applied, such as empirical models based on meteorological variables like temperature or sunshine duration [3, 4] or models based on reanalysis and retrospective weather prediction models [5, 6]. Satellite-based models have become a very powerful tool for estimating the solar resource at high and uniform spatial resolution (typically a few kilometres) and temporal resolution (hourly or better) over large geographical areas [3, 7]. Satellite-based estimates have been validated in the scientific literature [8-12]. The European Organisation for the Exploitation of Meteorological Satellites' Climate Monitoring Satellite Application Facility (CMSAF) provides continuous solar radiation data from the Meteosat First and Second Generation (MFG, MSG respectively) geostationary satellites from 1983 to present. In this study two freely available datasets from the CMSAF consortium have been used to estimate the solar resource available in South Africa, and produce high-resolution maps of this resource.
The paper is organised as follows: Section 2 describes the satellite-based solar radiation data and the ground station measurements used for the validation of the satellite data. Section 3 presents the methods used for the validation, as well as for the construction of the high-resolution solar radiation dataset. Section 4 contains the results of the validation and illustrates the results of the high spatial resolution dataset. Conclusions are given in Section 5.
2. Solar radiation data from satellite and ground stations
2.1 Satellite-based solar radiation data
The two solar radiation products investigated here are produced by the CMSAF collaboration of European meteorological services and will be described in the following.
2.1.1 Surface Solar Radiation Dataset - Heliosat
The Surface Solar Radiation Dataset - Heliosat (SARAH) [13] is part of the climate data records produced by CMSAF, where the objective is to produce a temporally homogeneous data record for long time periods suitable for climate analysis, i.e. assessment of anomalies and trends. The SARAH data records are derived using data from the Meteosat Visible Infra-Red Imager instruments of the MFG satellites (Meteosat 2-7) up to the end of 2005, and from the Spinning Enhanced Visible and Infra-Red Imager (SEVIRI) instruments on the MSG (Meteosat 8-10) satellites after then. SARAH provides data for the global (GHI) and direct (beam) horizontal (BHI) irradiance at the earth surface from 1983 to 2015 at high temporal (down to 30 minutes, but also daily and monthly averages) and spatial (0.05°x0.05°) resolutions.
Surface solar radiation is obtained using a modified Heliosat method to calculate the effective cloud albedo (CAL), and the SPECMAGIC clear-sky model [14], which is an extension to spectral bands of the MAGIC model (Mesoscale Atmospheric Irradiance Code) [9]. The SPECMAGIC uses monthly average values of atmospheric water vapour content from the European Centre for Medium-Range Weather Forecasts ERA-interim product and long-term monthly climatologies of aerosol optical depth based on monitoring atmospheric composition and climate [15, 16].
Validation of SARAH, using high-quality ground stations from international networks (e.g., Baseline Surface Radiation Network, BSRN, http://bsrn.awi.de) as well as from national networks, has been reported in a number of publications [13, 17-19].
At present the SARAH dataset provided by CMSAF exists in two versions. The dataset used in the present work is based on version 1 of SARAH, with one difference: the hourly data used here are calculated from one satellite image per hour. In contrast, the SARAH version 1 data available from CMSAF use a weighted average of three half-hourly satellite images to calculate the hourly solar radiation values.
2.1.2. Climate Monitoring Satellite Application Facility Operational dataset
Unlike the SARAH long-term data record, the CMSAF Operational product of surface irradiance is generated continuously, with a temporal delay of about ten days. This product uses the satellite information provided by the Operational SEVIRI instrument onboard the Meteosat 8-10 satellites situated at 0° longitude. The retrieval algorithm is based on a look-up-table approach [9]. The multi-spectral information from the SEVIRI instrument is used to determine the cloud mask. For cloud-free conditions the MAGIC clear-sky surface irradiance algorithm is used to calculate the surface irradiance [9]. Under cloudy conditions the measured reflected solar irra-diance is related to the atmospheric optical depth, based on a precalculated look-up table using additional boundary conditions, e.g. the surface albedo. In the present study, the instantaneous hourly data of surface irradiance were used. The CMSAF Operational product of global radiation has also been extensively validated [8, 9, 20-22]. As for the SARAH dataset, the CMSAF Operational product delivers GHI as well as DHI estimates.
2.2 Ground-measured data
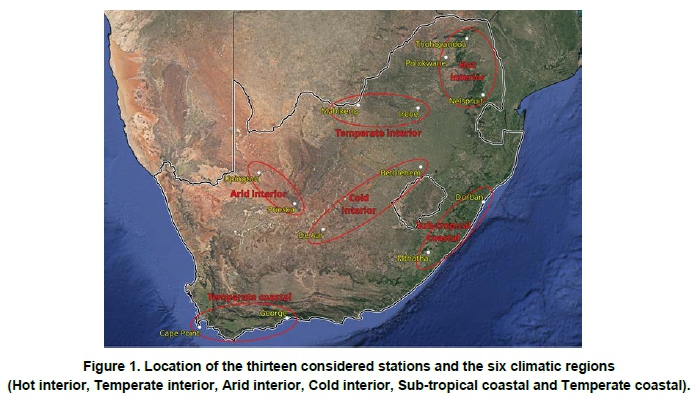
The accuracy of the satellite-retrieved solar radiation data, described in Section 2.1, was assessed by comparing the said datasets with ground measurements registered at thirteen stations in South Africa owned and maintained by the South African Weather Service. They are evenly distributed in six different climatic regions [23] over an area bounded by latitudes 23° to 34° south and longitudes 18° to 31° east. The elevation of the stations ranges from 80 m to almost 1700 m, as described in Table 1.
Most stations were installed during 2014, although five started registering measurements only in the first quarter of 2015. The present study used data recorded up to April 2016, except for Prieska, where the last available ground measurement is from September 2015. Therefore, the length of the time series depends on the location, ranging from the 27 months in Upington to the 14 months of Po-lokwane. One year of recordings is, nonetheless, always considered at every station in order to guarantee analysing a representative dataset for every location and climate.
The geographical distribution of the stations and the different climatic regions [23] in which they are located are shown in Figure 1. Depending on the climatic region, the average length of the considered time series of the stations ranges from 17 to 24 months, thus allowing a representative sample of measurements to be taken in each region.
The solar radiation stations share the following configuration: a SOLYS 2 sun tracker with shading ball assembly and one first class ISO-9060 classified CHP1 pyrheliometer (Kipp & Zonen) for measuring the beam normal irradiance (DNI). All stations, except De Aar which is part of the BSRN network, are equipped with two high performance pyranometers CMP11 (Kipp & Zonen) for registering the global and the diffuse horizontal irradiances. The CMP11 pyranometer is fully compliant with all ISO 9060:1990 secondary standard instrument performance criteria. De Aar, being a BSRN station, employs two ventilated CMP21 pyranometers by Kipp & Zonen, which are rated in the highest possible ISO pyranometer performance category. The ventilation units keep the pyranometer's domes clean from frost and water. All stations are equipped with an automatic weather station that registers basic weather parameters. Periodical maintenance procedures are applied to the various instruments in order to satisfy the BSRN quality requirements.
The measured database contains one-minute values of global and diffuse irradiance on the horizontal plane, and beam normal irradiance.
3. Methods for validating and constructing the solar radiation atlas
3.1. Validation of the satellite-based solar radiation
3.1.1 Measured irradiance values used in the validation
The measured dataset has recordings every minute, while the satellite-based datasets contain one value of GHI and DNI per hour, corresponding to the single image analysed every hour. This difference in the time stamp made it necessary to modify the measured dataset before it could be compared to the calculated ones.
In order to assess the quality of the satellite-based models, the hourly satellite-retrieved estimates were compared to the measured data closest to the time of the satellite image. A ten-minute window centred at the time of the image was defined for every piece of satellite-derived data. Taking into account the area covered by one pixel of the satellite image, the measurements taken during this interval would register the possible varying irradiance levels, derived from breaking clouds going through the area covered by the pixel, considered in the satellite-based estimate for that area. The measured data registered during this interval were averaged to obtain the final 'measured' value used in the validation process. This averaging approach was considered more accurate than using the single-minute measured data point at the time of the satellite image, especially for overcast sky conditions.
The ten-minute interval, and therefore the measured data used in the validation of each satellite product, is different since Operational and SARAH datasets derive from different images. As a result, the number of data points considered in the validation of both satellite datasets may be different. Also, the number of data points used for the validation of the global horizontal and beam normal irradiance values may also be different, as there may be moments when one variable is available while the other is not. This would be the case of moments when the sun-tracking system (where the pyrheliometer and the pyra-nometers are located) is not working properly. This would result in incorrect beam irradiance measurements, even though the global irradiance measurements would still be valid.
In addition to the quality control process applied to the data at the measuring station, before doing the present analysis a simple filtering procedure was applied to the minute values:
-
negative irradiance values at night time were replaced by 0 Wm-2 and kept for the validation, while negative values during day time were removed;
-
irradiance values higher than 1300 Wm-2 were removed; and
-
the coherence between the three irradiance values was checked to remove measurements suspected to be derived from moments when the sun-tracking system was not working properly.
If fewer than five valid minute data points remained after applying these filters, the ten-minute window was removed entirely and the corresponding satellite data for that hour was dismissed. If there were enough valid minute data, the average value was calculated and kept as the 'measured' value to be used for validating the satellite-derived values. This procedure is applied independently to obtain the four measured datasets used to validate the GHI and DNI irradiance values from the Operational and the SARAH datasets independently. Thus the measured values used in the validation were in fact an average value obtained from the real one-minute measured datasets.
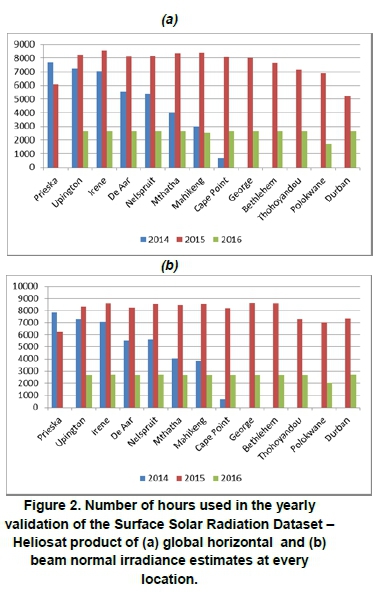
The final number of hourly data used at every station depends on the satellite product considered and the variable studied. In general, during 2014 and 2015, the validation of the SARAH dataset had more valid hours. However, because of missing data during the first days of 2016, the Operational product has more data points in 2016. For example, Mahikeng station had some problems with the sun-tracker during 2014, which reduced by nearly 22% the number of valid hours for the DNI validation in comparison to those used for the GHI comparison. Figure 2 contains the number of points used in the validation of the SARAH product per year at every location. Figure 2a shows the GHI validation, while Figure 2b contains the number of points used in comparing DNI estimates and measured values.
3.1.2 Validation metrics
Satellite retrieved and measured irradiance values of GHI and DNI were compared at the different stations for every year and month independently. The mean bias difference (MBD), the root mean square difference ( RMSD), and mean absolute difference (MAD) in absolute (Wm-2) and relative (%) values (rMBD, rRMSD and rMAD) were calculated according to Equations 1 to 6 [3, 7, 24]. In addition to these, the R2 correlation coefficient was also calculated using Equation 7 [7, 24].
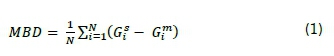
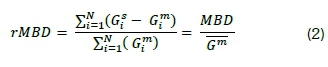
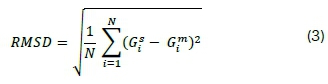
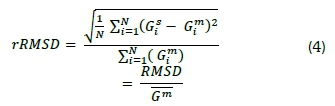
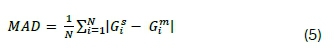
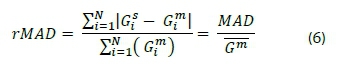
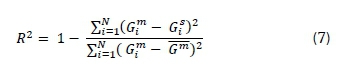
Where  is the satellite retrieved irradiance value at the ith time point and
  is the measured irradiance value for that timestamp, N is the total number of points considered in the period of time analysed, year or month, and
  is the average measured ir-radiance value during the considered time period.
3.2. Construction of the solar radiation atlas
The present study developed a solar atlas for South Africa using satellite-based solar radiation estimates. Using the solar atlas as input data, it is possible to estimate the solar resource in the country for other planes than the horizontal, and at the same time, by means of other models, obtain estimates of other variables, such as the performance of different photovoltaic technologies. Some of these estimation models have been implemented in PVMAPS, a free software developed in the Joint Research Centre of the European Commission [25]. In this section we will briefly recapitulate the methods used in PVMAPS and describe the datasets available in the South African solar radiation atlas.
3.2.1 Calculation of solar radiation on tilted and sun-tracking surfaces
To estimate the performance of PV systems and concentrated solar power plants, it is necessary to know the solar irradiance on tilted surfaces for any given time. This is normally calculated using GHI as input values. The algorithms used for this are presented by Súri and Hofierka [26], using the inclined-plane model of Muneer [27]. A number of related tools were released as part of PVMAPS [25], allowing calculate the in-plane irradiance on tracking surfaces [28, 29] as well as the annual optimum angle for maximum irradiation on fixed planes [30].
3.2.2 Modification of solar irradiation due to terrain shadows
If the sun moves behind nearby hills or mountains, the solar irradiance is drastically changed. The satellite-derived solar radiation data has a resolution that is too coarse to take this effect into account. However, for the solar radiation atlas, digital elevation data from the Shuttle Radar Topography Mission [31], which provides elevation data with a spatial resolution of three arc-seconds, was used to calculate the horizon height for 48 directions around each location. Using the r.horizon [32] module from GRASS GIS, the calculation of irradiance was then modified by removing the direct solar component when the sun was behind hills or mountains at a given point.
3.2.3 Photovoltaic system performance estimates
The output power of PV modules depends not only on the in-plane irradiance but also on a number of other influences, such as:
-
the temperature of the module which, in most cases results in a decreased conversion efficiency as the temperature increases [33]. For the calculations of PV energy output reported in the present study, the model developed by Huld et al [34] was applied using the coefficients for crystalline silicon modules. Module temperature in turn depends on the temperature of the surrounding air, the in-plane irradiance, and on the effect of wind cooling the modules [35]; and
-
the spectrum of the incoming light, which causes changes in the conversion efficiency [33, 36].
These effects were implemented in the PVMAPS software used for the calculations described in [37]. The spectral corrections were implemented as a separate monthly correction factor, using the data supplied with PVMAPS.
4. Results and discussion
4.1 Validation of the satellite-based solar radiation products
Considering the results obtained in all the stations, the SARAH data record performed better for both the GHI and the DNI estimation, with an overall relative MBD for all the stations (grMBD) of 1.41% for the GHI and 2.85% for DNI. The Operational data record resulted in grMBD values of 4.91% and 13.57% for GHI and DNI respectively. The grMBD is the average of the rMBD values of all stations.
Analysing the rMAD, the differences between SARAH and Operational results were not as significant as with the rMBD values, especially for the DNI. For the GHI validation, the grMAD (average of the stations' rMAD values), of SARAH product was 11.71%, while the Operational dataset resulted in 11.57% overall rMAD. Again errors were higher in the DNI comparison, with 21.66% for SARAH and 23.83% for the Operational data record. But both satellite products performed similarly in terms of the absolute differences between estimated and measured datasets.
Regarding the RMSD values, the behaviour of both satellite products in the estimation of the GHI values was similar, with a grRMSD (average of the stations' rRMSD values) of 28.76% for SARAH and 28.83% for the Operational data record. However, the performance of SARAH data record was better when the DNI was considered. While the grRMSD for the validation of the DNI values from SARAH was 49.79% that of the Operational data record was 57.19%.
Analysing the correlation between measured and estimated time series with the R2 coefficient, the average performance of both satellite data records in the estimation of the GHI values was the same, 0.96. Both satellite-based models were capable of representing the variability observed in the measured dataset. Regarding the DNI measured values the correlation of SARAH records was higher than the one derived from the Operational dataset, (0.89 and 0.86, respectively).
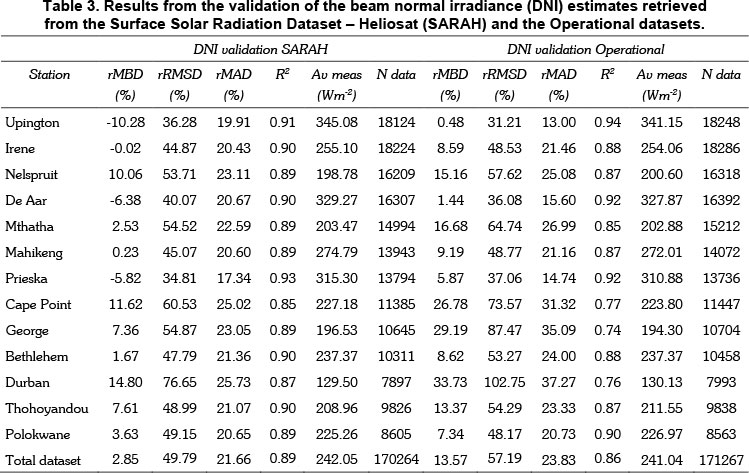
Tables 2 and 3 contain the relative MBD, RMSD and MAD values obtained from the validation of the complete valid time series of GHI and DNI estimates respectively, from both satellite products at every station. Besides, the R2 coefficient, the average measured irradiance value and the number of data points used at every location are also indicated. The last row has the results obtained when all the data available in all stations was considered.
From the validation of the global irradiance estimates, it can be observed that the SARAH product provided the more accurate estimates of the average GHI values in every location other than Upington, where it also showed the highest underestimation. The Operational model tended to overestimate the GHI measured values in all locations but Upington.
This underestimation from both satellite products at this location could indicate some problems with the recordings. Comparing the rMAD values, the Operational dataset performed slightly better, except for Mthatha, Durban and George near the coast, and for Bethlehem, situated at almost 1700 m above sea level. The lowest levels of irradiance, both global and beam, were registered at these coastal stations, where the satellite products tended to overestimate the solar resource to a greater extent. This could indicate either a problem with the ground measurements or a misinterpretation of the input parameters used by the satellite methods. The deviations observed in these stations could indicate a possible underestimation of the attenuation suffered by solar radiation in the atmosphere. This is more significant in the Operational dataset.
The range of the rMBD and rMAD values derived from both products indicated that the GHI deviations between estimated and measured irradi-ances were better compensated (overestimation and underestimation) in the SARAH product, even though the absolute deviations were slightly higher than those observed in the Operational data, as can be concluded from the rRMSD values.
Although not shown in Table 2, the absolute MBD values obtained from the SARAH validation were below 10 Wm-2 in all stations. In fact, in eight stations the MBD value was below 4 Wm-2. As for the Operational results, six stations surpassed the threshold of 10 Wm-2. Two of the three stations with worst MBD are Durban and Thohoyandou, where the available time series was among the shortest ones (15 months). By comparison, those stations with the highest number of available data (and which could therefore be considered more representative of the performance of the satellite models) tended to have lower errors.
Regarding the estimation of the beam normal ir-radiance (Table 3), both satellite methods presented higher rMAD and rRMSD values than when the global resource was estimated. The rMAD and rRMSD values were approximately double of those shown in Table 2. This proportion was not so clear for the rMBD values, although the values derived from the DNI validation were higher than those of the GHI validation. The sites where the SARAH product underestimated GHI also showed negative rMBD values in the DNI validation. The Opera-tional's trend to overestimate was more pronounced in the DNI values as well, especially in the locations near the coast (Durban, Mthatha, George and Cape Point).
While for the GHI validation the SARAH estimates showed a MBD below 10 Wm-2 in all the stations, in the DNI validation some locations had a MBD value up to 26 Wm-2 like in Cape Point. However, almost half of the stations showed an MBD value below the threshold of 15 Wm-2. The MBD from the Operational validation was definitely higher. While the average MBD value considering all the stations was 3 Wm-2 for the SARAH product, due to the overestimation and underestimation shown in different locations, the overestimation shown by the Operational product in all the locations resulted in an average MBD value of almost 28 Wm-2 for the DNI estimation.
Analysing the R2 values, while for the GHI estimation both satellite products showed a similar behaviour, in the estimation of the beam irradiance values, the SARAH DNI estimates were better correlated with the measured values. The worst correlation values were observed in the locations where the Operational product more significantly overestimated the beam irradiance values (Cape Point, George or Durban), which are all coastal regions.
4.2. Monthly results
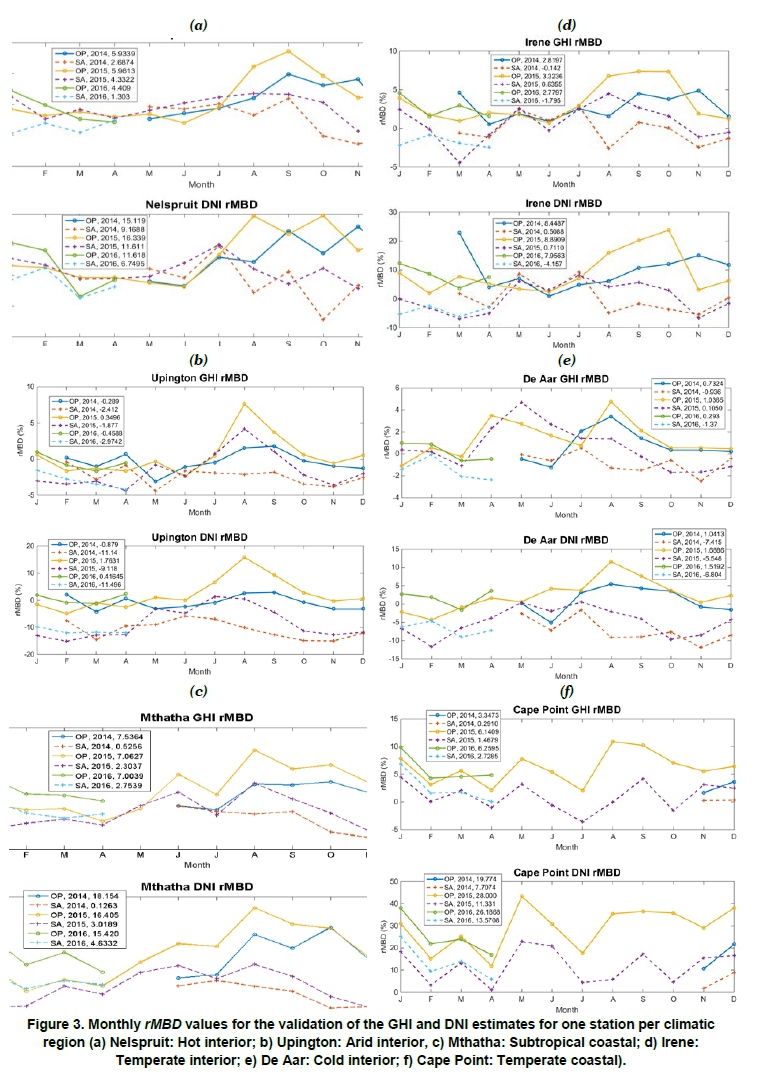
Owing to the different time periods available in the various stations, it is difficult to extract clear conclusions about the yearly performance of the satellite products, since the yearly MBD, RMSD and MAD values may derive from different months and therefore different climatic and meteorological conditions. Therefore, in order to analyse whether the satellite-based models behave similarly through the different available years, a comparison of the monthly deviations was made. Figure 3 contains the monthly rMBD values for the available years obtained from the validation of the hourly GHI and DNI estimates from both satellite products against the measured datasets. Six locations are shown, one per climatic region. Each part of the figure contains two graphs, the upper one with the results of the GHI validation and the lower one with the DNI validation results. The number of lines in each graph depends on the number of available years at the considered station: for every year available there are two lines, one for the Operational product (OP, continuous line) and one for the results of the SARAH validation (SA, dashed line). The values that accompany the legend are the yearly rMBD values, in percentages.
A trend was observed when the monthly rMBD values from different years were compared. The Operational values for both the GHI and the DNI validation tended to be higher than the SARAH ones, although the differences varied through the year. For the April-July period, corresponding to winter, SARAH and Operational products had very similar relative errors. Both the magnitude of the errors and the difference between the two satellite product values increased during the last months of the year. During the summer months, SARAH tended to compare better, with a tendency to underestimate both GHI and DNI, while the Operational product overestimated. This trend could be observed in the three years that form the time series.
The yearly profile of the monthly rMBD values from SARAH and Operational product tended to be parallel to a certain extent. In the same way the profile of the GHI and DNI rMBD values followed a similar pattern.
4.3 Solar radiation atlas for South Africa, results and data availability
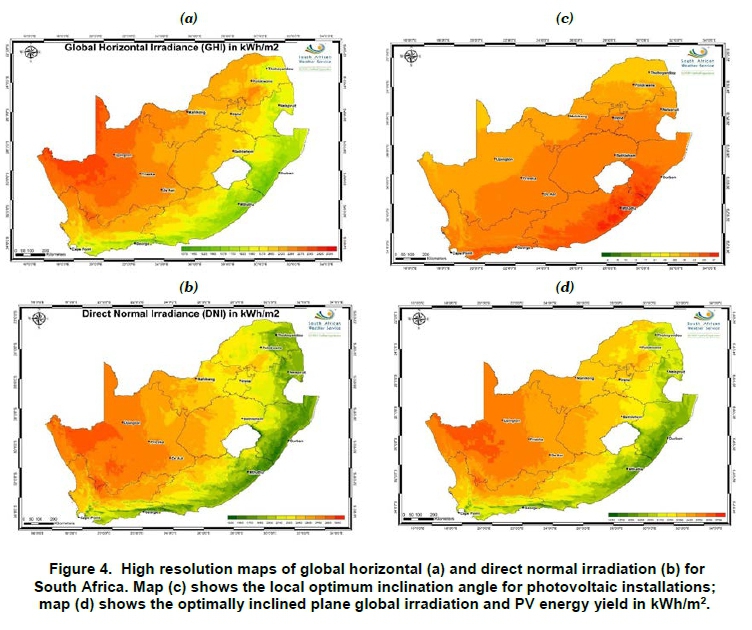
Based on the validation results, the SARAH solar radiation dataset was selected for the map calculations within PVMAPS [25]. High-resolution maps of solar radiation and PV performance for South Africa were created. The calculations included the effects of shadowing from terrain features, with a spatial resolution of three arc-seconds (about 90 m). The publicly available datasets contain the following fields:
a) long-term monthly and yearly average solar irradiation on a horizontal plane;
b) long-term monthly and yearly average direct solar irradiation on a two-axis sun-tracking plane;
c) optimum angle for maximum yearly average solar irradiation; and
d) long-term monthly and yearly average photovoltaic energy production for PV systems mounted at fixed optimum angle, using crystalline silicon PV modules.
Figure 4 shows examples of these digital maps, which could assist the solar industry to evaluate the available resource in an area for future deployment of solar projects. High detail of the maps shows solar radiation variability, especially in the areas with complex terrain, as depicted in Figure 6. The highresolution data and maps shown in Figure 4 are freely available for download at: http://re.jrc.ec.eu-ropa.eu/supplementary/maps_SA/index.html.
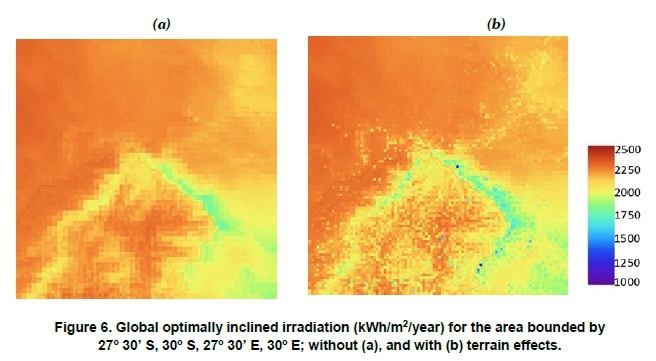
In order to better show the effect of the performed high-resolution calculation, Figure 5 offers a small region taken from the full datasets.
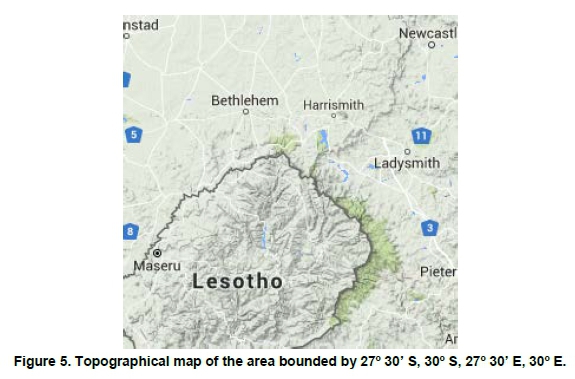
One of the possible outputs of PVMAPS is shown in Figure 6, which presents a comparison of the results from the said region of South Africa and Lesotho without and with the terrain effects. The effect of shadows is clearly visible in mountainous areas.
5. Conclusions
The comparison of two different satellite-based estimation models for solar irradiance data over South Africa showed that:
-
The best estimation model was the SARAH product, based on measurements registered at thirteen stations distributed in different climatic regions. Considering the complete dataset, the validation metrics for the SARAH product were better than those for the CMSAF Operational product for both GHI and DNI values, with the only exception being the global relative mean absolute difference (grMAD) value for GHI.
-
The SARAH satellite product provided estimates of the global horizontal irradiance with a global relative mean bias (grMBD) of 1.14% (around 3 Wm-2 in absolute terms) for the complete dataset analysed and whole group of locations. As for the estimation of the beam component, the grMBD obtained was 2.85%, around 7 Wm-2 with regard to the average measured value.
-
The estimates of the global horizontal and beam normal irradiance retrieved from the SARAH method provide an accurate description of the solar resource available at the locations analysed and could therefore produce good estimates in other locations.
-
The SARAH estimates can provide the basis for further analysis, such as the one presented in this paper on annual PV electricity production.
-
The combination of the satellite retrieved solar radiation estimates with digital elevation models, increased the quality of the irradiance estimates at locations with complex surrounding topography.
Using the freely available software PVMAPS various high-resolution maps of solar radiation and PV system energy yield for South Africa were created and made freely available for download.
Acknowledgments
Part of the work presented here was carried out within the 'Solar resource mapping for South Africa' project funded by the Department of Science and Technology. The research was also as part of the European Metrological Research Programme (EMRP) ENG55 project 'Towards an energy-based parameter for photovoltaic classification'. The EMRP is jointly funded by the EMRP participating countries within EURAMET and the European Union.
References
[1] Jäger-Waldau A. 2016. PV Status Report 2016. JRC Science for Policy Report. EUR 28159 EN. JRC 103426. Doi: 10.2790/682995. [ Links ]
[2] International Energy Agency. Renewables 2017. Analysis and forecast to 2022. IEA Publications. [ Links ]
[3] Sengupta M., Habte A., Gueymard C., Wilbert S., Renné D. 2017. Best practices handbook for the collection and use of solar resource data for solar energy applications: second edition. NREL/TP-5D00-68886. https://doi.org/10.18777/ieashc-task46-2017-0001 https://doi.org/10.2172/1411856 [ Links ]
[4] Antoñanzas-Torres F., Sanz-Garcia A., Martinez-de-Pison-Ascacibar FJ., Perpi-an-Lamiguiero O. 2013. Evaluation and improvement of empirical models of global solar irradiation: Case study northern Spain. Renewables Energies 60: 604-614. https://doi.org/10.1016/j.renene.2013.06.008 [ Links ]
[5] Dee D.P., Uppala S.M., Simmons A.J., Berrisford P., Poli P., Kobayashi S., Andrae U., Balmaseda M.A., Balsamo G., Bauer P., Bechtold P., Beljaars A.C.M., van de Berg L., Bidlot J., d Bormann N., Delsol C., Dragani R., Fuentes M., Geer A.J., Haimberger L., Healy S.B., Hersbach H., Hólm E.V., d Isaksen L., Kállberg P., Köhler M., Matri-cardi M., McNally A.P., Monge-Sanz B.M., Mor-crette J.-J., Park B.-K., Peubey C., de Rosnay P., Tavolato C., Thépaut J.-N., Vitart F. 2011. The ERA-Interim re-analysis: configuration and performance of the data assimilation system. Quarterly Journal of the Royal Meteorological Society 137: 553-597. https://doi.org/10.1002/qj.828 [ Links ]
[6] Urraca R., Huld T., Gracia-Amillo A., Martinez-de-Pison F.J., Kaspar F., Sanz-Garcia A. 2018. Evaluation of global horizontal irradiance estimates from ERA5 and COSMO-REA6 reanalyses using ground and satellite-based data. Solar Energy 164: 339354. https://doi.org/10.1016/j.solener.2018.02.059 [ Links ]
[7] Sengupta M., Habte A., Kurtz, S., Dobos, A., Wil-bert, S., Lorenz, E., Stoffel, T., Renné, D.,Guey-mard, C., Myers, D., Wilcox, S., Blanc, P., Perez, R., 2015. Best practices handbook for the collection and use of solar resource data for solar energy applications. NREL/TP-5D00-63112. https://doi.org/10.18777/ieashc-task46-2015-0001 [ Links ]
[8] Ineichen P., Barroso CS., Geiger B., Hollmann R., Marsouin A., Müller R. 2009. Satellite application facilities irradiance products: hourly time step comparison and validation over Europe. International Journal of Remote Sensing 30(21): 5549-5571. https://doi.org/10.1080/01431160802680560 [ Links ]
[9] Müller R., Matcoukas C., Gratzki A., Behr HD., Hollmann R. 2009. The CM-SAF Operational scheme for the satellite based retrieval of solar Surface irradiance - A LUT based eigenvector hybrid approach. Remote Sensing and Environment 113: 1012-1024. https://doi.org/10.1016/j.rse.2009.01.012 [ Links ]
[10] Ineichen P. 2013. Long Term Satellite Hourly, Daily and Monthly Global, Beam and Diffuse Irradi-ance Validation. Interannual Variability Analysis. Available online: http://archive-ou-verte.unige.ch/unige:29606 [accessed: 02.10.2017]. [ Links ]
[11] Gracia-Amillo A., Huld T., Müller R. 2014. Hourly solar radiation database for Eastern Europe and Asia. Validation and Applications to PV performance estimates. Proceedings 29th European Photovoltaic Solar Energy Conference and Exhibition, 2584-2588. [ Links ]
[12] Gracia-Amillo A., Huld T., Müller R. 2014. A new database of global and direct solar radiation using the eastern meteosat satellite, models and validation. Remote sensing 6(9): 8165-8189. https://doi.org/10.3390/rs6098165 [ Links ]
[13] Müller R., Pfeifroth U., Träger-Chatterjee C., Trentmann J., Cremer R. 2015. Digging the ME-TEO-SAT Treasure - 3 Decades of Solar Surface Radiation. Remote Sensing 7: 8067-8101. https://doi.org/10.3390/rs70608067 [ Links ]
[14] Müller R., Behrendt T., Hammer A., Kemper A. 2012. A new algorithm for the satellite-based retrieval of solar surface irradiance in spectral bands. Remote Sensing 4: 622-647. https://doi.org/10.3390/rs4030622 [ Links ]
[15] Inness A., Baier F., Benedetti A., Bouarar I., Cha-brillat S., Clark H., Clerbaux C., Coheur P., Engelen R.J., Errera Q., Flemming J., George M., Granier C., Hadji-Lazaro J., Huijnen V., Hurtmans D., Jones L., Kaiser J.W., Kapsomenakis J., Lefever K., Leitao J., Razinger M., Richter A., Schultz M.G., Simmons A.J., Suttie M., Stein O., Thépaut J.N., Thouret V., Vrekoussis M., Zerefos C., and the MACC team. 2013. The MACC reanalysis: An 8-year data set of atmospheric composition. Atmospheric Chemistry and Physics 13: 4073-4109. https://doi.org/10.5194/acp-13-4073-2013 [ Links ]
[16] Müller R., Pfeifroth U., Träger-Chatterjee C. 2015. Towards optimal aerosol information for the retrieval of solar surface radiation using Heliosat. Atmosphere 6(7): 863-878. [ Links ]
[17] Riihelä A., Carlund T., Trentmann J., Müller R., Lindfors A. V. 2015 Validation of CM SAF Surface Solar Radiation Datasets over Finland and Sweden. Remote Sensing 7: 6663-6682. https://doi.org/10.3390/rs70606663 [ Links ]
[18] Urraca R., Gracia-Amillo A. M., Koubli E., Huld T., Trentmann J., Riihelä A., Lindfors A. V., Palmer D., Gottschalg R., Antoñanzas-Torres F. 2017. Extensive validation of CM SAF surface radiation products over Europe, Remote Sensing of Environment. 199: 171-186. https://doi.org/10.1016/j.rse.2017.07.013 [ Links ]
[19] Žák M., Mikšovsky J., Pišoft P. 2015. CMSAF radiation data: New possibilities for climatological applications in the Czech Republic, Remote Sensing 7(11): 14445-14457. doi:10.3390/rs71114445. https://doi.org/10.3390/rs71114445 [ Links ]
[20] Huld T., Mueller R., Gambardella A. 2012. A new solar radiation database for estimating PV performance in Europe and Africa. Solar Energy 86(6): 1803-1815. https://doi.org/10.1016/j.solener.2012.03.006 [ Links ]
[21] Badescu V., Dumitrescu A. 2013. Accuracy of CM-SAF solar irradiance incident on horizontal surface. Theoretical and Applied Climatology 117(1-2): 233-246. https://doi.org/10.1007/s00704-013-0990-1 [ Links ]
[22] Antoñanzas-Torres F., Ca-izares F., Perpi-án O. 2013. Comparative assessment of global irradiation from a satellite estimate model (CM SAF) and on-ground measurements (SIAR): A Spanish case study. Renewable and Sustainable Energy Reviews 21: 248-261. https://doi.org/10.1016/j.rser.2012.12.033 [ Links ]
[23] SANS 204. 2008. South African National Standard. Energy efficiency in buildings, Part 1: General requirements. SABS Standards Division. Available online: https://www.sabs.co.za/Sectors-and-Ser-vices/Services/Energy/energy_sp.asp [accessed: 15.09.2013]. [ Links ]
[24] Lorenz E., Kühnert J., Heinemann D., Nielsen K.P., Remund J., Müller S.C. 2015. Comparison of irra-diance forecast based on numerical weather prediction models with different spatio-temporal resolutions. Proceedings 31st European Photovoltaic Solar Energy Conference and Exhibition, 1626-1640. [ Links ]
[25] Huld T. 2017. PVMAPS: Software tools and data for the estimation of solar radiation and photovoltaic module performance over large geographical areas. Solar Energy 142: 171-181. https://doi.org/10.1016/j.solener.2016.12.014 [ Links ]
[26] Súri M., Hofierka J. 2004. A new GIS-based solar radiation model and its application for photovoltaic assessment. Transactions in GIS 8(2): 175-190. https://doi.org/10.1111/j.1467-9671.2004.00174.x [ Links ]
[27] Muneer T. 1990. Solar radiation model for Europe. Building Services Engineering Research and Technology 11(4): 153-163. https://doi.org/10.1177/014362449001100405 [ Links ]
[28] Huld T., Suri M., Dunlop E. 2008. Comparison of potential solar electricity output from fixed-inclined and two-axis tracking photovoltaics modules in Europe. Progress in Photovoltaics Research and Applications 16(1): 47-59. https://doi.org/10.1002/pip.773 [ Links ]
[29] Huld T., Cebecauer T., Suri M., Dunlop E. 2010. Analysis of one-axis tracking strategies for PV systems in Europe. Progress in Photovoltaics Research and Applications 18(3): 183-194. https://doi.org/10.1002/pip.948 [ Links ]
[30] Suri M., Huld T., Dunlop E. 2005. PV-GIS: a web-based solar radiation database for the calculation of PV potential in Europe. International Journal of Solar Energy 24(2): 55-67. https://doi.org/10.1080/14786450512331329556 [ Links ]
[31] Shuttle Radar Topography Mission. The mission to map the world. https://www2.jpl.nasa.gov/srtm/ [accessed: 02.10.2017]. [ Links ]
[32] GRASS GIS manual: r.horizon Computes horizon angle height from a digital elevation model. https://grass.osgeo.org/grass72/manuals/r.hori-zon.html [accessed: 02.10.2017]. [ Links ]
[33] Huld T., Gracia Amillo A. 2015. Estimating PV module performance over large geographical regions: the role of irradiance, air temperature, wind speed and solar spectrum. Energies 8: 5159-5181. https://doi.org/10.3390/en8065159 [ Links ]
[34] Huld T., Friesen G., Skoczek A., Kenny R.P., Sample T., Field M., Dunlop E.D. 2011. A power-rating model for crystalline silicon PV modules. Solar Energy Materials and Solar Cells 95(12): 3359-3369. https://doi.org/10.1016/j.solmat.2011.07.026 [ Links ]
[35] Koehl M., Heck M., Wiesmeier S., Wirth J. 2011. Modelling of the nominal operating cell temperature based on outdoor weathering. Solar Energy Materials and Solar Cells 95(7): 1638-1646. https://doi.org/10.1016/j.solmat.2011.01.020 [ Links ]
[36] Gracia Amillo A., Huld T., Vourlioti P., Mueller R., Norton M. 2015. Application of satellite-based spectrally resolved solar radiation data to PV per-for-mance studies. Energies 8: 3455-3488. https://doi.org/10.3390/en8053455 [ Links ]
[37] Suri M., Huld T., Dunlop E., Ossenbrink H. 2007. Potential of solar electricity generation in the European Union member states and candidate countries. Solar Energy 81: 1295-1305. https://doi.org/10.1016/j.solener.2006.12.007 [ Links ]
* Corresponding author: Tel: +27 12 367 6239; email: lucky.ntsangwane@weathersa.co.za

