


Servicios Personalizados
Articulo
 Inglés (pdf)
 Articulo en XML
 Referencias del artículo
Indicadores

Links relacionados
-
 Citado por Google
 -
 Similares en Google
Compartir

 Permalink
Journal of Energy in Southern Africa
versión On-line ISSN 2413-3051
versión impresa ISSN 1021-447X
J. energy South. Afr. vol.29 no.2 Cape Town may. 2018
http://dx.doi.org/10.17159/2413-3051/2017/v29i2a2746
ARTICLE
Investigating seasonal wind energy potential in Vredendal, South Africa
Thapelo MosetlheI, *; Adedayo Ademola YusuffII; Yskandar HamamI
IDepartment of Electrical Engineering/French South African Institute of Technology, Tshwane University of Technology, Private Bag X680, Pretoria 0001, South Africa
IIDepartment of Electrical and Mining Engineering, University of South Africa, P O Box 392, Unisa 0003, South Africa
ABSTRACT
Global warming and the energy crisis have necessitated an urgent exploitation and utilisation of renewable energy. Wind energy has gained popularity over the years because of vast availability of its resource. A study was carried out to investigate the stochastic characteristics of the available wind energy at installation sites. Data for a ten-minute interval wind speed collected over a period of five years and measured at a height of 10, 40 and 62 m in Vredendal was considered. Wind speed data was arranged in seasonal format and its statistical distribution investigated based on Weibull, lognormal and gamma distributions. The Anderson-Darling test and Akaike information criterion were used to evaluate the goodness of fit. The results showed that wind power at different heights and time stamps exhibited different statistical distribution. It was found that wind turbines in Vredendal must be installed as high as possible to harness wind power effectively. During summer and spring, there was a high potential for wind power availability compared with that of winter.
Keywords: stochastic; weather; renewable energy
1. Introduction
The utilisation of renewable energy sources (RESs) has been a burning issue in research and energy production. Different types of RES, such as solar, wind, and biomass have been exploited as alternatives to the burning of fossil fuels to generate electric power. In the past two decades, efforts were made on effectively integrating RESs into the grid (Mosetlhe et al., 2017; Ayodele et al., 2012), with wind energy showing great potential in electricity generation. As wind energy depends primarily on the behaviour of wind it has stochastic characteristics, and it is imperative that these are known for a given installation, so that the wind energy is effectively utilised.
Modelling of RESs has attracted a great interest, with an attempt to describe their stochastic behaviour. Algorithms such as autoregressive integrated moving average were used with success in modelling solar radiation data by Ranganai & Nzuza (2015). Regression models estimated the intermittent nature of RES. In Vhembe region, Mulaudzi et al. (2013) used regression models to estimate and predict the availability of RESs. The correlation coefficient for the developed models was above 0.9, which validated the results and indicated that the models could be approximated to real-world measurements (Taylor, 1990).
Artificial intelligence techniques such as neural networks have been used because of their reliability in predicting time-series data (Dombayci & Gölcü, 2009). A multi-layer neural network of at least three layers was proposed to estimate and predict the stochastic behaviour of wind energy by Nogay et al. (2012). The revision of this proposed methodology was found to give satisfactory performance for forecasting short-term data (Özgür, 2014).
A statistical approach shows efficiency in modelling long-term wind speed data, although the artificial intelligence techniques give satisfactory results for short-term data analysis. Economic evaluation of wind energy potential and its importance is, consequently, realised. A Weibull model for wind speed data collected over a period of five years in Zahedan (Iran) was developed based on a statistical approach (Mostafaeipour et al., 2014). Wind energy density and wind energy potential from the model were quantified, and four different types of wind turbines were considered to evaluate the economic prospects of Zahedan. A 2.5 kW model wind turbine showed great economic viability when installed on the same site.
Long-term wind speed data was collected over a period of eleven years in Tehran (Keyhani et al., 2010), where measurements of the mean wind speed were taken three-hourly. The data was used to estimate the range of dimensionless Weibull shape parameter (k) and Weibull scale parameter (c). The results showed that April and August had the lowest wind energy potential. It was also noted that the wind energy potential in Tehran was not substantial enough to warrant a large-scale wind farm, or integration into the grid.
Wind is used in Turkey to augment electric power supply. At Iskenderun, Weibull and Ray-leigh's distributions were used to model wind speed data over one year (Celik, 2004). Measurements were taken on an hourly basis to obtain wind speed time-series data. The Weibull model gave a better representation of the intermittent behaviour of wind speed at the site.
Hourly mean wind speed data was collected at Kirklareli, also in Turkey (Gokcek et al., 2007), and in Rwanda (Safari & Gasore, 2010). The goodness of fit of the data for Weibull and Raleigh distributions were analysed to estimate available wind power at selected sites. In both Turkey and Rwanda, the results based on correlation coefficient (R2) showed that Weibull might sometimes perform badly in other sites. The appropriateness of Weibull was compared with Rayleigh and gamma distribution (Olaofe & Folly, 2012), where data were collected at 10, 50, and 70 m above sea levels. Chi-squared test and R2 were used to estimate the goodness of fit at different height levels. It was found that Rayleigh distribution function gave a better estimate of wind speed than Weibull and gamma distribution function. Weibull distribution proved to be an appropriate function to model long-term wind speed data averaged on an hourly basis (Ayodele et al., 2013), whereas artificial neural networks showed its effectiveness for short-term (i.e., daily, monthly) modelling (Özgür, 2014; Nogay et al., 2012).
The present study investigated the possibility of using statistical distributions to model short-term (seasonal) wind speed data. The appropriateness of statistical distributions (Weibull, lognormal and gamma) was evaluated using the test of Anderson and Darlington (1952) and the information criterion of Akaike (2011). A model was formulated to quantify the availability of wind energy at different heights, based on the distribution functions. Sections 2 and 3 give theoretical background for the estimation of the stochastic characteristics of potential wind energy at Vredendal, Western Cape province, South Africa. Data collection and results of statistical analysis are presented in Sections 4 and 5 respectively. Discussion and conclusions are presented in Sections 6 and 7.
2. Theoretical background
The stochastic characteristics of wind speed at a site depend on weather conditions, so they can be considered as a random variable. In probability theory, a random variable χ(ζ) is defined by an event ζ, which assigns values χ to possible outputs (Alberto, 2008; Hsu, 1997). A probability is assigned for all outputs generated by a random variable. A rea number called a distribution function is assigned to each event as a probability measure P. The density of this probability can be defined as Equation 1.
As wind speed is collected and varies over time T, it is classified as a random process (Liptser & Shiryaev, 2013). An approach to define a random process considers a function X(t) as a random process for time t1. A random variable X1 = X(t1) can be described by its cumulative distribution function (CDF) Fx (x1, tx) according to Equation 2.
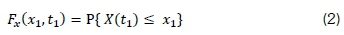
where Fx (x1, tx) is a first-order distribution of X(t), while second-order distribution of X(t) is given by Equation 3.
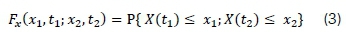
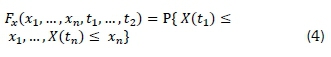
where for a given time t1 and t2, X1 = X(t1) and X2 = X(t2) are two random variables. Therefore, the nth CDF of a random process can be defined by Equation 4.
Weibull distribution is generally used to describe wind speed data as a random process, hence it was compared with lognormal and gamma distributions to describe wind speed data in this work. These distributions and their properties are outlined in this section. Furthermore, the goodness of these distributions is tested using the Anderson-Darling (AD) and Akaike information criterion (AIC) tests.
2.1 Probability distribution fitting
(a) Weibull distribution
The Weibull probability density function (PDF) is calculated by Equation 5 (Ayele et al., 2018).
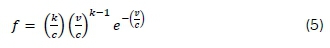
where f is the probability of describing the wind speed v. The parameters k and c are the shape and the scale parameter of Weibull distribution respectively.
(b) Lognormal distribution
Lognormal distribution has been used mostly to evaluate the time series data (Saucier, 2000). Its two parameters PDF are described by Equation 6.
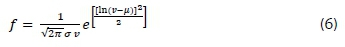
where μ and σ are respectively the parameters of lognormal distribution representing the scale and shape parameter.
(c) Gamma distribution
Mosetlhe et al. (2016) used gamma distribution to estimate the characteristics of time series data and given by Equation 7 (Saucier, 2000).
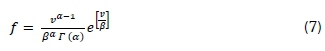
where Γ(α) is a gamma function defined by Equation 8.
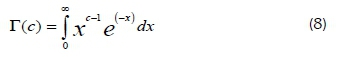
and the parameters a and β are the shape and the scale parameters respectively.
2.2 Goodness of fit
The AD and AIC were used in this work to evaluate the goodness of fit using Equation 9.
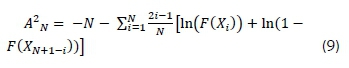
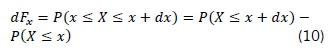
where X1 < - < XNare ordered sample data and Ν is the number of samples. A deviation of the model derived from probability distribution f from true distribution g is measured using the AIC according to Equation 10.
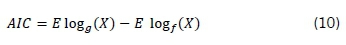
where E is the expectation with respect to the true distribution g of X (Akaike, 2011).
3. Estimation of wind power density
The available wind power density in W/m2 is given by Equation 11 (Olaofe & Folly, 2012).
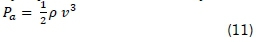
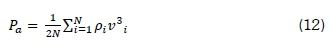
where ρ is the air density of the site, and Pais the wind power density. To obtain more accurate wind power density, Equation 11 becomes Equation 12 to take into consideration the time variation of the wind speed and air density.
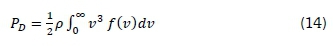
The expected value of the cube of the wind speed is given by Equation 13 (Ayodele et al., 2012).
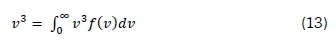
where f(y) is wind distribution. Substituting Equation 13 into 11 gives Equation 14.
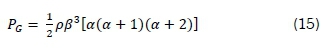
Estimating wind power density using gamma distribution is achieved by substituting Equation 7 in Equation 14, which yields Equation 15.
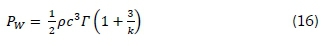
For Weibull distribution, Equation 4 is substituted in Equation 14 to obtain Equation 16.
4. Methodology
The wind speed data over a period of five years: 01/01/2011-31/12/2015 was collected at Vreden-dal. Measurements were taken at intervals of ten minutes and height levels of 10, 40, and 62 m. The data collected is divided into seasonal groups according to season: summer (December-February), autumn (March-May), winter (June-August) and spring (September-November). The data collected for these seasons is tested based on the three distributions described in Section 2.
5. Results
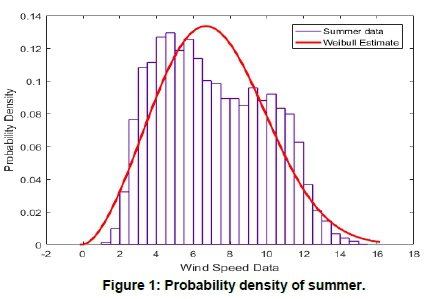
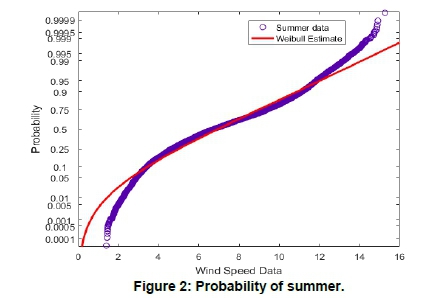
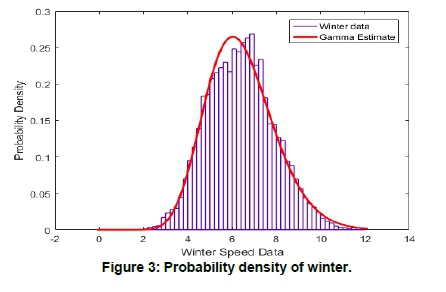
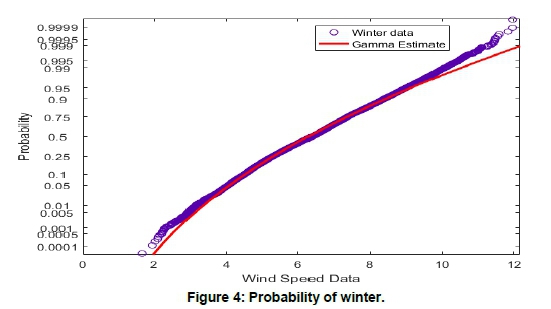
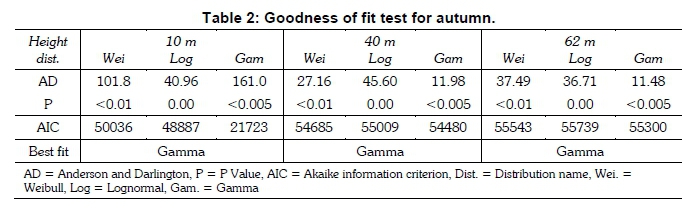
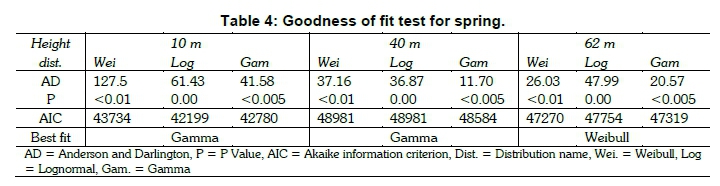
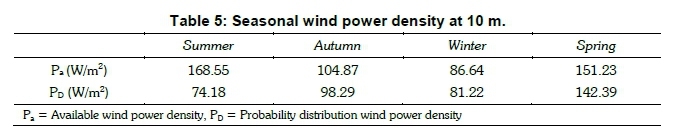
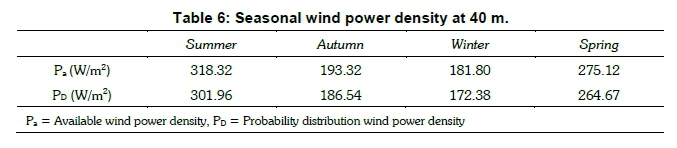
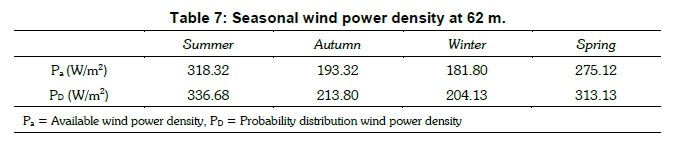
The results of goodness of fit test performed for all the seasons based on Section 2.2 are presented in Tables 1, 2, 3 and 4. The seasonal wind power densities at 10, 40 and 62 m calculated using Equation 8 are presented in Tables 5, 6 and 7, together with wind power densities based on wind distribution in Equations 11 and 12. The variation of the distribution and their probabilities for Summer and Winter at 40 m are shown in Figures 1, 2, 3 and 4.
6. Discussion
Wind speed data at different heights of the same site can have dissimilar distributions. Seasonal wind speed data considered at Vredendal at different heights showed different characteristics. The goodness of fit test in Tables 1-4 indicates that gamma distributions gave a better estimation of seasonal data than Weibull and lognormal. Weibull distribution for summer seasons gave a better estimation as compared to gamma and lognormal distributions for wind speed at 40 and 62 m. Figures 1-4 show that the data estimated by the probabilities is relatively close to the original data. The wind speed data at different height levels at the same site exhibited different distributions, implying that a single probability distribution could not be used to generalise wind speed distribution at different heights. It is, therefore, imperative to investigate the statistical properties of installation sites for varying heights.
Summer and spring have a better wind energy potential. It is easily observed in Tables 1-4 that, for all the seasons, there is an increase in wind energy potentials as the installation height increases. Wind turbines must, therefore, be installed as high as possible to harness wind power effectively at Vredendal.
7. Conclusions
Wind energy potential at Vredendal was investigated by outlining the theoretical background for the proposed model and adopting the goodness of fit tests. Parameters of the distributions were estimated. From the results, it can be deduced that, for effective exploitation of wind energy in Vredendal in the Western Cape province of South Africa, turbines must be installed as high as possible. Furthermore, it can be concluded that the site can contribute more energy towards the overall electrical power supply during the summer and spring than in winter and autumn.
References
Abdulkarim, A., Abdelkader, S. M. & John Morrow, D. 2015. Statistical analyses of wind and solar energy resources for the development of hybrid microgrid. In: Oral A., Bahsi Oral Z., Ozer M. (eds) 2nd International Congress on Energy Efficiency and Energy Related Materials (ENEFM2014), Springer Proceedings in Energy, Switzerland, 2015: 9-14. https://doi.org/10.1007/978-3-319-16901-9_2 [ Links ]
Akaike, H. 2011. Akaike's information criterion. In: International Encyclopedia of Statistical Science. Berlin, Heidelberg: Springer Berlin Heidelberg: 25-25. https://doi.org/10.1007/978-3-642-04898-2_110 [ Links ]
Alberto, L.-G. 2008. Probability, statistics, and random processes for electrical engineering. Upper Saddle River, NJ: Pearson/Prentice Hall. [ Links ]
Anderson, T. W. & Darling, D. A. 1952. Asymptotic theory of certain 'goodness of fit' criteria based on stochastic processes. The Annals of Mathematical Statistics 23: 193-212. https://doi.org/10.1214/aoms/1177729437 [ Links ]
Ayele, N. L., Akshay, K. S. & Rudiren, P. C. 2018. Characterisation of wind speed series and power in Durban. Journal of Energy in Southern Africa 28(3): 6678. [ Links ]
Ayodele, T. R., Jimoh, A. A., and Munda, J. L. & and Agee, J. T. 2013. A statistical analysis of wind distribution and wind power potential in the coastal region of South Africa. International Journal of Green Energy 10(8): 814-834. https://doi.org/10.1080/15435075.2012.727112 [ Links ]
Ayodele, T. R., Jimoh, A. A., Munda, J. L. & Agee, J. T. 2012. Statistical analysis of wind speed and wind power potential of Port Elizabeth using Weibull parameters. Journal of Energy in Southern Africa 23(2): 30-38. [ Links ]
Celik, A. N. 2004. A statistical analysis of wind power density based on the Weibull and Rayleigh models at the southern region of Turkey. Renewable Energy 29(4): 593-604. https://doi.org/10.1016/j.renene.2003.07.002 [ Links ]
Dombayci, Ö. A. & Gölcü, M. 2009. Daily means ambient temperature prediction using artificial neural network method: A case study of Turkey. Renewable Energy 34: 1158-1161. https://doi.org/10.1016/j.renene.2008.07.007 [ Links ]
Gokcek, M., Bayulken, A. & Bekdemir, S. 2007. Investigation of wind characteristics and wind energy potential in Kirklareli, Turkey. Renewable Energy 32(10): 1739-1752. https://doi.org/10.1016/j.renene.2006.11.017 [ Links ]
Hsu, H. P. 1997. Theory and problems of probability, random variables, and random processes. Schaums Outline Series. [ Links ]
Keyhani, A., Ghasemi-Varnamkhasti, M., Khanali, M. & Abbaszadeh, R. 2010. An assessment of wind energy potential as a power generation source in the capital of Iran, Tehran. Energy 35(1): 188-201. https://doi.org/10.1016/j.energy.2009.09.009 [ Links ]
Liptser, R. & Shiryaev, A. N. 2013. Statistics of random processes: I. General theory. Springer Science & Business Media. [ Links ]
Mosetlhe, T. C., Yusuff, A. A. & Hamam, Y. 2017. Assessment of small signal stability of power systems with wind energy conversion unit. Proceedings of IEEE Africon, Cape Town, South Africa, 2017: 10891094. https://doi.org/10.1109/AFRCON.2017.8095634 [ Links ]
Mosetlhe, T. C., Yusuff, A. A., Hamam, Y. & Jimoh, A. A. 2016. Estimation of wind speed statistical distribution at Vredendal, South Africa. Proceeding of International Association of Science and Technology for Development (IASTED), Gaborone, Botswana, 2016: 344-349. [ Links ]
Mostafaeipour, A., Jadidi, M., Mohammadi, K. & Seda-ghat, A. 2014. An analysis of wind energy potential and economic evaluation in Zahedan, Iran. Renewable and Sustainable Energy Reviews 30(1): 641-650. https://doi.org/10.1016/j.rser.2013.11.016 [ Links ]
Mulaudzi, S. T., Sankaran, V. & Lysko, M. D. 2013. Solar radiation analysis and regression coefficients for the Vhembe Region, Limpopo Province, South Africa. Journal of Energy in Southern Africa 24(3): 1-7. [ Links ]
Nogay, S. H., Akinci, T. C. & Eidukeviciute, M. 2012. Application of artificial neural networks for short term wind speed forecasting in Mardin, Turkey. Journal of Energy of Southern Africa 23(4): 2-7. [ Links ]
Olaofe, Z. O. & Folly, K. A. 2012. Statistical Analysis of Wind Resources at Darling for Energy Production. International Journal of Renewable Energy Research 2(2): 250-261. [ Links ]
Özgür, M. A. 2014. ANN-based evaluation of wind power generation: A case study in Kutahya, Turkey. Journal of Energy in Southern Africa 25(4): 11-22. [ Links ]
Ranganai, E. & Nzuza, M. B. 2015. A comparative study of the stochastic models and harmonically coupled stochastic models in the analysis and forecasting of solar radiation data. Journal of Energy in Southern Africa 26(1): 125-137. [ Links ]
Safari, B. & Gasore, J. 2010. A statistical investigation of wind characteristics and wind energy potential based on the Weibull and Rayleigh models in Rwanda. Renewable Energy 35(12): 2874-2880. https://doi.org/10.1016/j.renene.2010.04.032 [ Links ]
Saucier, R. 2000. Computer generation of statistical distributions. Defense Technical Information Center. https://doi.org/10.21236/ADA374109 [ Links ]
Taylor, R., 1990. Interpretation of the correlation coefficient: A basic review. Journal of Diagnostic Medical Sonography 6(1): 35-39. https://doi.org/10.1177/875647939000600106 [ Links ]
* Corresponding author: +27 71 185 4301; email: mosetlhethapelo@yahoo.com

