


Services on Demand
Article
 English (pdf)
 Article in xml format
 Article references
Indicators

Related links
-
 Cited by Google
 -
 Similars in Google
Share

 Permalink
Journal of Energy in Southern Africa
On-line version ISSN 2413-3051
Print version ISSN 1021-447X
J. energy South. Afr. vol.29 n.1 Cape Town Feb. 2018
http://dx.doi.org/10.17159/2413-3051/2018/v29i1a2775
ARTICLES
The impact of a fuel levy on economic growth in South Africa
Thobeka NcanywaI, *; Nosipho MgwangqaII
IUniversity of Limpopo, Private Bag X1106, Sovenga 0727, South Africa
IIUniversity of Fort Hare, Private Bag X1314. Alice 5700, South Africa
ABSTRACT
Government expenditure is one of the factors that could influence economic growth and it depends on borrowing or on the amount of tax revenue. A fuel levy, as an excise tax charged on petroleum products such as petrol, diesel and biodiesel, can be an important source of revenue for the government. It can, however, be a burden on fuel consumers. The present study, as an effort to address this controversy, used the vector autoregressive approach to examine the impact of fuel levies on economic growth in South Africa. The results showed a longrun unidirectional negative relationship between economic growth and fuel levy. The conclusion was that the economy needs to grow at a higher rate so as to boost tax revenues and public expenditure. Strong revenue collection, therefore, depends on highly increasing economic growth and efficient tax administration. The implication of a growth-oriented tax system is to minimise distortions created by the tax system and create incentives for drivers of economic growth.
Keywords: excise tax, tax revenue, vector error correction model, expenditure
1. Introduction
There has been a growing debate about what influences growth in the economy, especially in developing countries like South Africa (Gordhan, 2012). The economy of a country is regarded as growing if there is an increment in the productive capacity which positively influence the lives of its citizens (Black & Bhanisi, 2001; Maia & Hanival, 2013). South Africa's real economic growth was around 2.83% per annum during 1993-2017, with a notable large growth of around 1.4% during 19881992 (StatsSA, 2017). The rate of growth, however, fell short of the international mean of 3.1% for developing countries (Global Economic Outlook, 2018). South African economic growth has been fluctuating and volatile, especially due to its links to the global economy. For instance, the country was negatively affected by the East Asian crisis of 1998, while it was adjusting to its global activities of trade liberalisation and some structural reforms (Glenday, 2008). One factor that could influence economic growth is government expenditure, which depends on the amount of tax revenues collected or borrowing. It is, consequently, imperative to find out if tax revenues collected from a fuel levy could affect economic growth.
Fuel levy is an excise tax charged on petroleum products such as petrol, diesel and biodiesel, as informed by the South African Customs and Excise Act No 91 of 1964 (Salmons, 2011; Gordhan, 2012). Other countries might use a fuel levy to fund a specific project, while in South Africa it is instituted at the national level to be part of the general funds used by the government (Reynolds & Schoor, 2005; Jibrin et al., 2012). The introduction and increments of a fuel levy can discourage vehicle users from using their vehicles and can promote use of public transport or vehicle lift clubs. Furthermore, a fuel levy promotes use of more fuel-efficient technologies which are cost-saving and less polluting, while revenues are also collected (Ncube et al, 2012).
Excise duties are either specifically based or ad valorem (Manuel, 2002). The fuel levy, and specific excise duties on tobacco, alcoholic and non-alcoholic beverages are imposed as fixed amounts. Ad valorem excise duties, value added tax (VAT,) are imposed as a percentage on the values of some goods, especially so-called 'luxury goods'. South Africa took a policy decision in 1996 and is consistently implementing this to the effect that 50% of the tax burden of the excise duty should be charged on the retail price of the product (Odhiambo, 2009). However, there should be a sensitive lookout, as a consequence of increments of excise duties, to prevent smuggling from surrounding countries and thwarting the creation of black markets.
The link between fuel levy and economic growth can be explained from both the demand and supply sides (Mabugu et al., 2009; Black & Bhanisi, 2001; Glenday, 2008). On the demand side, the consumer's demand for fuel is elastic to changes in the fuel levy. The supply side is affected through the cost of production as fuel is used as an input factor. As of 7 April 2010, fuel levy increased by 25.5 c/litre and amounted to ZAR 29 billion, which was about 6 % of total revenue (Budget speech, 2015). Concurrently, South Africa showed 4.8% and 5.6% decreases in, respectively, petrol and diesel consumption in 2013. In the 2015/2016 fiscal year the government increased levies by 80.5 c/litre, of which 30.5 c/litre was a contribution from the general fuel levy and 50 c/litre from the road accident fund (Budget speech 2016). Then in the 2017/2018 fiscal year there has been levy increments of 52 c/litre, made up of a 22 c/litre for the general fuel levy and a 30 c/litre increase in the road accident fund (Budget speech, 2018).
Researchers have examined the impact of fuel levies on economic growth in developed and developing countries, where the results have yielded similar outcomes. Sun et al. (2013) examined oil price effects in the United States, Europe and Japan and found that tax elasticity of international oil prices was significantly negative for the United States and Europe. Reynolds & Schoor (2005) examined the impact of an introduced fuel levy on the South African economy, showing that there was a negative effect on production input costs of petroleum products. Increasing fuel levy might lead to decreasing expenditure by households, lower employment and decreasing returns to factors employed in production.
Considering the potential conflict between applying a fuel levy to increase government revenues and avoiding a simultaneous decrease in expenditure and production, a study investigating whether fuel levies have an impact on economic growth could be significant. This is, in fact, a research gap in studies relating to the fuel levy in South Africa, unlike in developed countries (Sun et al., 2013; Reynolds & Schoor, 2005). The present paper contributes to the field by examining the impact of the fuel levy on economic growth in South Africa. The paper is structured as follows: section 2 reviews the literature, section 3 describes the methodology, section 4 presents results and discussion, and section 5 offers a conclusion.
2. Literature review
The earliest theoretical work on fuel prices and economic growth, according to Berument et al. (2010), can be traced back to several studies, including Rasche and Tatom (1977), Bernanke (1983), Finn (2000) and Hamilton (2009). Rasche and Tatom (1977) found that there is a link between oil price fluctuations and the output of an economy on the supply-side. An increase in crude oil price affects inputs of production, which reduces productivity and growth of output, and ultimately results in energy scarcity. Bernanke (1983) elaborated on the capital equipment utilisation hypothesis, where it was demonstrated that in a partial equilibrium model oil price shocks result in uncertainties. The uncertainties discourage investors from irreversible investment decision, or leading them to postpone permanent investment decisions given uncertainty about future crude oil price changes. This is likely to negatively affect the growth of output of an economy. Finn (2000) formulated an indirect channel of capital stock utilisation and direct production channel in perfectly competitive markets, where energy usage is an input factor. There is an inverse influence of crude oil price on energy use and capital utilisation, which is demonstrated in a firm's production function directly, where oil price increments result in a reduction of output and labour's marginal productivity. Hamilton (2009) used a literature survey to further illustrate that oil price effects can be attributed from both the demand side through expenditure behaviour and firm's activities even on non-oil goods and services. Wicksell (1958) related economic growth to distribution of income, where there is substitution in the factors of production. With heterogeneous capital goods, social capital had of necessity to be conceived of as a value magnitude. Hence, current growth models should place people and living standards at the centre of national economic policy and international growth (Wicksell, 1958; Kurz & Salvadori 2003).
There have also been examinations of the relationship between tax rates and economic growth, using different estimation techniques, including computable general equilibrium (CGE) (Reynolds & Schoor, 2005), ordinary least squares (Leicester, 2005), two-stage least squares (Golombek et al., 2011), and panel data analysis (Sun et al., 2013). Reynolds & Schoor (2005) used a CGE model to identify behavioural relationship of petroleum taxes on economic growth. That study indicated a small impact of fuel levy on economic growth, negative impact on real household expenditure, and there was some tax incidence on raising fuel levies. Willenbockel and Hoa (2011) found short- and long-run effects of increasing fuel levies. The study also indicated that the impact of fuel tax induced energy efficiency gains arising from the adaption of low-carbon technologies. The CGE model was used in the study and the variables of interest used in the model were real GDP real household consumption, and the aggregate real investment. The findings indicated that the lump sum re-transfer of carbon tax revenue to the household sector entails a drop in real investment growth, because households use additional transfer income primarily for consumption purposes. The ordinary linear regression model was used by Leicester (2005), where it was shown that an increase in fuel duty would likely have an impact on income distribution. Newbery (2005) also evaluated the implications of tax theory on efficient energy tax design using a simple linear regression model. The results of the study indicated that most energy taxes are excise taxes imposed to collect government revenues, regulate global warming, fund road projects, and correct failures of insufficient collections in the tax system.
Golombek et al. (2011) studied what determines gasoline tax, using a two-stage least squares approach. The variables of interest used in this model were consumption, GDP and government expenditure. The results showed that gasoline tax is elastic to exogenous prices. Furthermore, there was a unidirectional causality where higher consumption expenditure led to a decrease of taxes. Another study related to taxation examined the oil price effects in the United States, Europe and Japan and found that there is a shift of the domestic tax burden to the international economy (Sun et al., 2013). Some studies employed a co-integration analysis to find a long run relationship between fuel taxes and economic growth (Polemis, 2007; Cheung & Thomson, 2004; Ehigiamusoe, 2014). Other studies discovered that developing countries adopted tax policies that have no permanent effects on economic growth rate and that transport fuel demand is inelastic (Haq-Padda & Akran, 2011; Mubariz, 2015).
3. Methodology
Theoretical and empirical literature reviewed the existing relationship between fuel levy and economic growth. The selected variables for the present study were based on the fact that oil price fluctuations can affect economic growth, because the price of fuel to consumers in South Africa includes a portion that is a fuel levy (Rasche & Tatom, 1977). Looking at the controversial nature of fuel levy to increase tax revenues and decrease consumption and production, the analysis of the impact of fuel levy on economic growth in South Africa was carried out (Finn 2000; Hamilton 2009).
3.1 Specification of the model and data issues
Time series quarterly data covering 1988-2016 was used to achieve the aim of the present study. All the secondary data for the variables were obtained from the South African Reserve Bank. Equation 1 was used to model how the fuel levy influences economic growth.
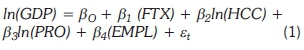
where In GDP is logarithm of GDP at market prices to measure economic growth; FTX is the fuel levy measured by national government tax revenue gained from general fuel levy; ln(HCC) is logged household consumption; InPRO is logged production; EMPL is the employment rate (total employment in non-agricultural sectors); ßois the intercept; ß1, β2,ß3 , β4are the coefficients to be estimated; and stis the error term to capture omitted variable bias and measurement error.
The fuel levy is expected to have a negative relationship on economic growth (Reynolds & Schoor, 2005). Household consumption is expected to have a positive relationship with economic growth. Production is expected to have a positive relationship with economic growth and employment is expected to have a positive relationship with economic growth (Leicester, 2005).
3.2 Estimation techniques
Time series data need to undergo stationarity tests to check if the mean and the variance do not vary systematically over time and avoid the spurious regression problem and biased t-ratios. The Augmented Dickey Fuller and the Philips-Perron tests are used to test for stationarity (Gujarati, 2004; Brooks, 2008). If variables are found from the sta-tionarity tests to be integrated of the same order, the Johansen co-integration test is employed to find if the long-run relationship exists between economic growth and fuel levy (Brooks, 2008). Co-integration exists when the entire components of a vector time series process are non-stationary. In some cases, however, if two or more series have a unit root, but a linear combination of them does not have a unit root, then the series are said to be co-integrated. If a set of variables is found to be co-integrating, then an appropriate estimation technique such as vector error correction model shall be used, which implies that the system will adjust to equilibrium (Sims, 1980). Granger causality is also employed to find out if there are any causal effects and the direction of causality between fuel levy and economic growth (Gujarati, 2004).
General impulse response functions were included to trace out the response of the dependent variable in the vector autoregressive system to shocks to each of the variables. Also, variance decomposition was included to determine if separating the proportions of a change in the dependent variables can be attributed to their 'own' shocks and shocks to other variables. Diagnostic tests were performed to check issues of robustness and stability on the series.
4. Results and discussion
Time series data analysis requires testing for unit root as a start-up point to pave a way to the relevant econometric models such as co-integration and vector error correction model.
4.1 Stationary test results
The Augmented Dickey Fuller and Philips-Perron tests were conducted. These have a null hypothesis of unit root and the calculated values were compared with the critical values at 1%, 5% and 10%. If the calculated value is greater than the critical, the null hypothesis that the series have unit root is rejected, thus substantiating stationary series. All variables were non-stationary in levels and became stationary after first differencing. Non-stationary data needs differencing to restore stationarity (Brooks, 2008).
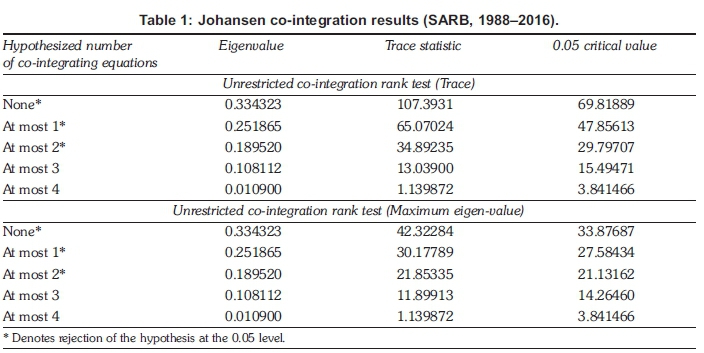
4.2 Johansen co-integration tests
All the variables in the series became stationary after first differencing, implying the first order integration. The confirmation of same-order variable integration allowed the execution of co-integration tests after the determination of the lag length in the series. The optimum lag length selected by most criteria, such as the respective Akaike and Schwarz information criteria, was two (Brooks, 2008). Johansen co-integration has been understood to determine the possibility of a linear combination of the series and that variables have a long-run relationship (Brooks, 2008).
Table 1 presents the Johansen co-integration tests on trace and maximum eigen-value, which indicates that there are three co-integrating equations. This can also be confirmed by instances in Table 1 when trace and maximum eigen-value statistics are greater than the critical value at 5%. The null hypothesis is rejected in all instances where the trace-statistic and maximum-eigenvalue are greater than the 5 % critical value (table 1). Table 1 indicates three co-integrating vectors meaning that there are three long run relations describing the economic growth equilibrium relationship with fuel levy, household consumption, production and employment rate The presence of co-integration implies that the fuel levy can influence the economic growth in the long-run. The existence of a long run relationship in the series contradicts the views of Haq-Padda & Akran (2011) who did not find permanent effects of taxes to the rate of economic growth.
4.3 Vector error correction model results
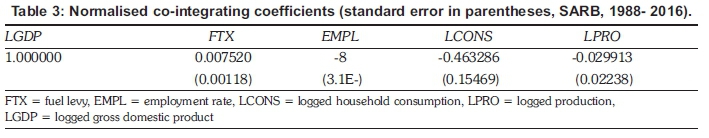
Since economic growth, fuel levy, household consumption, production and employment rate are found to be co-integrated, the vector error correction model (VECM) can be employed to find the speed of adjustment of the series to equilibrium. Table 2 presents VECM results, which need to have a negative coefficient for the series to adjust to equilibrium (Brooks, 2008). It confirms that the error-term of the co-integration equation is negative (0.119021), indicating that the speed of adjustment is about 11.9%, which is significant because t-statistics is 2.7. This means that, if there were a deviation from the equilibrium, only 11.9% is corrected in one month as the variable will be seen to move towards equilibrium when being restored. It can be inferred that, in the error correction model, the economic growth fuel levy nexus model adjusts to long-run shocks, affecting the natural equilibrium. As economic growth, fuel levy, household consumption, production and employment rate were cointe-grated, the co-integrated vectors were normalised by economic growth. This means, to further explain this long-run relationship, the long run co-integrating model is presented by a normalised equation as reported in Table 3.
Table 3 presents results of the normalised co-integration coefficients which can be written according to Equation 2 as follows:
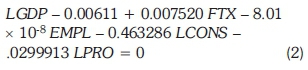
Making LGDP the subject of the formula transforms Equation 2 into Equation 3 as follows:
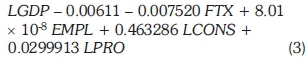
Equation 3 shows that there is a negative relationship between fuel levy and economic growth. A one-unit increase in fuel levy should lead to a decrease in economic growth by 0.007520 units. This is consistent with results in the associated literature (Reynolds & Schoor, 2005; Mabugu et al., 2009). The negative effects are likely to be a source of instability for the macro economy, based on the fact that fuel users might feel the strain on both the consumption and production sides (Finn, 2000; Hamilton, 2009). The present study also found that the negative effects of fuel levy on economic growth are insignificant, as standard error is far less than two (Brooks, 2008). This can also be linked to the finding of Mubariz (2015) that transport fuel demand is price inelastic. Justification for this is that if the cost of fuel increased at the fuel station, which motorists experience as negative effects, this might change driving behaviour. Motorists in South Africa are, however, more likely to change spending patterns on their income by cutting expenditure else-where than changing driving behaviour (Metcalfe & Dolan, 2012). Contrary to the previous study, Berument et al. (2010) found a significant positive relationship between oil demand shocks and economic growth, but a negative relationship on oil supply shocks.
An increase in the fuel levy might lead to households experiencing decreased income, employment and returns to factors used for production. Looking at the production side, firms are affected by fuel prices as their input costs depend on transportation and some petroleum products. Firms, however, shift the production costs to consumers by charging a higher price for the product. The higher priced product would result in decreased wages, increased unemployment and increased prices on goods and services, especially food. Controlled variables in the model indicate a positive relationship of household consumption, employment, production with economic growth and the results conform with a prior expectation.
4.4 Granger causality results
The existence of a long-run relationship in the series found in this study suggest that there must be some causality in at least one direction in the series. It does not, however, indicate the direction of causality between the variables (Odhiambo, 2010). Again, literature is not conclusive about the direction of causality between fuel levy and economic growth (Odhiambo, 2010; Budget Reviews, 2017). For instance, Odhiambo found a unidirectional causal flow from oil prices to economic growth in South Africa. Budget Reviews believed that increasing economic growth is needed to boost tax revenues. Hence, it was found necessary to run Granger causality tests in the present study. Gujarati (2004) suggests that Granger causality explains the direction of causality based on past values of those variable. Table 4 presents the results of Granger causality, and indicates that there is a significant unidirectional relationship between fuel tax and economic growth from economic growth to fuel levy. This means that economic growth can be used to explain changes in a fuel levy and that the country needs a healthy growing economy to boost tax revenues, particularly in the form of a fuel levy. Table 4 also shows that creation of employment needs a growing economy, because of a significant unidirectional Granger causality from economic growth to employment.
4.5 Impulse response functions and variance decomposition results
The impulse response function illustrates the shocks or reactions of economic growth to a one standard deviation of changes on the independent variables (Gujarati, 2004). It further indicates the directions and persistence of the response to each of the shocks to itself and other variables in the series. Figure 1 shows the response of economic growth to itself, and other variables, with economic growth shocks to itself trending upwards. The economic growth shock shows improvement between first period and fourth period (blue line). The orange line refers to a fuel levy which indicates the opposite direction response of fuel tax to economic growth. The other variables are trending in the same direction as economic growth. Variance decomposition indicate that a shock to economic growth will affect it directly, but also the transmission to the other variables can be measured.
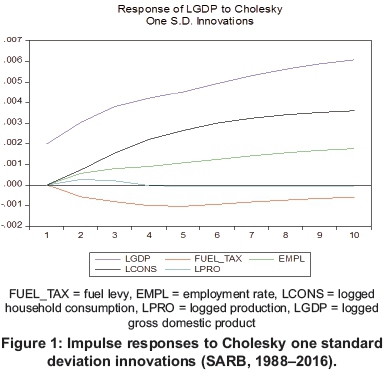
Table 5 presents movements of economic growth shocks and indicates the relative importance of each of the determinants or variables influencing these movements. It illustrates variance decomposition for ten periods and shows how the variables have an effect towards economic growth fluctuations in the short and the long run. The second quarter period of impulse or innovation shock implies that economic growth accounts for 97% of its own shock. The effects of shocks with independent variables, however, are that the fluctuations of GDP are 0.14% for fuel levy, 0.18% for employment, 0.03% for government expenditure, 0.59% for household consumption and 1.83% for production. In the long-run for period 10, economic growth accounts for 84% of fluctuation. This implies that fuel levy in the long-run accounts for 0.69%, employment 0.84%, government expenditure 0.02%, household consumption 11.1%, and production 3.13% of fluctuations to economic growth. This can be summarised as: throughout the whole period, economic growth is influenced mainly by its own shocks in the short-run and in the long-run, implying a little effect that can be attributed to fuel levy. Hence, a policy to increase fuel levy would not attract attention to consumers, as indicated by small percentages of fuel levy shocks to economic growth. This is in line with Mubariz (2015), who found an inelastic transport fuel demand and suggested the use of fuel tax as a tool for raising budget revenues.
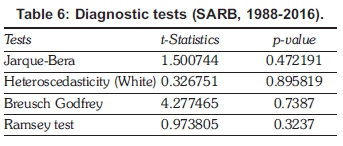
4.6 Diagnostic tests
In order to discover if the estimated model of the relationship between economic growth and fuel levy is correctly specified and adheres to the assumptions of the classic regression linear model, diagnostic tests have been conducted (Gujarati, 2004). Diagnostic tests conducted assess if the model is normally distributed, no heteroscedasticity and no serial correlation. Table 6 presents results of diagnostic tests run for the economic growth fuel levy nexus. The Jarque-Bera test has a p-value of 0.47 confirming that the error terms are normally distributed. The model was also tested for serial correlation, thus the Breusch Godfrey test with p-value of 0.74 shows no reflection of serial correlation within the model. The heteroscedasticity test (White test) with p-value of 0.89 indicated no het-eroscedasticity. The Ramsey test confirms that the linear functional form of the model is appropriate. These diagnostic tests result illustrate that the results of the estimated model of the economic growth-fuel levy nexus is a well-specified model.
5. Conclusions
The study examined the impact of a fuel levy on economic growth in South Africa, using secondary quarterly data from 1988 to 2016. A time series model which determined the impact of fuel levy on economic growth was specified and included controlled variables such as household expenditure, employment and production. The Johansen co-integration confirmed that a fuel levy can affect economic growth, especially in the long-run. The results also showed that there is a negative relationship between economic growth and a fuel levy. These results, however, showed a weak relationship between the two, as the coefficients of a fuel levy were small and insignificant. The vector error correction model showed that it will take about 11.9% speed for the series to adjust to short-run equilibrium. Granger causality showed that a unidirectional relationship exists from economic growth to fuel levy. The conclusion is that, over the long term, high levels of economic growth are required to boost tax revenues and public expenditure. Consequently, robust revenue collection depends on strong economic growth and effective tax administration. A growth-oriented tax system should minimise distortions created by the tax system and create incentives for drivers of economic growth.
The implications of the results of the present study include obligations by government to: 1) regulate the automobile industry by designing efficient vehicles that suppress pollution and to produce models that reduce dependency on oil markets; 2) accommodate the fuel levy in the intergovernmental fiscal system and adopt a system of collecting this tax specifically for a certain project - not for general increase in revenues; and 3) develop policies targeted at educating the citizens about taxation.
References
Bernanke, B. 1983. Non-monetary effects of financial crisis in the propagation of the great depression. The American Economic Review 73(3): 257-276. [ Links ]
Berument, H., Ceylon, N. and Dogan, C. 2010. The impact of oil price shocks on the economic growth of the selected MENA countries. Energy Journal 31(1): 149-176. [ Links ]
Black, A. and Bhanisi, S. 2001. Globalisation, Imports and local content in the South African automotive industry. Development Policy Research Unit, University of Cape Town. Cape Town. [ Links ]
Brooks, C. 2008. Introductory econometrics for finance. Cambridge University Press. New York. [ Links ]
Budget Speech. 2015. Pretoria, South Africa Available at: https://www.treasury.gov.za/documents/nationalbudget/2015/speech/speech.pdf. [ Links ]
Budget Speech. 2016. Pretoria, South Africa. [ Links ]
Budget Review. 2017. National Treasury Republic of South Africa. Pretoria. [ Links ]
Budget Speech. 2018. Pretoria, South Africa. [ Links ]
Cheung, K. and Thomson E. 2004. The demand for gasoline in China: A cointegration analysis. Journal of Applied Statistics 31: 533-544. [ Links ]
Ehigiamusoe, K. 2014. The nexus between tax structure and economic growth in Nigeria: A prognosis. Journal of Economic and Social Studies 4(1): 113-138. [ Links ]
Finn, M. 2000. Perfect competition and the effects of energy price increases on economic activity: Journal of Money Credit and Banking. 32(3): 400-416. [ Links ]
Glenday, G. 2008. South African tax performance: some perspectives and international comparison. National treasury of South Africa. https://www.dukespace.lib.duke.edu. [ Links ]
Global Economic Outlook. 2018. https://www.confer-ence-board.org/data/globeoutlook/ [ Links ]
Golombek, R., Greaker, M., Kittelson, S., Rogerber, O. and Aune F 2011. Carbon capture and storage tech-nologies in the European power market. Energy Journal 32(1): 582-588. [ Links ]
Gordhan, P. 2012. Budget speech. Pretoria, South Africa. [ Links ]
Gujarati, D. 2004. Basic econometrics. McGraw Hill, New York. [ Links ]
Haq-Padda, I and Akran N. 2011. Synthesis of fiscal and monetary policies in price level determination: Evidence from Pakistan. Pakistan Journal of Applied Economics 21: 37-52. [ Links ]
Jibrin, S. M, Blessing, S. E. and Ifurueze, M. S. K. 2012. Impact of petroleum profit tax on economic development of Nigeria, British Journal of Economies, Finance and Management 5(2): 60-70. [ Links ]
Hamilton, J. 2009. Causes and consequences of the oil shock of 2007-08. Brookings Papers on Economic Activity Spring 2009, 215-261. [ Links ]
Wicksell, K. 1958. A new principle of just taxation. In Classics in the theory of public finance, ed Richard A. Musgrave and Alan T. Peacock. London: Macmillan: 72-118. [ Links ]
Kurz, H. and Salvadori, N. 2003. Theories of economic growth - old and new. Cheltenham. [ Links ]
Leicester, A. 2005. Fuel taxation. Institute for fiscal studies, Briefing note 55 www.ifs.org.uk/bns/bn55.pdf. [ Links ]
Mabugu, R., Chitaga, M. and Amusa, H. 2009. The economic consequences of fuel levy reform in South Africa. South African Journal of Economic and Management Sciences 12(3): 280-296. [ Links ]
Maia, J. and Hanival S. 2013. An Overview of the Performance of the South African Economy since 1994. Presidency of South Africa. Pretoria. [ Links ]
Manuel, T. 2002. The South African tax reform experience since 1994. In: Annual Conference of the International Bar Association. [Online] www.trea-sury.gov.za/comm_media/speeches/2002/2002102501.pdf. [Accessed on 10/08 2015] [ Links ]
Metcalfe, R. and Dolan, P. 2012. Behavioural economics and its implications for transport. Journal of Transport Geography 24 503-511. [ Links ]
Mubariz, H. 2015. The demand for transport fuel in Turkey. Energy Economics 51: 125-134. [ Links ]
Ncube, M., Shimeles, A. and Verdier-Chouchene, A. 2012. South Africa's Quest for Inclusive Development. Working paper no 50, African Development Bank, Tunisia. [ Links ]
Newbery, D. 2005.Why tax energy? Towards a more rational policy. Energy Journal, 26 (3): 1-39. http://www.jstor.org/stable/41319496 [ Links ]
Odhiambo, N. 2009. Energy consumption and economic growth nexus in Tanzania: An ARDL bounds testing approach. Energy Policy 37: 617- 622. [ Links ]
Odhiambo. M. N. 2010. Oil prices and economic growth in South Africa: an ARDL testing approach. Energy Policy 38: 2463-2469. [ Links ]
Polemis, M. 2007. Modelling industrial energy demand in Greece using cointergration techniques. Energy Policy 35: 4039-4050. [ Links ]
Rasche, R. and Tatom, J. 1977. The effects of the new energy regime on economic capacity, prodction and prices. Federal Reserve Bank of Louis Review 59(4): 2-12. [ Links ]
Reynolds, S. and Van Schoor, M. 2005. The impact of a higher fuel levy on the Western Cape. Working paper 2005:4, Elsenberg. [online] www.elsenburg.com/provide [Accessed on 15/07/ 2015] [ Links ]
Salmons, R. 2011. Road transport fuel prices, demand and tax revenues: impact of fuel duty escalator and price stabiliser. Policy Studies Institute. [ Links ]
Sims, C. 1980. Macroeconomics and reality. Econometrica. 48(1), 1-48. [ Links ]
StatsSA. 2017. Pretoria Government Printers. Pretoria. [ Links ]
Sun, Z., Hong, J. and Xu, X. 2013. Price effect of domestic oil tax under vertically related market structure: evidence from the United States, EU and Japan. Opec Energy Review, 37(1), 81-104. [ Links ]
Willenbockel, D. and Hoa H 2011. Fossil fuel prices and taxes: Effects on economic development and income distribution in Viet Nam (Package 2 Report for UNDP Viet Nam). Hanoi Central Institute for Economic Management. Hanoi. [ Links ]
* Corresponding author: Tel: +27 152684322; email: Thobeka.ncanywa@ul.ac.za

