


Serviços Personalizados
Artigo
 Inglês (pdf)
 Artigo em XML
 Referências do artigo
Indicadores

Links relacionados
-
 Citado por Google
 -
 Similares em Google
Compartilhar

 Permalink
Journal of Energy in Southern Africa
versão On-line ISSN 2413-3051
versão impressa ISSN 1021-447X
J. energy South. Afr. vol.29 no.1 Cape Town Fev. 2018
http://dx.doi.org/10.17159/2413-3051/2018/v29i1a3437
ARTICLES
Tracking decarbonisation in the mining sector
H. ImminkI, II, *, R.T. LouwII; A.C. BrentI, III
IDepartment of Industrial Engineering, and the Centre for Renewable and Sustainable Energy Studies, Stellenbosch University, Private Bag X1, Matieland, 7602, South Africa
IIPromethium Carbon, Lacey Oak House, Bally Oaks Office Park, 35 Ballyclare Drive, Bryanston, Johannesburg, 2021, South Africa
IIISustainable Energy Studies, School of Engineering and Computer Science, Victoria University of Wellington, PO Box 600, Wellington, 6140, New Zealand
ABSTRACT
Greenhouse gas (GHG) emissions increase as mining companies transport ore over increased distances in opencast operations or extract ore from deeper levels in underground operations. The rising costs of energy sources and enhanced awareness of the impacts of GHG emissions support energy- and emission-reduction initiatives. This paper evaluates the metrics used in GHG emissions projections and target-setting over a ten-year period from 2005, linked to the South African Energy Efficiency Accord. The GHG inventories of a gold- and iron ore-mining company, together with the implemented energy saving projects, were analysed to evaluate progress against targets. A broad target value, defined as a percentage reduction of GHG emissions over time, was found to be problematic in monitoring performance over time. A direct link between emissions and output metrics was not found, due to external factors, such as the impact of changes in the grid emission factor, acquisitions and divestments, and internal factors, including changes in ore grade or mining depth. Using a metric linked to the activity within the operations, such as total tonnes mined, is, therefore, more appropriate for mining companies than production output. A methodological tool, using both the inventory and the savings from implemented mitigation initiatives, is proposed to improve GHG emissions projections, establishing a counterfactual baseline, and to support target setting. Decarbonisation of the mining industry would require careful review of the metrics to project and set GHG reduction targets.
HIGHLIGHTS:
• Decarbonisation metrics of the mining sector should be reviewed.
• Learn from 2005 targets, for setting credible new targets.
• Emission reductions should be reported, together with GHG inventory.
• Best metrics use mining activity, and not mining output.
Keywords: greenhouse gas reporting; gold mining; iron ore mining; emissions forecasting; target setting; climate change mitigation.
1. Introduction
The global decarbonisation trajectory formed the basis of the Paris Agreement, leading to country-specific greenhouse gas (GHG) emission projections and therefore economic sector growth scenarios becoming more prominent (Okereke and Coventry, 2016). In countries such as China the carbon-intensity of the energy supply depends on macroeconomic policy decisions and direction between now and 2030. However, the carbon intensity of energy supply is also a determining factor for the emission scenario of the basic industrial production sector, including mining and materials production (Grubb et al., 2015) . Especially in highly polluting industries, such as mining, energy and manufacturing, there is an increased focus on comparing the disclosure of performance against environmental performance improvement itself (Aragon-Correa et al., 2016) and the subsequent impact on corporate value (Saka and Oshika, 2014). The increased demand for carbon accounting required new methods and approaches within the traditional sustainability management systems (Schaltegger and Csutora, 2012). Best practice sector policy has to clearly quantify expected emission reductions and targets, and assist in capacity-building for policy makers and implementers (Casado-Asensio and Steurer, 2015)
The mining sector is an energy-intensive sector that is a key contributor to most developing country economies, both in terms of employment and gross domestic product (GDP). In South Africa in 2015 the direct contribution of the mining sector to GDP increased to 7.7%, with annual energy consumption decreasing from 31 825 GWh in 2005 to 30 720 GWh (Chamber of Mines, 2016). In addition, the mining sector still provides around half a million direct job opportunities (Statistics South Africa, 2017), making it a vital part of the South African economy. Decarbonisation policies should, therefore, be designed with care so as to protect the competitiveness of the mining industry, through the envisaged transition to a lower carbon and climate resilient economy (Winkler et al., 2010).
With mining being both energy- and trade-intensive, it is essential that disclosure and policies should be carefully developed to maintain the competitiveness of the country (Winkler et al., 2010). From the Paris climate change meeting in 2015, there emerged an agreement to reduce GHG emissions globally, but there is no internationally binding guidance on which policy measures should be used to achieve decarbonisation. Each country can develop its own approach for one or more sectors, consistent with their respective development priorities.
Mining investments are long-term investments. Mines that were designed twenty years ago seldom have optimal operations or efficient infrastructure today. In South Africa, however, the mining industry has actively reduced its energy consumption significantly since 2010 in response to the rising cost of energy. The energy consumption of a mine is linked to the fixed energy-consuming infrastructure that forms part of the mine design and most mines require large absolute volumes of energy. There are also, however, significant emissions-saving opportunities available in this sector, either through reducing energy demand or implementing energy efficiency initiatives (Inglesi-Lotz and Pouris, 2012).
Mining is highly energy-intensive, both in the initial development stage and throughout the life of a mine. Within opencast mining operations, liquid fuel, mainly diesel, is the primary energy carrier. In South Africa's underground mines, grid electricity is the primary energy carrier, not only for production and ore transport, but also for critical safety applications, such as ventilation, cooling, pumping water, and hoisting personnel. The decarbonisation of the mining sector in South Africa is therefore closely linked to the energy consumption patterns and energy targets of the mining companies. The impact of energy reduction initiatives on the energy consumption patterns and the GHG inventories are, however, not always clear.
The objective of this study was to examine the indicators for the projection of GHG emissions in South Africa's mining sector and evaluate progress against publicly announced GHG targets. Exploring new methods for emission projections and GHG target-setting is important in supporting the development of effective decarbonisation policies. The disclosure of emissions and mitigation actions over a ten-year period were analysed and compared with the targets and agreements that were made publicly in 2005. Evaluating the metrics to track progress, as well as the internal and external factors that affected the projection, supports the need for an ex-post tool that combines the annual GHG inventory with the implemented mitigation actions to construct a counterfactual baseline.
2. Disclosure of GHG emissions and mitigation actions
The GHG emissions associated with the use of the two energy carriers, liquid fuel and grid electricity, are accounted for differently. The combustion of liquid fuel is accounted as direct emissions from the mining facility. The emissions of grid electricity occur at the generation facilities, outside the organisational boundaries of the mining facility, and are therefore accounted for as indirect emissions (WBCSD/WRI, 2004). The use of publicly disclosed GHG emissions data, especially from the mining sector, is sound, a view supported by the work of Rankin et al. (2011), which concluded that companies that disclose credible information are more likely to be large companies in the energy, mining, industrial, or services sectors. Although their research focused on Australian sectors, the principles are the same for similar companies worldwide, as it is linked to the existence of an internal environmental management system, and adherence to voluntary reporting guidance such as Global Reporting Initiative (GRI) or Carbon Disclosure Project (CDP) (Rankin et al., 2011). These companies are also more likely to develop GHG mitigation projects and calculate baseline GHG emissions in order to apply for carbon credits, which may be traded in the various carbon markets. Quantification of mitigation initiatives is essential to evaluate the overall rate of decarbonisation ( Roelfsema et al., 2015; Graichen et al., 2016) under voluntary initiatives, but is often not done or reported. It is estimated that 0.28 tCÜ2-equivalent per capita would be linked to energy-intensive products such as iron and steel by 2050; therefore managing the metrics and tracking progress of targets will be required (Denis-Ryan et al., 2016)
3. Approach to evaluating GHG emissions, emission targets and emission projections
The metrics and publicly available data used in managing GHG inventories for an underground mining company, Gold Fields Ltd/Sibanye Gold Ltd, and an opencast mining company, Kumba Iron Ore Ltd, are analysed. Both companies signed the South African Energy Efficiency Accord in 2005. Under this Accord, they committed to a reduction target of 15% below the baseline by 2015, while government committed to creating an enabling environment for energy-efficiency improvements (Department of Minerals and Energy, 2005). There was, however, limited guidance or requirements on the baseline in this Accord, as it referred to a percentage reduction against the fixed projected national energy use from the country's Energy Efficiency Strategy, issued in March 2005 (Department of Minerals and Energy, 2005). Companies and sectors had different interpretations on a sectoral breakdown or allocation, and none of the signatories had to make their baseline projections public. The indicators for tracking progress on creating an enabling environment is not assessed or further addressed in this paper. Both companies also participated in the Carbon Disclosure Project, disclosing annual GHG inventories and reporting on mitigation actions implemented during the financial year.
An annual GHG inventory is the first step to managing GHG emissions in a company. In South Africa, the GHG Protocol Corporate Accounting and Reporting Standard (WBCSD/WRI, 2004) for companies and organizations is widely used. The inventory is updated annually, but the reasons for changes from one year to the other are not recorded in the inventory itself, so the reasons for the increase or decrease of emissions, or the policies and actions that caused the change in GHG emissions, is seldom recorded. The GHG Protocol has therefore developed an accounting and reporting standard for estimating the GHG effects of policies and actions (WBCSD/WRI, 2014). The Protocol is a partnership of businesses, governments, academic institutions, and others, convened by the World Resources Institute (WRI) and the World Business Council for Sustainable Development (WBCSD). This policy and action standard was developed in 2013 through a global multi-stakeholder process, and the analyses presented in this paper were initiated as a pilot project to test and verify sections of the standard.
The methodology as set out in the WRI Policy and Action Standard (WBCSD/WRI, 2014) was followed for an analysis of the impact of energy reduction initiatives in the mining sector in South Africa. The terminology, however, was changed to reflect the definitions used in the mining sector and not all the steps of the standard are explicitly mentioned. The Policy and Action Standard provides guidance to evaluate GHG performance. The starting point, according to the guideline, is the choice of a historical base year. Selecting a historical base year would either be a default year, such as 1990 if linked to the Kyoto Protocol, or 2000 if linked to the South African GHG inventory (Department of Environmental Affairs, 2013). Alternatively, the base year would be the first year for which reliable data is available. Although the Energy Efficiency Accord suggested 2000 as the base year, information is only available from the date of becoming a signatory, so in this study the 2005/2006 financial year is taken as the base year for the analyses of the mining companies.
In accordance with the Policy and Action Standard, after selecting a base year, the published GHG emissions and intensity factors are evaluated. For this paper, only publicly available emissions and intensity factors were used. The top 100 companies listed on the Johannesburg Stock Exchange have been voluntarily participating in the Carbon Disclosure Project since 2007. As part of this initiative, the GHG emissions inventories of these companies are publicly available, usually verified, and either published in standalone reports or consolidated in the company annual reports. These GHG emissions inventories include, as a minimum, both direct (Scope 1) and energy-indirect (Scope 2) emissions. Company-specific performance metrics are also reported in annual reports. The two metric types typically used are based either on operations, such as tonnes milled or mined, or on production volumes, such as ounces of gold or tonnes of iron ore. Projections are done in any metric used in-house by a company unless the voluntary agreements or targets prescribes a metric. Prescribing metrics would ease benchmarking and assists in tracking progress over time, but the Policy and Action Standard does not provide guidance on choosing the most appropriate metrics, or evaluate alternatives for policy projections. According to the Canadian Round Table on the Environment (National Round Table on the Environment and the Economy, 2008), the four main criteria for evaluating the best forecasting alternatives are past accuracy, sound representation of the current system, enough transparency to review the underlying assumptions, and the ability to conduct sensitivity analysis. The approach taken in this paper is to follow the steps as set out by the WRI standard and evaluate the outcomes against the four forecasting criteria for each case study.
To determine the change in GHG emissions resulting from a given action, a reference case should be established, which represents ex-ante conditions that would most likely occur in the absence of mitigation actions. This is referred to as the projected baseline. A counterfactual baseline can be constructed ex-post against which the impact of GHG mitigation actions can be calculated. The disclosure of mitigation actions and targets has changed over time as the Carbon Disclosure Project changed the questionnaire every year. Only the disclosure of the GHG inventory remained consistent over time, allowing for comparisons over time.
4. Results from GHG target-setting in a gold-mining context
Gold Fields Ltd is an unhedged, globally diversified producer of gold, with eight operating mines in Australia, Ghana, Peru and South Africa (GoldFields, 2015). In 2013, Gold Fields unbundled its mature, underground Kloof-Driefontein Complex and Beatrix mines in South Africa into an independent and separately listed company, Sibanye Gold (SibanyeGold, 2015). The relevant output metric for a gold mine is either tonnes milled, or gold produced. These two metrics are used to report the operational performance of the company and are used to analyse the historical GHG emissions for projections and performance against the set target. In the 2005 base year, Gold Fields milled 15 530 000 tonnes of ore and reported direct and energy indirect GHG emissions of 4 952 930 tCO2-equivalent, while producing 2 824 000 ounces of gold. A projection of the production was constructed in this article on the detailed growth statement in the 2005 Annual Report. The portfolio of the South African operations in Gold Fields was projected to remain the same during the 2005-2015 period, with new acquisitions envisioned outside South Africa. Therefore a stable production rate for the South African Gold Fields operations was assumed to extend up to the target date of 2015. The available ore grades are variable but declining in the South African operations. Ore grades impact directly on the energy intensity of the operations and, therefore, an average of 5% per year as a fixed decline is used internally in Gold Fields Ltd for planning and design purposes. Such a fixed decline against a stable output would require an increase in tonnes milled of 5% per year. The GHG inventory is calculated annually through multiplying activity data with approriate emission factors. Consumption records are used as a proxy for activity data. The consumption can be linked to either direct fossil fuel use, such as diesel, or indirect fossil fuel use, such as grid electricity in South Africa. The GHG inventory is published together with a list of the emission saving projects implemented. The progress against the target was assessed using data published between 2005 and 2015. The documented emission savings from mitigation projects implemented during this period was added to the emissions from the annual GHG inventory to estimate what the emissions would have been if these mitigation projects were not implemented, thus providing a counterfactual baseline. This counterfactual baseline was constructed ex-post. Although records exist of the emission mitigation activities implemented at the various Gold Fields facilities, the emphasis on recording and reporting savings was not a high priority during this period. The GHG emission savings from smaller or dispersed projects are not reported, consolidated or verified.
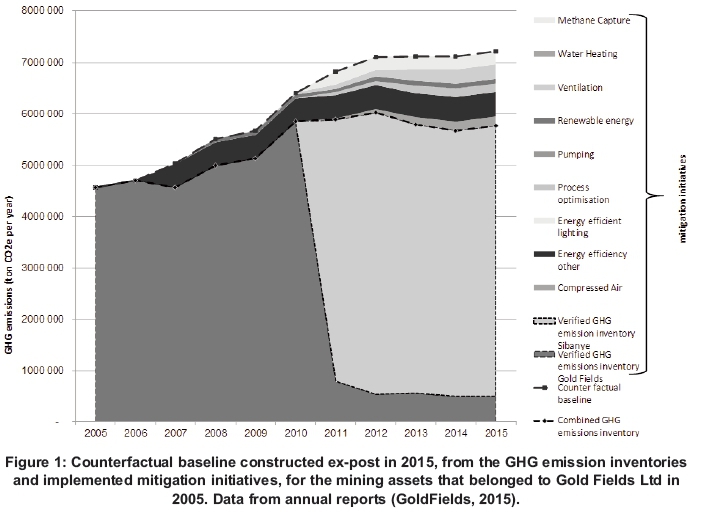
Due to a split of the Gold Fields Ltd assets in 2012, with only the South Deep Gold Mine remaining in its portfolio, the comparison of projected emissions versus subsequent emission inventories had to be extended. As mentioned above, Gold Fields created Sibanye Gold as part of the unbundling, as owner of the remainder of the South African operations. Sibanye Gold is also a listed entity and participant in the Carbon Disclosure Project. In accordance with the ISO 14064-1 standard on GHG accounting 'an organisation shall develop, apply and document a base-year recalculation procedure to account for ... the ownership and control of GHG sources or sinks transferred into or out of organisational boundaries...' (International Organization for Standardization, 2006). Emission reductions initiatives were undertaken and publicly reported for both entities. Figure 1 shows the recalculated inventories, combined with the respective mitigation activities. After the portfolio split, the actual emission inventory of Gold Fields reduced by more than 90%, with most of the emissions and emission reduction activities under the ownership and control of Sibanye Gold.
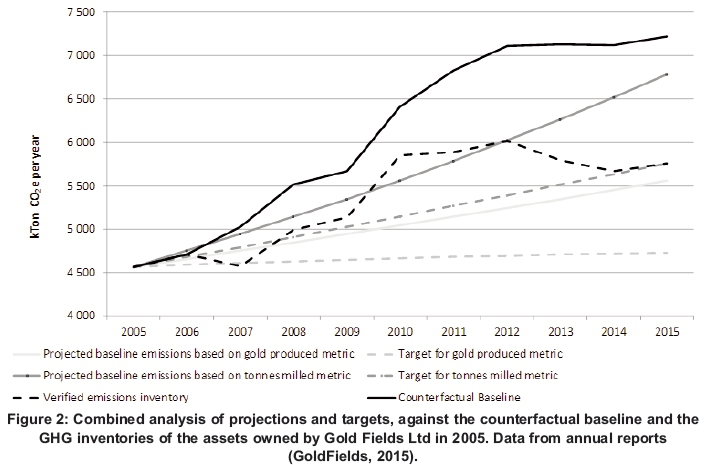
Not all emission reduction initiatives are permanent. The energy-efficiency initiatives implemented in the head office have only been included for the period that Gold Fields occupied that building. The process and energy-efficiency projects at the mines were deemed permanent and therefore accumulated emission reductions every year after implementation. While the emission factor for any liquid fuel saving did not change over the period, the emmis-sion factor for electricity is updated annually, within the company, before the calculation and reporting of emission reductions. The overall GHG emission savings of the original portfolio of mining assets that formed part of the group in 2005 is estimated to be 15.3% below the counterfactual baseline, based on the reported savings. The overall progress towards the emission target was thus achieved through mitigation projects that were implemented in the facilities that did not remain under Gold Fields's control over the period of the Energy Efficiency Accord. The verified emissions of the combined set of mining assets are lower than any of the baseline projections. This reduction of emissions is due not to increased mitigation activities but to external and internal factors. The three main factors that impacted both metrics and projections are an increase in the grid emission factor, a decrease in ore grade and mining depth, and a decline in production. The gold produced was 65% less than projected, while the volume of ore milled was 22% less, resulting in significantly fewer emissions than projected, as shown in Figure 2.
5. Results from GHG target-setting in an iron ore-mining context
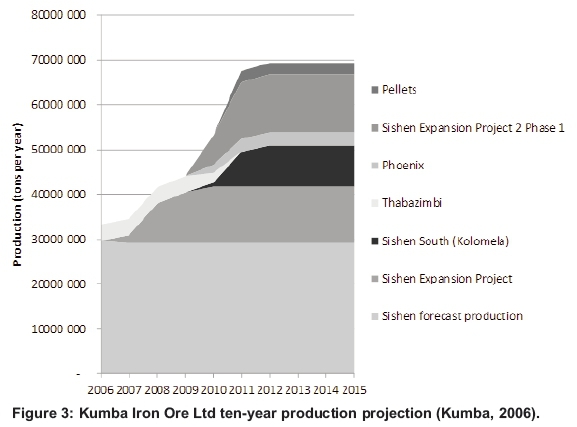
Kumba Iron Ore Ltd (see www.angloamericankum-ba.com) is a value-adding supplier of high quality iron ore to the global steel industry. It is the fifth-largest supplier of seaborne iron ore in the world, exporting more than 37 million tonnes per annum and providing more than 4 million tonnes to the local market (Kumba, 2010). The company has three mining operations in South Africa, namely Sishen Mine, Thabazimbi Mine, and Kolomela Mine. Both Sishen and Kolomela are long-life operations with current life of mine estimates of 18 and 29 years respectively. Thabazimbi Mine is nearing the end of its life, but Kumba has already undertaken a feasibility study on the Phoenix Project, adjacent to Thabazimbi, as a possible replacement. In 2006, Kumba published a growth strategy with an overall production projection of 70 million tonnes per annum in 2015, linked to the implementation of specific projects and mining assets (Kumba, 2006). See Figure 3 for the planned production projections.
Kumba signed the Energy Efficiency Accord in 2006 and has been participating in the Carbon Disclosure Project since 2011. The verified GHG inventory and information on mitigation projects implemented are available in the public domain. At Kumba, the metric for output is defined as either an amount of iron ore product (tonnes produced) or the amount of material mined to deliver the product (tonnes mined). The GHG emissions are directly linked to the energy required to move the volume of rock, and this changes in the different phases of the life of a mine. In the development phase, large volumes of rock are moved with little production output. As the mine reaches the end of life, the lower ore grade and increased distance from the pit to the processing plant become more significant factors in energy consumption. Based on the production forecast for the period 2006 to 2015, and the energy intensity of the mine in 2005, the GHG projection for both metrics can be calculated. The target as per the Accord is a 15% reduction below a business-as-usual baseline by 2015.
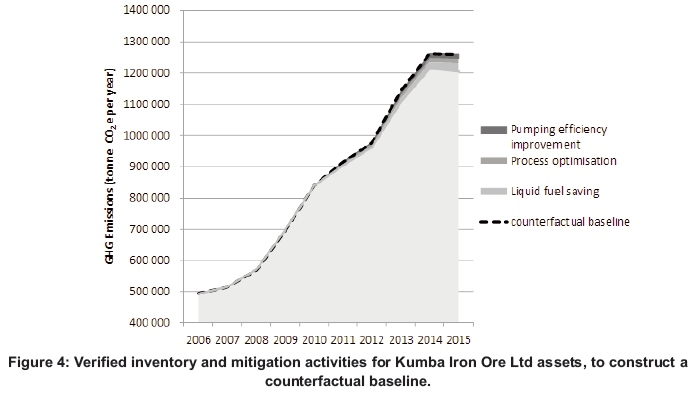
A number of mitigation projects were implemented over the period, while not all the growth projects were implemented, due to a severe decline in the international market for commodities. This decline constrained the capital available to develop and grow the operations. Therefore, the baseline projections were too high. For the mitigation projects that were verified and reported publicly, it is assumed that the emission reduction benefits are permanent. This assumption would be good for technology-based energy-efficiency projects and process-optimisation initiatives. Diesel-saving projects linked to behaviour changes are reversible, as the drivers change and attention is diverted from the diesel-reduction initiative. Kumba has, however, implemented an automated diesel energy-efficiency management system and the continued saving is managed on a monthly basis. These values were therefore cumulatively added to calculate the impact of the overall emission reduction projects implemented between 2006 and 2015. The GHG inventory, the area at the bottom of the graph in Figure 4 is the verified GHG inventory, independent of any mitigation initiatives. The GHG inventory is annually calculated with appropriate emission factors. Grid electricity is consumed and the grid emission factor is annually calculated. There were three main mitigation initiatives during this period. The emission reductions achieved through the liquid fuel-saving and process-optimisation were orders of magnitude larger than the water-pumping efficiency project. No new mines were acquired, and no mine was sold during the 20062015 period. Due to reduced demand, the expansion and growth projects were put on hold.
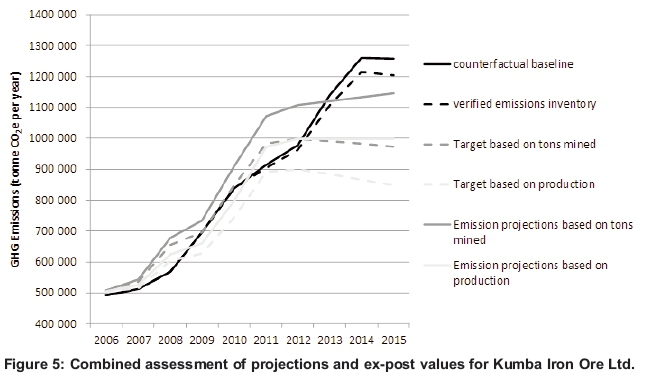
Although the mining portfolio stayed the same and the iron ore production remained stable, the tonnes of ore mined increased significantly. Iron ore production was below the projected value, while the tonnes mined increased significantly. In mining operations, the stripping or strip ratio refers to the ratio of the volume of overburden (waste material) required to be handled in order to extract some volume of ore. The handling of material, waste material with or without ore requires the consumption of diesel and results in combustion-related GHG emissions. For example, a 3:1 stripping ratio means that mining one cubic metre of ore will require mining three cubic metres of waste rock (Hartman, 1992). The Kumba stripping ratio varied between the three different mines, with an average over the decade of 5:1. An increased stripping ratio will increase the GHG emission intensity of the mine and its products. Sishen Mine exceeded a 20:1 ratio for four years in succession; therefore the verified emissions inventory are higher than the projected emissions based on either the tons mined or the production, despite the expansion projects which were put on hold (see Figure 5). Figure 4 shows the verified inventory and the impact of the implemented mitigation initiatives, and Figure 5 compares these expost values, against the various projections that were done ex-ante. The overall savings of the original portfolio of mining assets is estimated to be 8% below the counterfactual baseline, based on the reported savings from all three Kumba mines, as shown in Figure 5.
6. Discussion
The results highlight the uncertainties in projecting GHG emissions from the mining industry. Using the current approach to GHG emissions projections in setting GHG targets is difficult, and the planning or management to reach these targets have a limited chance of success. The form of the target is important, as reduction against a projected baseline is uncertain, due to the range of factors influencing the verified annual emission inventories. The verified emissions could reflect the effect of the implemented mitigation initiatives, or changes such as economic activity data or default emission factor that were not assumed in the projections.
External changes, such as the grid emission factor (GEF), impact on the GHG emissions of a company. An evaluation of the methodology behind the calculation of the GEF in South Africa during the same period, but using data covering three years (2007/8, 2008/9 and 2009/10), showed significantly different approaches and results (Spalding-Fecher, 2011). According to Spalding-Fecher, a reasonable marginal GEF for these three years would have been 0.874, 0.905, and 0.909. These values are in line with the values that Gold Fields used in its published GHG emissions data. The Kumba projection was done on the assumption that the GEF would either remain the same or not impact the overall results significantly. Other studies did, however, caution on using an average CO2 equivalent intensity of the national grid, in favour of determining the GHG intensity of the future power mix, to avoid over- or under-estimation of GHG emission savings when projecting emission reductions against a baseline (Harmsen and Graus, 2013).
With the composition of liquid fuel being regulated in South Africa, the emission factor for fuel remains constant and does not effect the GHG calculation for Kumba. Reducing the GHG emissions associated with the combustion of liquid fuel would, therefore, require either an efficiency improvement or a move towards biodiesel with a lower emission factor.
The life stage of the mine impacts on the stripping ratio and should be carefully factored in when setting targets. The high GHG emissions associated with initial development negatively affects the GHG inventory of these mines during the early years. As the mine reaches its end of life stage, the ore grade and increased distance from the pit to the processing plant result in increased energy consumption and associated GHG emissions. Within a voluntary commitment scenario, transparency on the GHG emissions from the life-cycle stage of the mines in a mining portfolio would be sufficient. However, in a mandatory reporting system, a form of capitalisation of the emissions might be required to spread the emissions over the life of the facility.
The extended labour unrests and strikes in the South African mining sector in 2013 had little impact on the sector's GHG emissions trajectory. Although production volumes were affected, the fixed underground infrastructure is a design feature and requires energy independent of operational stoppages. Opencast facilities can scale-down the dewatering of the pit and reduce the onsite material transport during such operational stoppages.
For both Kumba and Gold Fields, the metric that is best suited for approximating the actual GHG emissions is the operational metric of tonnes of ore milled or tonnes of ore mined. The production metric, which is easier to track from the annual reports for these mining companies, was not a useful metric for projections, and would therefore not be appropriate for setting GHG emission targets.
The current practices of using reported production metrics for GHG target-setting hampers the decarbonisation transition, as GHG emissions are not directly related to the production values, Both the GHG inventory and the mitigation activities are required to assess the decarbonisation of a company. The ex-post methodology to create an counter-factual GHG baseline, using two existing data sets to derive the benchmark or distance from a target, has been effective in evaluating the progress against targets in the mining sector. The first set of data is the verified emissions inventory of the facility or company, the second is the absolute emission reductions achieved from the implemented mitigation activities. The counterfactual baseline is the sum of the GHG emissions and the achieved emission reductions over the target period. This baseline is ex-post determined and would represent the theoretical emission trajectory for a company if the emission reduction activities were not implemented. The counterfactual baseline approach meets the criteria of:
• past accuracy, being able to track the progress against emission targets in the respective mining companies;
• sound representation of the current system, based on actual updated annual GHG inventories;
• transparency, as it is possible to see the underlying mitigation activities that resulted in the decrease of emissions; and
• the ability to conduct sensitivity analyses, of which the changes in the grid emission factor are the biggest contributor for energy-intensive mining companies.
It is likely that long-term commitments could be made under either a future mandatory regime, such as the proposed South African carbon budget system, requiring an absolute mitigation, or another voluntary regime, such as Article 6 of the Paris Agreement. Participating companies making such commitments should take care in defining the metrics of measuring progress and ensure compliance is drafted as part of mergers or divestments. In addition, a new GHG baseline and target value should be calculated, linked to the revised emission sources of the new entities following such mergers or divestments.
7. Conclusions
The present study showed that tracking progress of GHG emissions against a projected baseline target in the mining sector is complex. A decade after signing a voluntary accord to reduce GHG emissions by 15%, data is available in the public domain to carry out the tracking of GHG emisisons analysis for signatories to this accord. The analysis can be complicated, however, as the companies do not necessarily own all the emission sources, site-specific mines and facilities that formed part of the company when the accord was signed, and some of the intended projects have not been implemented. The accord was dissolved in 2013. But the results are useful to test to the metrics and methodology for future target setting.
Of the two companies evaluated, it seems that the facilities owned by Gold Fields Ltd in 2005, have achieved the commitment made to the Energy Efficiency Accord, based on lower actual GHG emissions than those that were projected initially. Reductions seen in the combined Gold Fields and Sibanye Gold mining portfolios were found to be due not only to mitigation efforts but also linked to annual changes in the grid emission factor. Based on the information in the public domain and due to the large stripping ratio for the mines during the commitment period, Kumba Iron Ore Ltd did not meet the commitment. The published emission reduction activities implemented in both companies are, however, likely to be understated, and therefore the performances against the targets might have been better than currently represented.
A metric such as output production is only a single indicator of a mine's performance and is affected by numerous other factors; consequently it is less appropriate for projecting GHG emissions or setting targets. Using a metric linked to the activity within the operations, such as total tonnes milled or mined is more appropriate than using a metric of production output in projecting GHG emissions.
The implication of the present study is that the ex-post model to calculate a counterfactual baseline is attractive for tracking progress against targets set historically. The indicators used in the ex-post tracking model could also be used in formulating new GHG targets. The GHG inventory, together with emission reductions achieved through implemented mitigation initiatives, provides a realistic picture of decarbonisation achieved independently of a large number of operational and GHG accounting factors that can also influence the emissions of a mine. This model can support the decarbonisation of this GHG-intensive sector, through the monitoring of actual progress towards the decarbonisation of the mining sector.
References
Aragon-Correa, J. A., Marcus, A. and Hurtado-Torres, N. 2016. The natural environmental strategies of international firms: old controversies and new evidence on performance and disclosure. Academy of Management Perspectives, 30(1) 4-39. http://dx.doi.org/10.5465/amp.2016.0043 SYMPOSIUM. [ Links ]
Casado-Asensio, J. and Steurer, R. 2015. Bookkeeping rather than climate policy making: National mitigation strategies in Western Europe, Climate Policy, 3062(June): 1-21. doi: 10.1080/14693062.2014.980211. [ Links ]
Chamber of Mines. 2016. Chamber of Mines integrated annual review 2015. Available at http://www.cham-berofmines.org.za/industry-news/publications/annual-reports (accessed 15 March 2018). [ Links ]
Denis-Ryan, A., Bataille, C. and Jotzo, F 2016. Managing carbon-intensive materials in a decarbonizing world without a global price on carbon. Climate Policy 16(sup1). 110-128. doi: 10.1080/14693062.2016.1176008. [ Links ]
Department of Environmental Affairs. 2013. GHG inventory for South Africa. South Africa Government, Pretoria. Available at https://www.envi-ronment.gov.za/sites/default/files/docs/greenhouse-gas_invetorysouthafrica.pdf (accessed 15 March2018). [ Links ]
Department of Minerals and Energy. 2005. Energy Efficiency Accord. South Africa Government, Pretoria. Available at http://www.nbi.org.za/SiteCollectionDocuments/energy_efficiency_accord.pdf (accessed 1 December 2017) [ Links ]
GoldFields. 2015. Integrated Annual Report. Available at https://www.goldfields.com/integrated-annual-reports.php (accessed 15 March 2018). [ Links ]
Graichen, J. Healy, S., Siemons, A., Höhne, N., Kuramochi, T., Gonzales-Zuniga, S., Sterl, S., Kersting, J., and Wachsmuth, J. 2016. International climate initiatives - a way forward to close the emissions gap? Initiatives potential and role under the Paris Agreement. Project No. (FKZ) 371541109. Environmental Research of the Federal Ministry for the Environment, Nature Conservation, Building and Nuclear Safety. Available at https://www.umwelt-bundesamtde/sites/default/files/medien/1968/pub-likationen/2016-11-29_discussion_paper_clean_ver-sion_final.pdf (accessed 15 March 2018). [ Links ]
Grubb, M. Sha, F., Spencer, T., Hughes, N., Zhang, Z. and Agnolucci, P 2015.A review of Chinese CO2 emission projections to 2030: the role of economic structure and policy, Climate Policy. 15(sup1). S7-S39. doi: 10.1080/14693062.2015.1101307. [ Links ]
Harmsen, R. and Graus, W. 2013. How much CO2 emissions do we reduce by saving electricity? A focus on methods, Energy Policy 60: 803-812. doi: 10.1016/j.enpol.2013.05.059. [ Links ]
Hartman, H. 1992. SME Mining Engineering Handbook. Society for Mining, Metallurgy, and Exploration (SME). Colorado Society for Mining, Metallurgy, and Exploration, Inc. Littleton. [ Links ]
Inglesi-Lotz, R. and Pouris, A. 2012. Energy efficiency in South Africa: a decomposition exercise, Energy, 42(1): 113-120. doi: 10.1016/j.energy.2012.04.002. [ Links ]
International Organization for Standardization. 2006. Greenhouse gases Part 1 : Specification with guidance at the organization level for quantification and reporting of greenhouse gas emissions ISO SANS 14064-1 .South African National Standards, Pretoria. [ Links ]
Kumba. 2006. Kumba 2006 highlights. Available at http://www.angloamericankumba.com/~/media/Files/A/Anglo-American-Kumba/investor-presentation/presentation-012.pdf (accessed 15 March 2018). [ Links ]
Kumba. 2010. Kumba Iron Ore Ltd Annual Financial Statements. Available at http://www.angloameri-cankumba.com/~/media/Files/A/Anglo-American-Kumba/AnnualReports/2010/full.pdf. (accessed 15 March 2018). [ Links ]
National Round Table on the Environment and the Economy. 2008. Greenhouse gas emissions forecasting: learning from international best practices. National Round Table on the Environment and the Economy, Ontario. [ Links ]
Okereke, C. and Coventry, P. 2016. Climate justice and the international regime: before, during, and after Paris, Climate Change, 7(6): 834-851. doi: 10.1002/wcc.419. [ Links ]
Rankin, M., Windsor, C. and Wahyuni, D. 2011. An investigation of voluntary corporate greenhouse gas emissions reporting in a market governance system: Australian evidence. Accounting, Auditing & Accountability Journal 7(6), 1037-1070. doi: 10.1108/09513571111184751. [ Links ]
Roelfsema, M. Harmsen, M., Olivier, J. and Hof, J. 2015. Climate action outside the UNFCCC -Assessment of the impact of international cooperatives. PBL Netherlands Environmental Assessment Agency, The Hague. Available at http://www.pbl.nl/sites/default/files/cms/pbl-2015-cli-mate-action-outside-the-unfccc_01188.pdf (accessed 15 March 2018). [ Links ]
Saka, C. and Oshika, T. 2014. Disclosure effects, carbon emissions and corporate value, Sustainability Accounting, Management and Policy Journal 5(1): 22-45. doi: 10.1108/SAMPJ-09-2012-0030. [ Links ]
Schaltegger, S. and Csutora, M. 2012. Carbon accounting for sustainability and management. Status quo and challenges, Journal of Cleaner Production 36, 1-16. doi: 10.1016/j.jclepro.2012.06.024. [ Links ]
SibanyeGold. 2015. Integrated annual report. Available at https://www.sibanyestillwater.com/investors/finan-cial-reporting/annual-reports/2015 (accessed 15 March 2018). [ Links ]
Spalding-Fecher, R. 2011. What is the carbon emission factor for the South African electricity grid?, Journal of Energy in Southern Africa, 22(4): 8-14. [ Links ]
Statistics South Africa. 2017. Mining industry, 2015. Report 20-01-02 (2015) Statistics South Africa, Pretoria. [ Links ]
WBCSD/WRI. 2004. A corporate accounting and reporting standard, Greenhouse Gas Protocol. World Resources Institute, Washington DC. Available at http://www.ghgprotocol.org/standards/corporate-stan-dard (accessed 15 March 2018). [ Links ]
WBCSD/WRI. 2014. Policy and action standard. World Resources Institute, Washington DC. Available at https://www.wri.org/sites/defaul1/files/Policy_and_Action_Standard.pdf (accessed 15 March 2018). [ Links ]
Winkler, H., Jooste, M. and Marquard, A. 2010. Structuring approaches to pricing carbon in energy-and trade-intensive sectors in South Africa, Climate Policy 10(5): 527-542. doi: 10.3763/cpol.2010.0103. [ Links ]
* Corresponding author: Tel: +27 83 2281781. Email: harmke@promethium.co.za

