


Services on Demand
Article
 English (pdf)
 Article in xml format
 Article references
Indicators

Related links
-
 Cited by Google
 -
 Similars in Google
Share

 Permalink
Journal of Energy in Southern Africa
On-line version ISSN 2413-3051
Print version ISSN 1021-447X
J. energy South. Afr. vol.28 n.4 Cape Town Nov. 2017
http://dx.doi.org/10.17159/2413-3051/2017/v28i4a2945
ARTICLES
Decarbonisation and the transport sector: A socio-economic analysis of transport sector futures in South Africa
Tara Caetano*; Bruno Merven; Faaiqa Hartley; Fadiel Ahjum
Energy Research Centre, University of Cape Town, Rondebosch, Cape Town, 7700, South Africa
ABSTRACT
Globally, governments are investigating transport solutions that not only reduce their national emissions but also decrease their reliance on energy imports and increase clean air in cities and towns. A transition in the transport sector is seemingly inevitable considering these priorities. This study outlines some key socio-economic implications of a transition in South Africa's transport system, building on work previously done. The focus was on a rapid decarbonisation of the South African economy and the potential impacts of implementing efficiency improvements in the transport sector, including mode-switching. The overall finding was that a more ambitious decarbonisation target would have marginal impact on the economy relative to South Africa's nationally-determined contribution. It was further found that the implementation of efficiency improvements and changes in behaviour (decreased mileage, increased occupancy, increased rail use and increased use of public transport) could significantly reduce the burden on the economy of a higher GHG emission reduction target.
Keywords: computable general equilibrium (CGE), energy transition, mitigation, electric vehicles, efficiency
1. Introduction
In South Africa, the focus of mitigation research has been on decarbonising the electricity sector, considering that the sector was responsible for 61% of energy sector greenhouse gas (GHG) emissions in 2010 (RSA, 2013b), due to approximately 94% of electricity being generated by coal-fired power stations. Transport, the second-highest GHG contributing sector, emitted a somewhat lower share, of 15%, in 2010, excluding refinery and process emissions (RSA, 2013b), but is expected to grow in relative contribution.
South Africa's energy policy is driven by the Integrated Energy Plan and the Integrated Resource Plan. These policy documents go some way to include climate change mitigation efforts. However, the urgent and growing need for countries to ramp up their ambition when it comes to their climate change response does warrant efforts to reduce, if not eradicate, the use of carbon-intensive fuels (coal, petroleum products, crude oil). With transport accounting for 34% of national energy demand (RSA, 2016b) and currently dominated by these fuels, interventions in this sector are key, and their greater impacts need to be well understood.
Globally, technology and behaviour change has been part of the focus of literature about climate change mitigation in transport options (Schwanen et al., 2011). Transport technology options that use electricity and hydrogen fuel cells have the potential to play a major role in decarbonising the transport sector (Anandarajah et al., 2013). Mitigation scenarios for cities (Yang, et al., 2009; Musti & Kockelman, 2011) and at the national and regional level (Pye et al., 2014; Skippon et al., 2012) show the importance of behaviour change in enhancing mitigation efforts. The present study therefore aims to analyse the potential socio-economic impacts of decarbonisation, with a focus on South Africa's potential transport futures, as departures from the Integrated Energy Plan. Technology options as well as behaviour changes are analysed in this study. South Africa's pressing development imperatives allowed the current study to go a step further to discuss the potential socio-economic implications of these energy futures. Its focus was on analysing the potential socio-economic implications of a more ambitious GHG reduction target and the impacts if energy efficiency and mode-switching were introduced in parallel.
Section 2 provides some background to decar-bonisation in the South African context. Section 3 details the linked energy and economic model approach that was used. Section 4 gives a brief overview of the transport future analysed in this study. Section 5 presents the key results, followed by a discussion of results, and, finally, by the conclusions.
2. Decarbonisation in the South African context
Altieri et al. (2016) examined the implications of meeting a cumulative carbon constraint between 2015 and 2050 of 14 Gt of carbon dioxide equivalent (CÜ2-eq), in scenarios considering different economic development pathways for South Africa. The emissions constraint was met by a rapid decar-bonisation of electricity supply and a move away from emissions-intensive gas-to-liquids and coal-to-liquids (Altieri et al., 2016). It was found that the rapid and relatively lower cost decarbonisation of the electricity system encourages demand sectors to increase their dependence on electricity. In the transport sector, this provides an opportunity for a large-scale switch to electro-mobility technologies, including battery electric (BEV), hydrogen fuel cell and hybrid vehicles. Such a transition would address one of the main concerns about plug-in vehicles, because the carbon emissions simply move from the vehicle's exhaust to the power station (International Monetary Fund, 2015). In a follow-up paper, Caetano et al. (2017) analysed an even more rapid transition to decarbonised energy in South Africa, and assumed a more stringent constraint of 10 Gt cumulative emissions from 2015 to 2050. To meet this carbon constraint, the electricity sector undergoes a rapid transition that leads to higher electricity prices between 2020 and 2040. The electricity price increases because of the increase in electricity sector investment requirements, which has a slightly negative impact on the economy. The cumulative impact of the transition is estimated just over 4% of total gross domestic product in 2040. As, however, the cost of renewable energy continues to decline rapidly and beyond expectation (Wright et al., 2017), these negative impacts of the transition are likely to fall away. The focus of these studies was mainly on the rapid transition in the electricity sector as a response mechanism. The potential opportunities that a decarbonised electricity sector could provide for the transport sector have yet to be unpacked. The significance of transport in total final energy demand in South Africa, the country's high reliance on crude oil imports, and increasing global electro-mobility make these opportunities attractive to explore.
3. Methodology
This section provides a brief description of and motivation for the models used to unpack the opportunities for the country's transport: linked energy (SATIM) and economic (e-SAGE).
3.1 The SATIM model
The SATIM is a full-sector model known as The Integrated MARKAL-EFOM System (TIMES), which includes both the supply and demand sides of the South African energy system. This model can be run using linear or mixed integer programming to solve the least-cost planning problem of meeting projected future energy demand, assuming the retirement schedule of existing infrastructure, future fuel technology costs, learning rates, efficiency improvements, and any constraints on availability of resources. Demand is specified in terms of useful energy, representing the energy services needed by each sector or subsector, e.g., cooking, lighting, and process heat. Final energy demand is then calculated endogenously, based on the mix of supply and demand technologies, e.g., capacity, new investment, production and consumption, which would result in the lowest discounted system cost for meeting energy demand over the time horizon, subject to any system constraints that are applied. The model has five demand sectors (industry, agriculture, residential, commercial, and transport) and two supply sectors (electricity and liquid fuels), which can be analysed individually or together. The SATIM allows for trade-offs between the supply and demand sectors, and it explicitly captures the impact of structural changes in the economy (i.e., different sectors growing at different rates), process changes, fuel- and mode-switching, and technical improvements related to efficiency gains (Altieri et al. 2015).
Long-term modelling requires a credible storyline with a consistent set of assumptions. The SATIM relies on a scenario-based approach for long-term modelling. Unlike forecasts, these scenarios do not pre-suppose knowledge of the main drivers of demand; instead, a coherent set of assumptions forms the basis for the changes in these drivers, as they evolve in a consistent system (Merven et al., 2014). This is difficult to achieve without the use of an economic model. In addition, SATIM does not endogenously account for the feedback from the economy as sectors and consumers respond to changes in energy prices and as the economy responds to energy investment requirements. By not accounting for this feedback, it is likely that SATIM will over- or under-estimate energy demand when used independently from an economic model.
3.2 The E-SAGE model
The E-SAGE model was developed by the United Nations University World Institute for Development Economics Research and is based on the 2007 South African Social Accounting Matrix (SAM). The SAM is a set of accounts that represents all of the productive sectors and commodities in South Africa as well as factor markets, enterprises, households, and the 'rest of the world'. The 2007 SAM has 61 productive sectors (industries) and 49 commodities. The seven factors of production include land and four labour groups disaggregated according to level of education; and there is a distinction between energy and non-energy capital (Arndt et al. 2011). The government, enterprises, 14 household groups based on their per-capita expenditure, and interactions with the rest of the world (based on the external account that includes global commodity prices, foreign financial flows, payments for imports and revenues from exports, and trade elasticities) are all represented. The behaviour of industries and households is governed by rational expectations (Thurlow 2004; 2008). Industries and producers aim to maximise profits, while households aim to maximise their utility subject to their budget constraint. Product and factor market equilibrium are maintained.
The E-SAGE model is a dynamic recursive model and as such has two periods, the 'within period' and the 'between period'. The static run of the CGE model makes up the within period, in which the economy adjusts to an annual shock. Some variables and parameters are updated on the basis of the new equilibrium during the 'between period', capital accumulation and re-allocation being determined endogenously with exogenous forecasts for population growth, factor productivity, and technical change in the energy sector from SATIM (Alton et al. 2014; Altieri et al. 2015).
Economy-wide models are governed by a set of closure rules that are used to ensure that macro-economic balances and constraints on the economy are abided by in the model. In other words, decisions are made as to which variables are endogenous and exogenous, respectively, and this governs the way that the model adjusts so that all of the accounts 'close'. The following closures are applied to all of the e-SAGE model runs:
• Savings and investment: Previous studies have found that the savings-driven investment closure is most appropriate for South Africa.
• Government: Uniform sales tax rate point changes are allowed for selected commodities, while government savings remain fixed.
• Foreign: South Africa has a flexible exchange rate, so a fixed trade balance is assumed and the exchange rate is able to adjust and maintain equilibrium between payments to and from other countries.
• Factor market: A large portion of the low-skilled workforce in South Africa is unemployed, and some of this unemployment is structural. Therefore, it is assumed that low-skilled labour is not fully employed and that there are rigidities in the labour market. To simulate unemployment, an upward-sloping supply curve was assumed for low-skilled labour. Low real wage supply elasticities were also assumed to indicate that low-skilled unemployment is structural. Skilled and semi-skilled labour is assumed to be fully employed and mobile. Factor prices (i.e. rent or wages) are allowed to adjust to ensure that equilibrium is reached and demand equals supply. Capital is assumed to be fully employed and activity- or sector-specific. Land is fully employed and mobile - that is, it can be used for different purposes.
A key feature of the e-SAGE model is that energy is considered an intermediate input; the interaction between intermediates and factors is governed by a Leontief production function (Merven et al., 2017).
Although e-SAGE has come some way to include more detail on the energy sectors, the model is not designed to optimise the supply of energy, which is needed to efficiently allocate investment to energy sectors. This requires a detailed representation of technologies that exist and are available to the energy sector, as well as detailed energy demand profiles such as those that exist in the SATIM model (Merven et al., 2017).
3.3 Linked model
The use of a linked model allows a detailed analysis of both the resultant technology mix and the key socio-economic indicators. The linked SATIM and e-SAGE model brings together a bottom-up engineering model of South Africa's energy system (SATIM), and a top down economic model (e-SAGE), which is a computable general equilibrium model. In the linked model shown in Figure 1, alternate runs of SATIM and e-SAGE are performed from 2006 to 2050, and information is passed between models after each instance. In each iterative loop, SATIM uses the sectoral GDP and house-hold income from e-SAGE to compute an electricity investment plan, electricity price projection, the energy component of all activities' production function and the energy component of households' consumption functions. For a more detailed explanation of the linked model, see Merven et al. (2017).
4. Transport sector futures
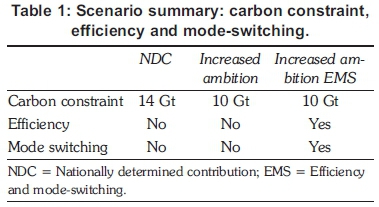
The transport sector, especially its associated energy infrastructure such as refineries and pipelines, requires a long-term planning horizon. The associated infrastructure investments are bound by long lead times, large sunk costs, as well as impact on society and the environment. The SATIM model was used to analyse the evolution of road transport in South Africa to 2050, given uncertainty in technology costs, technology options and fuel prices. These scenarios provide a valuable research base for long-term planning. The preference for alternative fuels, the extent of electric vehicle adoption, and the implications of a decrease in reliance on petroleum products are explored. Three scenarios were chosen for the purpose of this paper to show the impact of a more stringent carbon constraint and the impact of implementing efficiency improvements in the transport sector, including mode-switching. The baseline scenario includes a carbon cap of 14 Gt CÜ2-eq cumulative from 2015 to 2050. This is in range with the emissions trajectory presented in South Africa's international obligation and its long-term climate mitigation goals that underpin its nationally determined contribution (NDC) (Altieri et al., 2016), so the baseline scenario is referred to as the NDC scenario in the present study. In this scenario, it is assumed that private vehicle ownership is strongly linked to income (Dargay, 2001; Pongthanaisawan et al., 2010; Nolan, 2010). The NDC scenario also assumes that there are no exogenous behavioural changes (annual mileage and occupancy are kept constant at 2012 levels for passenger transport). For freight transport, mode-share between road and rail are also kept constant at that calibrated for the base year, 2012.
The second scenario, 'Increased ambition', is, as the name suggests, a scenario where South Africa increases its ambition in climate change mitigation, and carbon emissions are constrained to 10 Gt CÜ2-eq cumulative from 2015 to 2050. This emissions constraint is loosely aligned with the lower Peak Plateau and Decline trajectory that underpins South Africa's long-term mitigation goals. The assumptions for the demand projections are the same as in the baseline scenario.
The third scenario is 'Increased ambition, efficiency and mode-switching (EMS)', which is the same as the second scenario in terms of carbon constraint but also includes exogenous technology-based efficiency improvements and exogenous mode-switching in the transport sector, e.g. more efficient private vehicles and car-sharing. The demand projection for freight transport assumes that road-to-rail freight is promoted and the share of rail corridor transport increases in line with Transnet's road-to-rail strategy (RSA, 2016). For passenger transport, behavioural changes are simulated, such as a decrease in private vehicle ownership, a decrease in annual mileage and an increase in occupancy. There is also an increase in the demand for passenger-kilometres that are met by public transport over the period to 2050, in accordance with the White Paper on National Transport Policy (RSA, 1996) and the Moving South Africa Action Agenda (RSA, 1999). The efficiency of conventional internal combustion engine vehicles improves annually. These scenarios are summarised in Table 1.
5. Results
The results show that, under certain assumptions, BEVs could play a significant role in providing a private transport solution that is also low in carbon.
Secondly, consumption of gas and electricity (especially distributed electricity) in the transport sector could surpass that of diesel and petrol by 2045. Lastly, efforts made to increase efficiency and mode-switching in the transport sector could significantly reduce negative economic impacts that could result from stringent emissions constraint. The results are from the linked energy and economic model for the three scenarios, the NDC scenario with a 14 Gt constraint, the increased ambition scenario with a 10 Gt constraint, and the increased ambition EMS scenario, which combines a 10 Gt emissions constraint with exogenous energy efficiency and mode-switching in the transport sector. Several indicators will be reported on, including a brief explanation of the energy sector results (energy mix and effects on the electricity sector), and socio-economic results that include trade effects, GDP, sectoral GDP, employment, and income and welfare.
5.1 Energy mix and the electricity sector
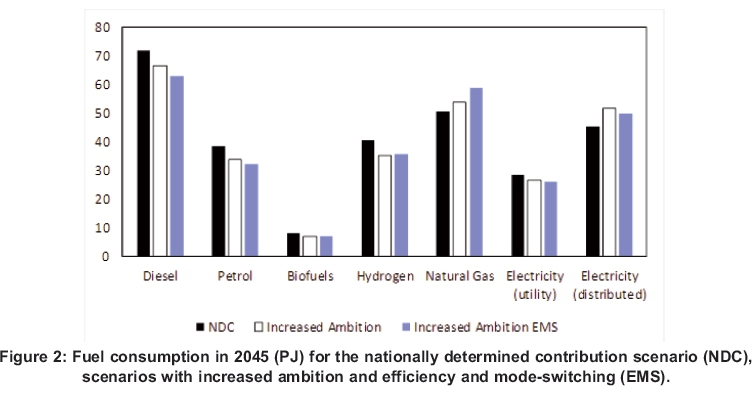
In comparison with the scenarios featuring more stringent carbon constraints, the NDC scenario has marginally higher aggregate fuel consumption of 285 PJ for road transport in 2045, than 278 PJ for the increased ambition scenario and 274 PJ for the increased ambition EMS scenario. Figure 2 shows the fuel consumed by the transport sector under all three scenarios in 2045. The NDC scenario illustrates that electricity (distributed and utility) is the dominant energy source for the transport sector in 2045. Demand is also met through liquid fuels, low penetration of biofuels used mostly for public transport, a significant amount of hydrogen (41 PJ) used primarily for freight transport, and natural gas (both imported and local). An important result is that in 2045 the transport sector is more reliant on electricity and natural gas than on diesel and petrol, which is a significant transition from the sector's current fuel demand.
In the increased ambition scenario there is less diesel and petrol used in the transport sector, compared with the NDC scenario. This is mainly for public transport and for freight. Less hydrogen is consumed in the more carbon-constrained scenarios, because the steam reforming process used to produce hydrogen is in itself not carbon-neutral (Rostrup-Nielsen et al., 2002). The increased stringency of carbon emissions also results in more demand for natural gas and electricity (especially distributed electricity for charging private vehicles).
For private road transport, there is a high reliance on distributed electricity to fuel BEVs in all three scenarios in 2045. In all scenarios, it is assumed that the cost premium on BEVs declines to meet parity with internal combustion engine vehicles in 2030 and that there is potential for distributed generation of renewable energy by households and commercial buildings. Under these considerations, BEVs could play a significant role in providing a private transport solution that is also low-carbon.
As the stringency of the carbon constraint increases from 14 to 10 Gt and the model responds by rapidly decarbonising the electricity system, the transport sector's demand for distributed electricity increases above the NDC scenario in 2045 for both increased ambition scenarios (Figure 2). The increase in demand for distributed electricity is a result of the increase in private BEVs on the road. All energy demand sectors in the SATIM model follow the same trend and switch to decarbonised electricity as a least-cost mitigation option.
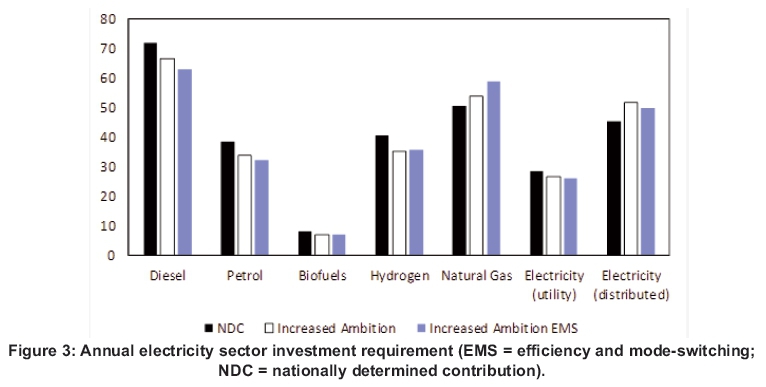
The investment requirement for the new electricity sector generation infrastructure is passed to the e-SAGE model. Figure 3 illustrates how much higher the investment requirement is when the carbon constraint increases from 14 Gt to a more stringent 10 Gt. The increased ambition scenarios would require 61% (without EMS) to 64% (with EMS) more investment over the period before 2045, compared with the NDC scenario. The NDC scenario already calls for ZAR 2.6 trillion (2015 rand) over the period, therefore the increased ambition scenarios, especially in the later years as sectors switch to decarbonised electricity to meet the more stringent carbon constraint, would require large investments in the electricity sector.
It was assumed that investment was taken from the savings pool and therefore an increase in investment allocated to the electricity sector means that there is less investment available for other sectors in the economy. This is explored in more detail in section 5.4. Sectors are impacted by this transition mechanism, as well as by the electricity price effects. Table 2 shows the electricity price growth path for the NDC scenario from 2015 to 2045 as well as the increase in the electricity price for both 10 Gt scenarios over the period. The price increase is in response to both the increase in investment in generation capacity to meet demand and the investment in generation capacity to replace stranded coal power generation.
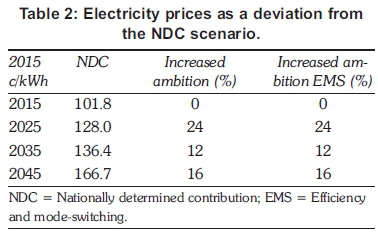
The higher investment requirement in the 10 Gt scenarios has a sustained impact on the electricity price, with an electricity price about 24% higher than the NDC scenario in 2025. The sustained increase in electricity price has a negative impact on sectors that have a high demand for electricity, as their cost of production increases and this negatively affects their profitability, with a subsequent slowing down of their growth. In the 2020s the higher electricity price in the increased ambition scenarios, relative to the NDC scenario, is driven by the stranding of old coal-fired plants that do not run to the end of their lives, as found in Burton et al. (2016).
5.3 Imports and the exchange rate
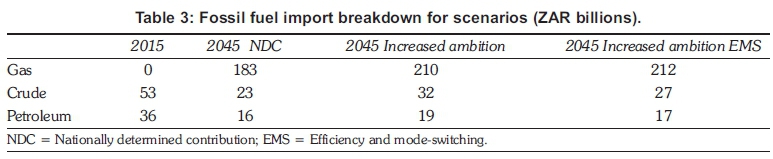
Both the 10 Gt scenarios (increased ambition with and without EMS) rely heavily on imported fossil fuels, even more so than the NDC scenario, at 21% and 20% of total import value respectively. This is mostly because of high amounts of gas imports, presented in Table 3, that are used in electricity generation, hydrogen production through the steam reformation process, and for freight transport. There is a large reduction in the imports of crude oil and petroleum, but these are offset by natural gas imports. Total fossil fuel imports as a portion of total imports are similar in all scenarios until 2035 when there is large uptake of gas, not only in transport but other sectors of the economy too. This would change significantly if a more optimistic view of local gas production, particularly through currently debated fracking in the Karoo, were assumed in the scenarios.
The exchange rate is assumed to be flexible, and adjusts to maintain a budget deficit for South Africa to 2045. On average, the exchange rate appreciates slightly for both scenarios compared with the NDC. This has a negative impact on export-sectors of the economy. The trade narrative is explained in Section 5.4.
5.4 Aggregate and sectoral GDP
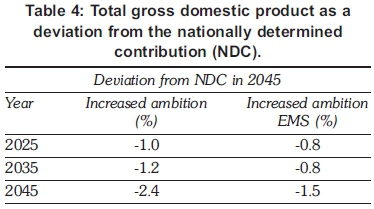
Overall, there is a negative impact on GDP in the increased ambition scenario compared with the NDC scenario. This arises from the increased capital required by the electricity sector as well as the costs associated with coal assets that are stranded over the period. Costs of renewable energy generation technologies have decreased significantly more than expected over the last few years; if this continues and the costs fall by more than assumed in this study then this would decrease the negative impact of increased ambition on GDP. An advantage of using a dynamic model is that it is possible to analyse the results as the economy transitions over the period. As shown in Table 4, there is a negative impact on GDP in both scenarios compared with the NDC scenario, but the results show that, if efficiency improvements in the transport sector were implemented, including changes in behaviour (decreased mileage, increased occupancy, increased rail use and increased use of public transport), the potential negative impacts on GDP of more stringent carbon constraints would be dampened significantly. This implies that mitigation policies must consider energy efficiency improvements and behavioural change in conjunction with a national carbon budget to capitalise on the cost reductions of mitigation.
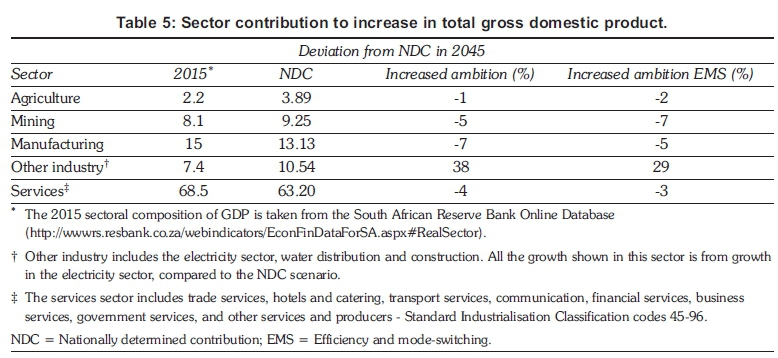
The trade and exchange rate effects and the energy infrastructure requirements both have an impact on sectoral GDP. At a sector level, the electricity sector is positively impacted by the increase in investment flows to fund the expansion in generation capacity. This is shown in Table 5 by the 38% and 29% increases in other industry contribution to GDP for Increased ambition and Increased ambition EMS, relative to the NDC scenario.
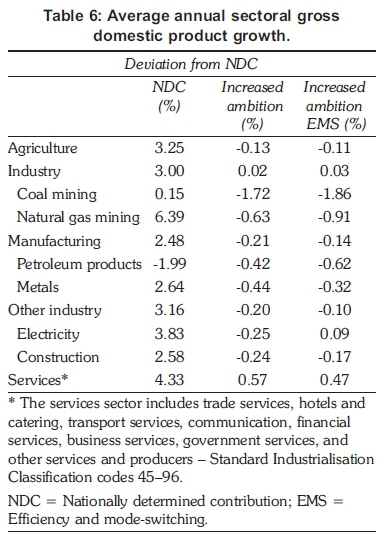
There is an increase in the mining sector's contribution to GDP for both scenarios relative to the NDC. This is driven by growth in the natural gas-mining sector, which is offset by the contraction of the coal-mining sector, with a decline in annual sectoral growth of approximately 5% on average, relative to the NDC scenario. The local use of coal declines significantly in the 10 Gt scenarios with the stranding of coal assets (mines, power sector and coal-to-liquids). This is consistent with previous work that examined in detail the potential for stranding assets in South Africa (Burton et al., 2016). Coal exports also decrease in both increased ambition scenarios, which also contribute to the contraction of the sector, shown in Table 6.
The increase in investment requirements from the increased stringency of the carbon constraint has the overall impact of decreasing the investment available to other sectors of the economy, hence the negative impact on GDP overall as well as at a sector level. This is true for all sectors other than the natural gas mining sector and the electricity sector.
5.5 Employment
In terms of employment effects there are significant negative impacts on the employment of unskilled labour when the carbon constraint is changed from 14 to 10 Gt, although, when efficiency improvements and behavioural change in the transport sector are introduced at the same time, these negative effects are dampened considerably. These impacts are presented in Table 7.
The decrease in the employment of unskilled workers in the Increased ambition scenario, relative to the NDC scenario, is driven by the relative decline in growth in almost all sectors, but notably in sectors that rely on unskilled labour such as the mining sector and the agricultural sectors (agriculture crops, forestry and fisheries), because of higher prices and general slowdown in the economy. The employment gains that are seen in the EMS scenario, relative to the Increased ambition scenario, are from slightly less employment losses overall, and notably from an increase in employment in the agriculture crops sector relative to the NDC scenario.
Employment in the electricity sector, given the positive impact on growth of the sector in both increased ambition scenarios, increases by around
134 770 and 108 423 employees in 2045 respectively. There is also an increase in the employment in transport services, mainly driven by increases in freight and public transport that are captured in this sector. Freight and public transport are currently combined in the transport services sector in e-SAGE; the links between models are therefore currently weak and possibly underestimate the extra expenditure required by the state on public transport and rail infrastructure for freight.
5.6 Income and welfare
There is a negative impact on income and consumption in both the Increased ambition and Increased ambition EMS scenarios, and households earn approximately 11% less over the period in comparison with the NDC scenario. The poor households (bottom 50% of income earners) are worse off, with earnings of about 12% less over the period, compared with non-poor households that earn about 10.9% less. The decline in welfare of all households, relative to the NDC scenario, is predominately caused by the negative employment effects and the overall decline in growth in the economy. The slight appreciation of the rand in both 10 Gt scenarios dampens the negative impacts because of the increased affordability of imported goods and services.
6. Conclusions
An outline was given of some of the key socio-economic implications of a transition in South Africa's transport system. The focus was on a rapid decar-bonisation of the South African economy and the potential impacts of implementing efficiency improvements in the transport sector including mode switching. The results showed that battery electric vehicles could play a significant role in providing a private transport solution that is also low-carbon, subject to certain considerations. Generally, a rapid decarbonisation of the South African economy would have a slightly negative impact on it relative to a less ambitious decarbonisation target. Similar to the findings in international literature, the implementation of efficiency improvements in the transport sector and changes in behaviour (decreased mileage, increased occupancy, increased rail use and increased use of public transport) could significantly reduce the burden on the economy of stringent emissions reductions. Implications of this study are that mitigation policies must consider energy efficiency improvements and behavioural change in conjunction with a national carbon budget if it is to reduce costs of mitigation.
References
Altieri, K.E., Trollip, H., Caetano, T., Hughes, A., Merven, B. and Winkler, H. 2016. Achieving devel opment and mitigation objectives through a decarbonization development pathway in South Africa. Climate Policy, 16(sup1): S78-91. [ Links ]
Alton, T., Arndt, C., Davies, R., Hartley, F, Makrelov, K., Thurlow, J. and Ubogu, D. 2014. Introducing carbon taxes in South Africa. Applied Energy, 116(1): 344-354. [ Links ]
Analysis, Systems, and Planning Group. 2013. Assumptions and methodologies in the South African TIMES (SATIM) Energy Model. Available at: http://www.erc.uct.ac.za/groups/esap (accessed February 2017). [ Links ]
Anandarajah, G., McDowall, W. and Ekins, P. 2013. Decarbonising road transport with hydrogen and electricity: Long term global technology learning scenarios. International Journal of Hydrogen Energy. 38(8): 3419-3432. [ Links ]
Arndt, C., R. Davies, and J. Thurlow (2011). Energy extension to the South Africa General Equilibrium (SAGE) Model (Version 2). Helsinki: United Nations University World Institute for Development Economics Research. Unpublished mimeo. [ Links ]
Arndt, C., Davies, R., Gabriel, S., Makrelov, K., Merven,B., Salie, F. and Thurlow, J. 2014. An integrated approach to modelling energy policy in South Africa: Evaluating carbon taxes and electricity import restrictions. UNU-WIDER Working Paper 2014/135. Helsinki: United Nations University World Institute for Development Economics Research. [ Links ]
Burton, J., Caetano, T., Hughes, A., Merven, B., Ahjum, F. and McCall, B. 2016. The impact of stranding power sector assets in South Africa: using a linked model to understand the economy-wide implications. Energy Research Centre, University of Cape Town, Cape Town, South Africa. [ Links ]
Dargay, J.M. 2001. The effect of income on car ownership: Evidence of asymmetry. Transportation Research Part A: Policy and Practice, 35(9): 807-821. [ Links ]
Dervis, K. and Robinson S. 1982. General equilibrium models for development policy. Cambridge University Press. [ Links ]
Energy Research Centre. 2014. South African TIMES model. Available at: http://www.erc.uct.ac.za/groups/esap (accessed February 2017). [ Links ]
International Energy Agency [IEA]. 2016. Global EV outlook 2016: Beyond one million electric cars. International Energy Agency. Paris, France. April 2017. Available at: https://www.iea.org/publications/freepublications/publication/Global_EV_Outlook_2016.pdf (accessed March 2017). [ Links ]
International Monetary Fund [IMF]. 2015. How large are global energy subsidies? International Monetary Fund Working Paper - WP/15/105. May 2015. Available at: https://www.imf.org/external/pubs/ft/wp/2015/wp15105.pdf (accessed March 2017). [ Links ]
Lofgren, H., Lee Harris, R. and Robinson, S. 2002. A standard computable general equilibrium CGE model in GAMS, 5. Microcomputers in policy research. International Food Policy Research Institute, Washington D.C. 2002. [ Links ]
Merven, B., Moyo, A., Stone, A., Dane, A. and Winkler, H. 2014. The socio-economic implications of mitigation in the power sector including carbon taxes in South Africa. Working paper for CDKN project on linking sectoral and economy-wide models. Energy Research Centre, University of Cape Town, Cape Town, South Africa. [ Links ]
Merven, B., Arndt, C. and Winkler, H. 2017. The development of a linked modelling framework for analysing the socioeconomic impacts of energy and climate policies in South Africa. WIDER Working Paper 2017/40. Helsinki: UNU-WIDER. [ Links ]
Musti, S. and Kockelman, K.M. 2011. Evolution of the household vehicle fleet: Anticipating fleet composition, PHEV adoption and GHG emissions in Austin, Texas. Transportation Research Part A: Policy and Practice 45(8): 707-720. ISSN 0965-8564. [ Links ]
Nell, K. 2003. Long-run exogeneity between saving and investment: Evidence from South Africa. TIPS Working Paper 2-2003, Trade and Industrial Policy Strategies. [ Links ]
Nolan, A. 2010. A dynamic analysis of household car ownership. Transportation Research Part A: Policy and Practice 44(6): 446-455. https://doi.org/10.1016/j.tra.2010.03.018. [ Links ]
Pongthanaisawan, J. and Sorapipatana, C. 2010. Relationship between level of economic development and motorcycle and car ownerships and their impacts on fuel consumption and greenhouse gas emission in Thailand. Renewable and Sustainable Energy Reviews, 14(9): 2966-2975. https://doi.org/10.1016/j.rser.2010.07.034. [ Links ]
Pye, S., Usher, W. and Strachan, N. 2014. The uncertain but critical role of demand reduction in meeting long-term energy decarbonisation targets. Energy Policy, 73: 575-586. [ Links ]
Republic of South Africa. 1996. White paper on national transport policy. Department of Transport, South Africa. [ Links ]
Republic of South Africa. 1999. Moving South Africa action agenda. Department of Transport, South Africa. [ Links ]
Republic of South Africa. 2013. Energy balance. Department of Energy, South Africa. [ Links ]
Republic of South Africa. 2013b. GHG inventory for South Africa 2000-2010. Department of Environmental Affairs, South Africa. [ Links ]
Republic of South Africa. 2016. National transport master plan NATMAP 2050. Department of Transport, South Africa. 19 October 2016. [ Links ]
Republic of South Africa. 2016b. Draft integrated energy plan IEP report. Department of Energy, South Africa. Pretoria. [ Links ]
Rostrup-Nielsen, J.R., Sehested, J. and N0rskov, J.K. 2002. Hydrogen and synthesis gas by steam- and CO2 reforming. Advances in Catalysis, 47. [ Links ]
Schwanen, T., Banister, D. and Anable, J. 2011. Scientific research about climate change mitigation in transport: A critical review. Transportation Research Part A: Policy and Practice 45(10): 993-1006. [ Links ]
Skippon, S., Veeraraghavan, S., Ma, H., Gadd, P and Tait, N. 2012. Combining technology development and behaviour change to meet CO 2 cumulative emission budgets for road transport: case studies for the USA and Europe. Transportation Research Part A: Policy and Practice 46(9): 1405-1423. [ Links ]
Thurlow, J. 2004. A Dynamic computable general equilibrium CGE model for South Africa: Extending the static IFPRI model. Trade and Industrial Policy Strategies, Pretoria, South Africa. [ Links ]
Thurlow, J. 2008. A recursive dynamic CGE model and microsimulation poverty module for South Africa. International Food Policy Research Institute, Washington, D.C., USA. [ Links ]
United Kingdom. 2017. Driving the future today: A Strategy for ultra-low emission vehicles in the UK. Office for Low Emission Vehicles. UK Government. London. Available at: https://www.gov.uk/government/publications/driving-the-future-today-a-strategy-for-ultra-low-emission-vehicles-in-the-uk (accessed August 2017). [ Links ]
Venter, I. 2017. New body to tackle public perception, cost of electric vehicles. Engineering News. 25 January 2017. http://www.engineeringnews.co.za/article/new-body-to-tackle-public-perception-costs-of-electric-vehicles-2017-01-25 (accessed March 2017). [ Links ]
Winkler, H. 2007. Long-term mitigation scenarios. Project Report. Energy Research Centre, University of Cape Town, Cape Town, South Africa. [ Links ]
Wright, J., Bischof-Niemz, T., Calitz, C., Mushwana, C., van Heerden, R., Senatla, M. 2017. Formal comments on the Integrated Resource Plan (IRP) update assumptions, base case and observations. Council for Scientific and Industrial Research, Pretoria. [ Links ]
* Corresponding author: Tel.: +27 21 650 3230; email: tara.caetano@uct.ac.za

