


Services on Demand
Article
 English (pdf)
 Article in xml format
 Article references
Indicators

Related links
-
 Cited by Google
 -
 Similars in Google
Share

 Permalink
Journal of Energy in Southern Africa
On-line version ISSN 2413-3051
Print version ISSN 1021-447X
J. energy South. Afr. vol.28 n.4 Cape Town Nov. 2017
http://dx.doi.org/10.17159/2413-3051/2017/v28i4a1753
ARTICLES
Experimental investigation of biogas production from feedlot cattle manure
Logan RosenbergI; Gerrit KorneliusII, *
IDepartment of Mechanical and Aeronautical Engineering, University of Pretoria, Private Bag X20, Hatfield 0028, South Africa
IIDepartment of Chemical Engineering, University of Pretoria. Private Bag X20, Hatfield 0028, South Africa
ABSTRACT
Biogas can be generated from biomass in an anaerobic digestion process and used to generate electricity and heat as an alternative energy source to fossil fuel-generated electricity. This study investigated biogas generation from cattle manure dried for periods up to 40 days. Manure samples were analysed for gas yield using the biochemical methane production test. The biogas volume produced by manure samples aged for periods up to 40 days after seeding with cattle rumen fluid was measured as a function of time until there was no further measurable gas production. The biogas was analysed for methane and carbon dioxide content using a gas chromatograph. The corresponding cumulative net biogas yield ranged from 154 to 369 Nml/g.VS respectively. The test results showed that an average of 240 Nml/g.VS of biogas can be produced from cattle manure that is less than 40 days old, with an average methane and carbon dioxide percentage of 63% and 31% respectively. Within 3 to 4 days the manure samples generated 80% of the final biogas volume. The drying process was found to occur at a constant rate per unit area, regardless of the manure thickness up to thickness of200 mm. Biogas formation closely followed the Gompertz equation. There was no significant difference in the biogas production nor biogas production rate for cattle feedlot manure that was fresh up until aging to 40 days.
Keywords: drying, anaerobic digestion, volatile solids, methane, digester design
1. Introduction
Biogas is a renewable energy source that can be produced continuously from biomass (organic material), which is a living storage of solar energy through photosynthesis. Biogas is formed during the anaerobic breakdown of biomass by a group of microorganisms, which are metabolically active in humid conditions in the absence of oxygen [1]. Such a process is referred to as anaerobic digestion (AD). After AD the remaining product, called diges-tate, can be used as a source of fertiliser because of its high nutrient value. Biogas is generally a mixture of different gases, with methane being the largest constituent (50-75% by volume) followed by carbon dioxide (25-45% by volume), and other gaseous components (less than 7% by volume) [1]. Biogas with a methane content of 45% and higher is flammable and can be used to produce clean energy [1].
South Africa is rich in agricultural feedlots, in particular cattle feedlots. Each feedlot is unique in terms of the quality and characteristics of the manure caused by different feeding operations. There is also a difference in the composition between beef and dairy cattle manure. Fully grown cattle can produce an average of 20 kg of manure per head per day of which 4 kg is total solids (TS) and 2.6 kg of the fresh manure is volatile solids (VS). Cattle manure has the capacity to generate 200 to 500 litres of biogas per kg of dry manure depending on the process characteristics [2].
The manure on cattle feedlots is scraped out of the stalls and piled on large heaps or placed in storage pits daily. It ranges from fresh manure to aged (or dried) manure. During storage, it undergoes some aerobic digestion and loses some of its energy content that can potentially be used to produce biogas. Fresh cattle manure already contains the anaerobic bacteria that produce biogas, as these are generated in the digestive tract of the animals. When the cattle manure is exposed to oxygen and fluctuations in temperature outside the animal digestive tract, the concentration of bacteria decreases as the fresh manure becomes drier. There is thus a difference between fresh cattle manure and aged cattle manure in terms of VS, TS, nutritional value and the anaerobic bacterial content that produces biogas. This leads to different biogas yields and qualities.
A method of estimating the conversion of biomass into usable energy is the biochemical methane potential (BMP) test, which determines the amount of stored energy that can be extracted from biomass in the form of methane gas [3]. The BMP test method suggests the addition of inoculants in the form of sewage sludge or rumen fluid, found in one of the four compartments of a cow's stomach, to speed up the AD process [4]. The ecosystems in the rumen fluid consists of the bacteria (1010-1011 cells per ml) required for anaerobic digestion. The four anaerobic processes of hydrolysis, acidogenesis, acetogenesis and methanogenesis run simultaneously in the biogas digester. During the first step of hydrolysis, small amounts of biogas are formed, after which the biogas generation rate increases until it reaches its peak during the fourth step of methanogenesis [5].
The VS is an important factor in determining the BMP of a particular type of biomass, as the VS is broken down to produce biogas. Triolo et al [6] developed an algorithm to predict the BMP and found that lignin concentration within the VS was the strongest predictor of BMP for animal manures. Their These studies showed that the lignin fraction could be used to predict the BMP for a combined model for animal manures with a correlation coefficient of 0.908. Amon et al [7] found that the manures with the higher crude protein (CP) levels gave higher methane yields during AD. The lignin and CP fractions are, consequently, important characteristics when analysing a particular biomass for AD.
The anaerobic microorganisms that produce biogas are sensitive to changes in operating conditions, which can affect their growth and activity. The important process variables of AD are temperature, pH levels, mixing, hydraulic retention time, concentration of microorganisms, volatile fatty acids, ammonia concentration and the specific surface area of biomass [1]. The optimum temperature to perform the BMP test under mesophilic conditions is 35 °C [1]. This study gives an indication of the impact of manure aging on the economics of biogas production.
2. Methods
2.1 Manure sampling and analysis procedure
Cattle manure samples were collected from the cattle stalls at a beef cattle feedlot near Cullinan, Gauteng Province, early in the morning to ensure that the manure was as fresh as possible. Different subsamples were taken at random locations in the stalls to make up a good sample of fresh manure. The subsamples were mixed thoroughly in a 30 L container to achieve a homogeneous manure sample. The homogenised sample was then divided into subsamples and placed in transparent cylindrical containers of different height but with the same diameter of 90 mm. The drying characteristics of the manure were tested using containers of varying heights, while BMP testing was done on manure samples dried for varying times in containers of uniform height of 150 mm. For the drying test, the sampling containers had stack heights of respectively 50 mm, 100 mm, 150 mm (x 16 for BMP testing), 200 mm and 250 mm and were exposed to the open air outside (20 containers) during a winter period without rainfall. The corresponding volumes of the 50, 100, 150, 200 and 250 mm containers were 320, 640, 950, 1270, and 1590 ml respectively. Each sampling container was filled to the top with manure and had an accuracy of 5 mm with respect to the top end of the container. The samples were covered with a net to prevent insect contamination.
One fresh sample was kept as a control for fresh manure at -18 °C to prevent microbial activity [8]. This sample was analysed for TS, VS and CP A BMP test was performed on this sample as well as on the fresh unfrozen manure sample.
Each container was weighed prior to the drying process to determine the initial mass of the container. Some bacterial action during drying was observed. Duplicate 150 mm containers were removed and placed in the freezer at intervals of 4, 7, 11, 14, 21, 28, 35 and 40 days. At the end of the experimental period, one of each pair of samples was analysed for TS, VS and CP, while the other was analysed in the BMP test for biogas generation.
For the containers of varying height, the thickness of the dried manure layer at the top of the containers was then measured with a Vernier calliper through the transparent container wall. Weather data from the University of Pretoria weather station was recorded for the drying period and included the half hourly air temperature, relative humidity, wind speed, rainfall and barometric pressure. The samples were aged in close proximity to the weather station.
Prior to the start of the BMP test, all the frozen samples were left to defrost at room temperature indoors. Each sample was then diluted with distilled water to obtain a liquid mixture with a calculated TS concentration of 7%. The water added to the fresh, 4, 7, 11, 14, 21, 28, 35 and 40 days aged manure was 500, 505, 510, 530, 540, 560, 580, 590 and 620 ml, respectively. Eleven samples of manure were subjected to BMP test and comprised eight samples aged for a given time and then frozen, two non-aged samples (one frozen and one fresh) and a sample aged for 40 days but not frozen.
2.2 Methods for determining total solids, volatile solids and crude protein (nitrogen) of manure
The manure analysis was carried out in a laboratory at the University of Pretoria under controlled conditions. The TS percentage was determined by drying each sample in an oven at 135 ±2 °C until there was no further weight loss in the sample according to the AOAC Official Method 930.15 [9]. The VS percentage was determined by ashing the dried sample at 600 °C. The VS is the total dry sample mass less the mass of ash according to the AOAC Official Method 942.05 [9].
The CP (nitrogen) content of the manure was determined using the Dumas method, according to the AOAC Official Method 968.06 [9]. The dried sample was ground to pass through a no. 30 sieve and stored in capped bottles. The nitrogen was measured with a Coleman model 29A nitrogen analyser that combusts the sample at 850-900 °C. Carbon dioxide is absorbed in potassium hydroxide and volume residual nitrogen is measured and converted to equivalent protein by a numerical factor of 6.25.
2.3 Experimental for the biochemical methane potential test
The experiments were conducted as described by Owen et al [10], Hansen et al [11] and Esposito et al [12]. Duplicate tests were done on the 150 mm (9 frozen samples) stack-height manure samples, fresh manure sample (not frozen) and a sample aged to 40 days (not frozen) was analysed (11 different samples). Each sample was diluted with distilled water to achieve a calculated TS concentration of 7% and mixed thoroughly with a stick blender (Safeway, 200 W). Each 800 ml liquid sample was poured into a 1000 ml Duran GL45 laboratory glass bottle, while 50 ml of inoculant (rumen fluid collected from an experimental dairy farm at the University of Pretoria) was added to ensure that the anaerobic digestion process was initiated. A 20 ml of 2% sodium hydroxide concentration was added to each sample to obtain an initial pH of between 7 and 8 [13], while the pH was measured before and after the BMP test. A control sample containing only 50 ml inoculant and 800 ml distilled water was also prepared. Each reactor bottle was flushed with nitrogen gas while being closed with an airtight sealing lid (Duran GL45 screw cap with two hose connectors) to ensure anaerobic conditions.
The reactor bottles were placed in a temperature controlled water bath at 35±1 °C and manually shaken gently at daily intervals to promote the release of biogas. Each bottle was connected to a manometer-type gas-measuring tube and the daily biogas formation was measured, until there was no visible gas formation after 40 days of AD. Measurements taken included:
• volume of gas formed in each reactor vessel (daily);
• ambient temperature and pressure (daily);
• methane and carbon dioxide content (twice a week);
• the pH of each reactor vessel (before and after the BMP test); and
• the weight of each reactor vessel (before and after the BMP test).
The biogas evolution was determined as a function of time to determine the optimum design point for biogas digester designers, which is the time required for the manure to produce 80% of maximum biogas [14].
2.4 Biogas analysis for methane and carbon dioxide content
Biogas methane and carbon dioxide contents were determined twice a week on each reactor using an SRI 8610C gas chromatograph with an Haysep D column and flame ionisation detection and electron capture detection, with nitrogen as a carrier gas. Calibration was done using standard methane concentrations of 100, 300 and 10 000 ppm respectively and 500 ppm carbon dioxide gas.
3. Results and discussion
3.1 Manure drying front and water loss
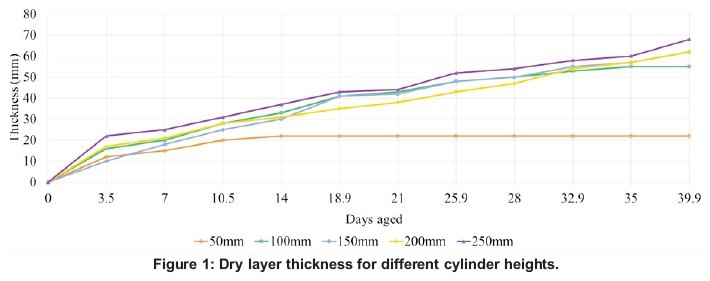
The manure dried downward and inward towards the centre of the container as water evaporated. During the drying period, gas pockets formed in the wet part of the manure, indicating gas formation during drying and aging. Mass loss associated with gas formation was also measured. Figure 1 shows the thickness of the dry layer as a function of time for each container depth tested. The drying mechanism can be described by diffusion, liquid/vapour diffusion and capillary action within the porous region of the manure. Drying of agricultural products can be described by typical drying curves that illustrate the temperature, drying rate and moisture ratios as a function of time. These curves are divided into the constant rate, first falling rate and second falling rate periods as a function of time [15]. The nature of the manure and the moisture content determine the rate of diffusion through the porous media represented by the manure. The drying mechanism can, however, change with changing physical structure of the manure as it dries.
The 50 mm container lost no further mass after 14 days of exposure. The 100, 150, 200 and 250 mm high containers showed a constant rate of moisture loss. This is an indication that the rate-controlling mechanism is diffusion of moisture from the remaining wet manure, rather than diffusion through the dry layer.
After 40 days of aging the manure in the open air, the 50, 100, 150, 200 and 250 mm containers had a manure dry layer thickness of 22, 55, 61, 62 and 68 mm respectively. The 50 mm container had a dry layer thickness of 22 mm as well as empty space (28 mm) as the manure shrunk. The water loss for the different cylinder heights is illustrated in Figure 2 in terms of weight percentage lost.
The drying of the 100, 150, 200 and 250 mm containers followed the constant rate curves. After 14 days of drying, the 50 mm container started to move to the first falling rate period when the moisture content decreased to its critical moisture content (where the constant rate ends) and there was little further water loss.
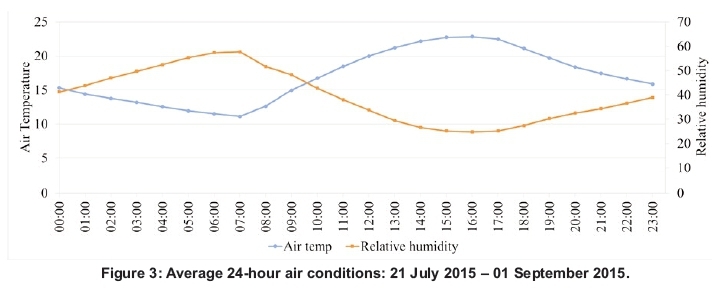
Figure 3 indicates the average 24-hour profile of the air temperature and the relative humidity at the sample location. The drying process took place during winter - 21 July 2015 to 01 September 2015. During this period the air temperature reached a daily minimum of 11 °C and a daily maximum of 23 °C on average. The relative humidity ranged from 25 to 58% on average. No rainfall was recorded for the period.
3.2 Total solids, volatile solids and crude protein of manure in manure samples
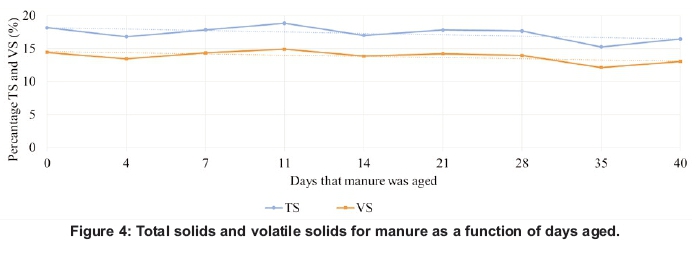
The TS and VS were plotted as a function of the number of days for which the manure sample was aged, as indicated in Figure 4. Linear regression was applied through the data points with a trend line showing the linear correlation between the different data points. The trend lines show a slightly negative slope of -0.21 and -0.18 for both the TS and VS respectively, but with correlation coefficients of only 0.30 and 0.35 respectively. It is unclear whether the reduction is due to drying of the manure or to aging of the remaining wet manure, as the samples used for analysis consisted of a mixture of dry and wet manure when the sample was homogenised before the BMP test. The nitrogen and CP contents of all the samples were, however, almost constant at averages of 2.5 and 15.5% respectively.
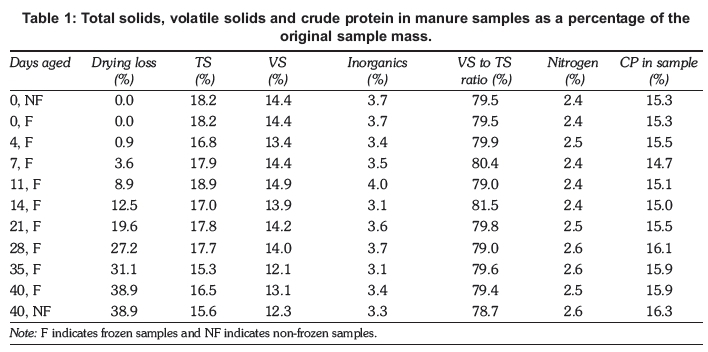
Table 1 presents the composition of the samples from the 150 mm containers used for the BMP tests. The first column also distinguishes between samples that were frozen and those that were not. The fresh manure sample did not experience water loss and was used as a control.
3.3 Biogas produced: Biochemical methane potential results
The fresh manure that was not frozen and the manure aged to 40 days and not frozen were both seeded with different rumen sources. The frozen manure samples were all seeded with the same rumen source. Three rumen sources taken on different days were, therefore, used to seed the digester bottles with anaerobic bacteria to speed up the AD process. The fresh manure sample that was not frozen was initially digested for 85 days and showed no measurable gas formation after 41 days. It was, therefore, decided to end the BMP test after 41 days for all the other samples. It was also observed that most of the biogas was produced within the first five days after the start of the BMP test.
The different manure samples were analysed for the AD process performance in terms of accumulated biogas volume produced and the methane and carbon dioxide contents. The biogas produced by pure rumen samples was then deducted from the accumulated average biogas formation of each sample to determine net gas yield.
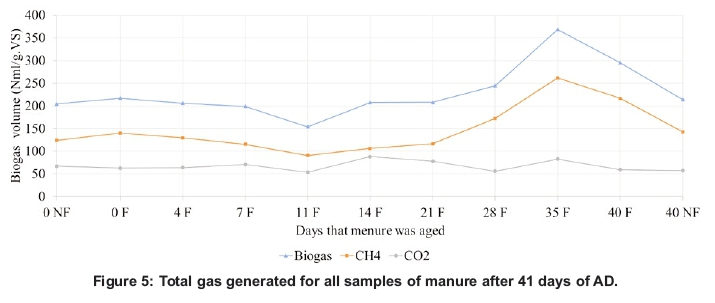
In Figure 5 the net total gas generated as well as the methane and carbon dioxide volumes for all the samples of manure after 41 days of AD is shown as a function of the manure age. The total methane volumes increased for the samples after the 21 days aging, whereas the total carbon dioxide volumes remained more or less constant.
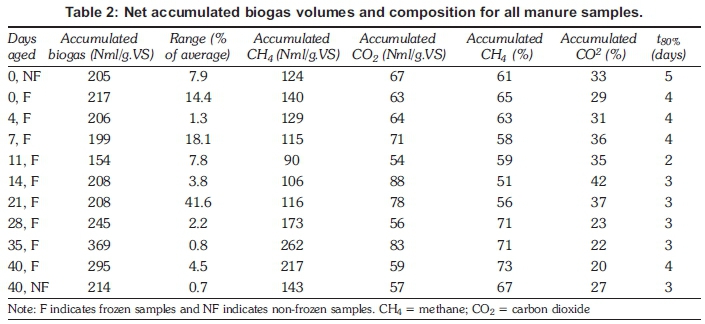
In Table 2 the accumulated biogas volumes as well as the total methane and carbon dioxide volumes are shown for all the samples. The table also shows the total methane and carbon dioxide as a percentage and the time required for the sample to produce 80% of its maximum biogas (t80%) over the 41 days of each sample [14]. The t80% is used as an indication of the evolution of biogas formation over a specific time period. The range (maximum biogas-minimum biogas) is expressed as a percentage of the average of the duplicate digesters. The considerable range for some of the samples may explain the lack of a clear trend in Figure 5.
Table 3 gives the accumulated biogas volumes and composition of the gas for the rumen samples that were used in the AD process after 41 days.
The gas formation of the three different rumen samples was also monitored for 41 days and showed no measurable gas formation after 41 days of AD. The initial pH for the BMP tests was 7.0 and this reduced to 5.5 after 41 days. An average of 5 g in weight of the digester mass was lost after the BMP test and this weight loss was also an indication of the VS that was converted into biogas.
The aged (41 days) and fresh manure that were not frozen produced approximately similar biogas volumes. Some of the frozen samples of manure produced significantly higher volumes than those that were not frozen, the average of all the samples with freezing being 240 Nml/g VS. It is assumed that the freezing process broke down the cell walls of the manure to allow easier conversion of the VS and, as the freezing of manure as a pre-treatment on industrial scale would require a high energy input, this aspect was not investigated further.
The experimentally determined rate of biogas production correlated closely to the Gompertz equation as described by Budiyono et al [16]. The correlation coefficient between the experimentally determined biogas production rate and the Gompertz equation biogas production rate ranges between 0.98 and 0.99 for all the differently aged manure samples.
4. Conclusions
There was no significant difference in the biogas production nor biogas production rate for cattle feedlot manure from fresh up until aging to 41 days. The aging of cattle feedlot manure has major positive implications for the handling and pre-processing of manure from cattle feedlots as it relates to designing biogas production processes.
References
[1] Deublein, D. and Steinhauser, A. Biogas from waste and renewable resources, 2011, Weinheim: WILEY-VCH. [ Links ]
[2] Tauseef, S.M., Premalatha, M., Abbasi, T. and Abassi, S.A. Methane capture from livestock manure, Journal of Environmental Management, 2013, 117: 187-207. [ Links ]
[3] Chynoweth, D.P, Turick, C.E., Owens, J.M., Jerger, D.E. and Peck, M.W. Biochemical methane potential of biomass and waste feedstocks, Biomass and Bioenergy, 1993, 5(1): 95-111. [ Links ]
[4] Dechrugsa, S., Kantachote D. and Chaiprapat, S. Effects of inoculum to substrate ratio, substrate mix ratio and inoculum source on batch co-digestion of grass and pig manure, Bioresource Technology, 2013, 146: 101-108. [ Links ]
[5] Al Seadi, T., Rutz, D., Prassl, H., Kottner, M., Finsterwalder, T., Volk, S. and Janssen, R., Biogas handbook, 2008, Denmark: University of Southern Denmark Esbjerg. [ Links ]
[6] Triolo, J.M., Sommer, S.G., Moller, H.B., Weisbjerg, M.R. and Jiang, X.Y. A new algorithm to characterize biodegradability of biomass during anaerobic digestion: influence of lignin concentration on methane production potential, Bioresource Technology, 2011, 102: 9395-9402. [ Links ]
[7] Amon, T., Amon, B., Kryvoruchko, V., Zollitsch, W., Mayer, K. and Gruber, L. Biogas production from maize and dairy cattle manure - influence of biomass composition on the methane yield, Agriculture, Ecosystems and Environment, 2007, 118: 173-182. [ Links ]
[8] Siddique, N.I., Abd Munaim, M.S. and Zularisam, A.W. Mesophilic and thermophilic biomethane production by co-digesting pretreated petrochemical wastewater with beef and dairy cattle manure, Journal of Industrial and Engineering Chemistry, 2014, 20: 331-337. [ Links ]
[9] Horwitz, W. Official methods of analysis of AOAC International, 17th edition, 2000, Gaithersburg, Maryland. [ Links ]
[10] Owen, W.F, Stuckey, D.C., Healy, J.B., Young, L.Y. and McCarty, P.L. Bioassay for monitoring biochemical methane potential and anaerobic toxicity, Water Research, 1979, 13: 485-492. [ Links ]
[11] Hansen, T.L., Schmidt, J.E., Angelidaki, I., Marca, E., Jansen, J.C., Mosbaek, H. and Christensen, T.H. Method for determination of methane potentials of solid organic waste, Waste Management, 2004, 24: 393-400. [ Links ]
[12] Esposito, G., Frunzo, L., Liotta, F, Panico, A. and Pirozzi, FF Bio-methane potential tests to measure the biogas production from the digestion and co- digestion of complex organic substrates, The Open Environmental Engineering Journal, 2012, 5: 1-8. [ Links ]
[13] Wilkie, A.C., Smith, PH. and Bordeaux, FM. An economical bioreactor for evaluating biogas potential of particulate biomass, Soil and Waste Science Department, University of Florida, 2003. [ Links ]
[14] Hesketh, A. Talbot & Talbot - BMP assay report 163/13, Talbot & Talbot (Pty) Ltd, 2013, Pietermaritzburg. [ Links ]
[15] Onwude, D.I., Hashim, N., Janius, R.B., Nawi, N.M. and Abdan, K. Modeling the thin-layer drying of fruits and vegetables: A review, Comprehensive Reviews in Food Science and Food Safety, 2016, 15(1): 599-618. [ Links ]
[16] Budiyono, I.N., Widiasa, S.J., and Sunarso, S. The kinetic of biogas production rate from cattle manure in batch mode, International Journal of Chemical and Biological Engineering, 2010, 3(1): 39-44. [ Links ]
* Corresponding author: Tel.: +27 12 420 3824: email: gerrit.kornelius@up.ac.za

