


Services on Demand
Article
 English (pdf)
 Article in xml format
 Article references
Indicators

Related links
-
 Cited by Google
 -
 Similars in Google
Share

 Permalink
Journal of Energy in Southern Africa
On-line version ISSN 2413-3051
Print version ISSN 1021-447X
J. energy South. Afr. vol.28 n.3 Cape Town Aug. 2017
http://dx.doi.org/10.17159/2413-3051/2017/v28i3a1602
ARTICLES
Optimising concentrated thermal photovoltaic energy systems for green and sustainable energy generation
Olufunmilayo Alice MafimidiwoI, II, *; Akshay Kumar SahaII
IDepartment of Electrical/Electronics Engineering, School of Engineering, Yaba College of Technology, 2 Hussey Street, Herbert Macaulay Way, P.M.B. 2011, Yaba Lagos, Nigeria
IIElectrical, Electronic and Computer Engineering, School of Engineering, Howard College Campus, University of KwaZulu-Natal, Durban 4001, South Africa
ABSTRACT
Electricity generated from a concentrated thermal photovoltaic system can be improved upon for optimum output. This investigation considered the various options of optimising system operation via effective control of the operating conditions. It examined various options of varying the system configurations for optimised system efficiency and power output and at minimum operating costs. The number of mirrors and photovoltaic cells for use in the concentrated thermal photovoltaic system were set at eight as standard for the system operation. This number was varied down and up (from eight to six and then from eight to ten) to study the effects of these variations on the concentrated thermal photovoltaic system efficiency and generated power output. A novel thermal model was built in two dimensions and was used to simulate the thermal performance of the concentrated thermal photovoltaic modules. The parameters used for the materials involved were defined and the appropriate physics applied in the study of various operating conditions that affected the system performance for the two-dimensional system were stated. The results showed that temperature rise was least in the ten mirrors configuration and highest in the six mirrors configuration. The six PV cells-mirrors configuration, however, generated the highest power output of the three different configurations considered. The six PV cells/mirrors configuration utilised the least numbers of mirrors and PV cells out of the three configurations, ultimately translating to reduced-materials cost for the operation. Based on these findings, the choice of the lower number of six mirrors and six PV cells was considered the most economical and, therefore, most desirable.
Keywords: optimal output; concentrated thermal photovoltaic system; operating conditions; two-dimensional system; efficiency and power output
1. Introduction
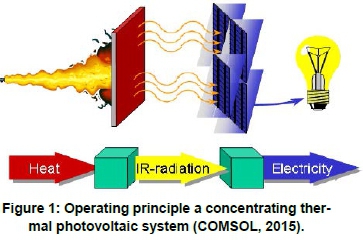
Solar energy irradiation can be converted directly into electricity through the use of photovoltaic (PV) systems or, as in the case of concentrated photovoltaic (CPV), through the use of concentrating devices to produce high temperature heat which are focused on the PV module for electricity generation. In CPV plants, solar radiation is not focused directly on the PV module but through the concentrators. The receiving devices used to concentrate the sun's radiation on the PV cells are called concentrating solar collectors or, simply, concentrators, which are either mirrors or lenses; and the irradiation is in the form of heat. In concentrating thermal photovoltaic (CTPV) systems, the prospect of the CPV technology is being assessed from the thermal point of view. The concentrated light is converted to high temperature heat which drives a heat engine (usually a steam turbine) connected to an electrical power generator and electricity is generated (Renno & Petito, 2013). The plants, then, consist of two stages: the first collects solar energy and converts it to high temperature heat, the second converts the heat energy to electricity, as represented in Figure 1. This is different from what obtains in CPV plants, where the CPV plant generates power by focusing solar radiation using concentrators (usually parabolic dish mirror systems or a large array of flat Fresnel lenses) onto a PV module, which converts the radiation directly to electricity. The direct current electricity generated by the PV cells is then converted to alternating current using a solid state inverter. The four types of concentrating (thermal) photovoltaics available are the parabolic dish, the parabolic trough collector, the power tower (heliostat field focusing on a central receiver) and the compact linear Fresnel reflector (CLFR) (Zhang et al., 2013).
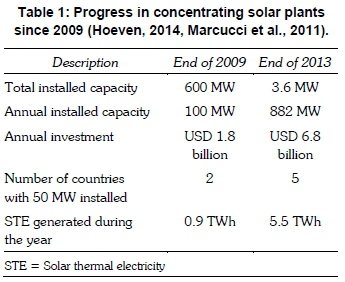
The CPV or CTPV solar energy is relatively new when compared with PV solar energy, but it has been in existence since 2010 and steady progress is being made (Hoeven, 2014), evidenced by the concentrated solar power generated in 2009 and 2013 respectively, as given in Table 1. The most developed technology in a concentrated (CPV or CTPV) system is the parabolic trough, with over 20 years of operation in California (Zhang et al., 2013). The other concentrated technology options were only constructed in the last few years, but appear promising as well. For instance, the CLFR types are much simpler to build and are potentially cheaper on a large scale (Singh, 2013; Marcucci et al., 2011). Concentrated solar power looks appropriate as a solar energy option for reducing climate change; it generates electricity and produces no greenhouse gas emissions, so it could be a key technology. In addition, CSP plant is flexible and enhances energy security as it has thermal storage ability that ensures firm electric capacities and time-shifting electricity generation.
The cumulative CSP capacity is 2304 megawatts (MW) to date (Hoeven, 2014), with Spain leading, followed by the United States and United Arab Emirates (Zhang et al., 2013). Other plants in the construction stage are in Morocco and South Africa, and there are smaller solar fields regularly integrated in larger fossil fuel plants in Algeria, Australia, Egypt, Italy, Iran and Morocco. The rest of the world is yet to consider the CSP option (Hoeven, 2014).
The CSP plants, unlike PV technologies, can use steam turbines to provide all the needed ancillary services and dispatchable energy, such as voltage support, frequency response, ramping reserves, regulation and spinning reserves (Hoeven, 2014). These plants, moreover, have an inherent capacity to store thermal energy for later conversion to electricity. When CSP is combined with thermal storage capacity of several hours of full-capacity generation, the CSP plants can continue to produce electricity, undisturbed even when clouds block the sun, or after sundown, or in the early morning when power demand steps up (Greenhut, 2010; Hoeven, 2014). The different technologies deployed in CSP plants to generate electricity are indicated in Table 2. They possess significant potential for supplying specialised demands such as process heat for industry, co-generation of heating, cooling and power; and water desalination (Hoeven, 2014).
The purpose of the present work is to model, simulate and analyse the CTPV system for best system operation performance. This involves determining the two-dimensional (2D) temperature distributions in the CTPV panel, interpreting the obtained results and applying it as a guide in similar work environment. The aim is to maximise radiation heat in order to improve efficiency. Low efficiency is attributable to inherent radiation losses, which are not converted to electric power, and the PV cells' increased temperature. These two factors are undesirable combinations (Dubey and Tiwari, 2008; Sar-haddi et al., 2010) that need to be minimised by using high-efficiency PV cells, although the high cost is a challenge. In order to reduce costs, engineers and researchers now try to work with smaller-area PV cells and then use mirrors to focus the radiation on the PV cells. There is, however, a limit to the intensity of beams that can be focused safely on these cells: if the radiation intensity becomes too high, the cells could overheat and burn out. The need to optimise system geometry and operating conditions to achieve maximum performance and power output is, therefore, the motivating factor for this study.
The method adopted was the use of modelling and simulation in designing and developing the CTPV system. The tool flow in COMSOL Multiphys-ics was used to achieve this and to solve the various related scientific and engineering equations. Various studies were performed to evaluate the electrical and thermal performances of the module under heat transfer with surface-to-surface radiation, using the developed model. The basic modelling workflow in COMSOL provided a powerful integrated desktop environment with a model builder where the full overview of the model and access to all functionality was obtained. The conventional model was extended for the type modelled with its physics integrated into Multiphysics models that can solve coupled physics phenomena. This possesses built-in physics interfaces and advanced support for material properties. The models were built in two dimensions, and the relevant physical quantities, such as material properties, and the underlying equations were defined. The variables, expressions, or numbers were directly applied to solid and fluid domains, boundaries, edges, and points independently of the computational mesh.
For high-efficiency cell designs, the 2D and/or 3D simulations are required as they are necessary for correct interpretation of 2D/3D finite element analysis of electrical, optical and thermal properties of compound and silicon semiconductor devices and are reliable for achieving accurate results (Kuhlmann et al., 2000). One-dimensional simulations are usually inadequate for conventional geometry solar cells, especially at high intensities.
2. Energy analysis of a concentrating thermal photovoltaic system
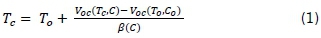
The working conditions of the CTPV system are primarily influenced by the cell temperature and its efficiency. The efficiency of a CTPV device normally ranges from 1-20% (COMSOL, 2015). The inherent radiation losses not converted to electric power contributed to the PV cells' increased temperature, so PV efficiency is inversely related to the operating temperature. Furthermore, heat transfer through conduction taking place in the system also brings about increased cell temperature, so the CTPV would not be able to maximise radiation heat transfer for improved efficiency. This condition of increased cells temperature is to be minimised as much as possible. The temperature determination is complex because of the illumination characteristics and the cell construction technology involved. Based on some experimental results obtained by Renno and Petito (2013), equations that could uniquely express the cell temperature in terms of the concentration factor C, were made possible through the derived equations. The cell temperature is expressed as given in Equation 1 (Luque et al., 1998).
where
Tc= cell temperature
T0 = environment temperature
Voc (Tc, C) = open circuit voltage function of the cell temperature and concentration factor
Voc(T0, C0) = open circuit voltage function of the environment temperature with concentration factor of 1
β (C) = voltage thermal coefficient
The knowledge of the parameters in Equation 1 were empirically obtained from the experimental diagrams of the variables examined by Steiner et al. (2011). The open circuit voltages were found to be dependent on the cell temperature that represents the unknown. This problem was overcome by Cotal et al. (2009) and Renno and Petito (2013) who deduced a graphical relationship where Vocwas found to depend only on the concentration factor. Hence Vocis expressed as given in Equation 2.

According to Steiner et al. (2011), the voltage thermal coefficient also depends on C and it is calculated according to Equation 3.

Based on these assumptions, the cell temperature is given by Equation 4.

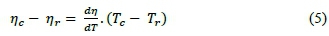
Once the cell temperature becomes known, then, cell efficiency could be determined. Similarly, in order to define a theoretical equation between the quantities examined, some experimental diagrams obtained by Steiner et al. (2011) were used. These show that the efficiency decrease when the concentration factor increases at the same cell temperature. The cell efficiency is given by Equation 5.
where
Tr= reference temperature and it is equal to 25 °C or 298 K
Nr= reference efficiency corresponding to the concentration factor chosen.  = -0.09167 + 0.005787.ln (C)
The  is only applicable for C factors greater than 30 (where C > 30) and in accordance to the curves analysed.
3. Thermal model implementation of CTPV through the use of COMSOL Multiphysics
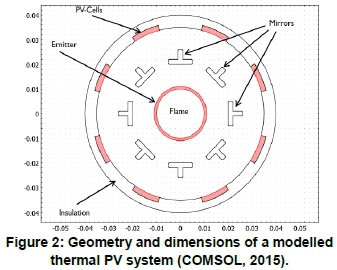
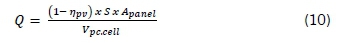
The CTPV system utilises a concentrating medium to generate electricity from the combustion of fuel and through radiation. Figure 1 shows the operating principle of a CTPV system in which heat is converted to electricity by transfer through a medium (COMSOL, 2015), while Figure 2 is the modelled version of the CTPV system in Figure 1. It depicts its geometry and the general operating principle wherein the CTPV cell generates electricity from the combustion of fuel, through radiation of heat (flame) at the centre on the concentrators. Similar CTPV systems were modelled in 2D to study the operation and temperature distribution effects on CTPV systems, as shown in Figures 3(a), (b) and (c). The fuel burned from inside an emitting device that radiates the heat intensely and the PV cells captured the radiation and converted it to electricity. The material properties involved had to be defined, as the temperature distributions depend on the materials in general (Yahyavi, et al., 2010). The materials involved for this modelling were: the heater, emitter, PV cell type, the mirrors, the insulation attached to the PV cells, and the prevailing environmental conditions. The type of material used determines the PV cells' limited operating temperature. The influence of operating conditions (flame temperature) on CTPV system efficiency and the temperature of components in the CTPV system were investigated by using the heat transfer application, which uses surface-to-surface radiation interface (Peter et al., 2015).
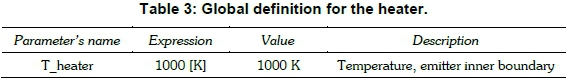
The PV cells were assumed to be water-cooled on their back-side (the interface with the insulation) to reduce the temperature. Since there was flow of heat on the different boundaries, then heat transfer by conduction was present. The emitter was simulated with a specific temperature, Theater, on the inner boundary by the model as indicated in Table 3. Radiation (surface-to-surface) in the boundary condition was taken into consideration at the outer emitter boundary. The global definition for the PV cell is specified as indicated in Table 4. The mirrors were simulated by taking radiation into account on all boundaries and applying a low emissivity to it as indicated in Table 5.
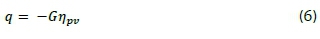
Radiation boundary conditions were applied to the inner boundaries of PV cells, as well that of the insulation. The PV cells, however, have a higher emissivity than that of the insulation. The PV cells, furthermore, convert a fraction of the irradiation to electricity instead of heat. Heat sinks were situated on their inner boundaries to account for a boundary heat source, q, which is defined in Equation 6.
where
G = irradiation flux (W/m2) η ρν = voltaic efficiency of the PV cell.
4. Methodology
Modelling and simulation of CTPV system
The defined geometry, definition, dimensions and meshing were initiated in a 2D model using COM-SOL Multiphysics, version 5.1. The 2D model of the thermal CTPV was first modelled as a circle and the other materials were also modelled as shapes represented and shown in Figure 2. The materials geometries and dimensions of the CTPV system modelled for study are as presented in Figures 3(a), (b) and (c). The PV cells were water-cooled on their backside (the interface with the insulation) to reduce the temperature. Conduction was always present since there was flow of heat on the different boundaries. The emitter was simulated with a specific temperature, Theater, on the inner boundary by the model as indicated in Table 3. Radiation (surface-to-surface) in the boundary condition was taken into consideration at the outer emitter boundary.
The global definition for the heater is presented in Table 3, while the global definition for the PV cell is specified as presented in Table 4. The material properties presented in CTPV modelling, such as the mirrors, PV cells, insulation and emitter are as defined in Table 5 and were simulated by taking radiation into account on all boundaries.
Materials specifications
The materials described in Table 5 were used for the modelling and simulation. These consist the emitter having a specific temperature, Theater, on the inner boundary and the mirrors that take radiation into account on all boundaries with assumed low emissiv-ity. Furthermore, the PV cells were assigned with a high emissivity value and the insulation with a low emissivity value. Their relevant material properties are appropriately referenced in Table 5.
Heat transfer and associated equations
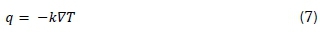
The heat transfer equations for solid and fluid domains are defined by Equations 7 and 8 (Siddiqui et al., 2012).

The voltaic efficiency of the PV cells, η ρν , is a function of the ambient temperature T, and it is defined by Equation 9.
where
ρ = the density
Cp= specific heat capacity
T = temperature, t is the time
k = thermal conductivity
q = heat transferred by conduction
Q = internal heat generation
u = fluid velocity
A percentage of the absorbed solar radiation is converted to electrical energy, while the remaining energy raises the temperature of the PV cells. The absorbed solar radiation is applied to the heat transfer equation of the PV cell layers as an internal heat generation, Q, which can be determined using Equation 10 (Siddiqui et al., 2012).
where
ηρν= the electrical efficiency of the PV panel
Apanel = the front area of the PV panel
Vpccell = the volume of the PV cells in the panel
Heat transfer with surface-to-surface radiation interface application was used to investigate and study the influence of operating conditions (flame temperature) on system efficiency and electric output power in a typical CTPV system. The influence of geometry changes on the system, such as the number of materials used or the specifications given on these materials, was also considered. In addition, the effects of varying the number of mirrors used on the temperature distribution, the efficiency and the electrical power output of the CTPV system was investigated.
The model simulated the emitter with a specific temperature, Theater, on the inner boundary. At the outer emitter boundary, (surface-to-surface) radiation was taken into account in the boundary condition. The mirrors were simulated by taking radiation into account on all boundaries and applying a low emissivity on the mirror. Conduction is always present on the different boundaries. The inner boundaries of the PV cells and of the insulation also utilised radiation boundary conditions. The PV cells with assigned high emissivity value were made to convert a fraction of the irradiation to electricity instead of heat, while the insulation was assigned a low emis-sivity value as indicated in Table 5.
The heat sink on the inner boundaries of the PV cells simulated water-cooling on the PV cells to convert a fraction of the irradiation to electricity instead of heat. This was made possible by accounting for a boundary heat source, q, as defined in Equation 6 within the ambient temperature as indicated in Equation 7. The efficiency of the PV cells, ηρν At the outer boundary of the PV cells, the con-vective water-cooling was applied by the model to avoid PV cells from over-heating by setting the parameters as in Equations 11 and 12.


At the outer boundary of the insulation, convective cooling was applied with parameters given by Equations 13 and 14.


A variety of physics applied in the modelling work and the equations governing the applications to various selections such as domains, boundaries, edges and points on the materials used as found applicable, are put in tabular form as indicated in Table 7.
Two-dimensional (2D) thermal modelling and simulation of a CTPV system
For cost control purpose, a small area of PV cell was sufficiently utilised in the 2D thermal modelling and simulation of the CTPV system. The material properties for each of the CTPV configurations modelled were the same as summarised in Table 5. The aim was to optimise system geometry and operating conditions to achieve maximum performance (efficiency and power output) at minimum material costs. As earlier illustrated in Figure 2, the mirrors were used to focus the radiation from the heat source on these PV cells for greater concentration and intensity. However, there was a limit to how much of the light beams that could safely be focused on the PV cells because too high radiation intensity could overheat the cells. In order to study the effects of this variation on the CTPV system efficiency and generated power output, the number of mirrors and PV cells used were varied from eight to six and then to ten. To achieve this, the PV system was assigned a higher emissivity value while the insulation and the mirrors were assigned lesser emissivity values (Table 5). The effect of change in configuration in the number of mirrors and PV cells used was examined. The findings are displayed in Figures 3 to 6 and the results were discussed upon and the conclusions were drawn.


5. Results and discussion
Behaviours of the modelled 2D configurations
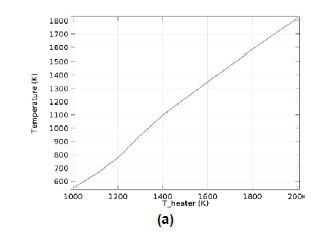
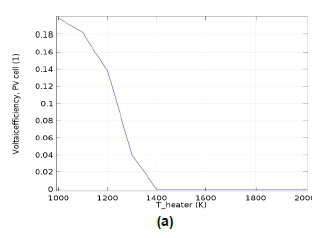
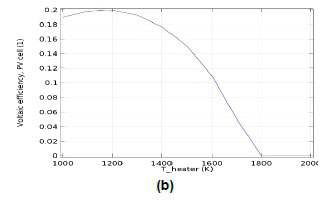
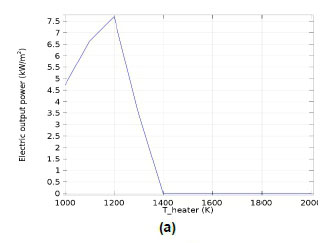
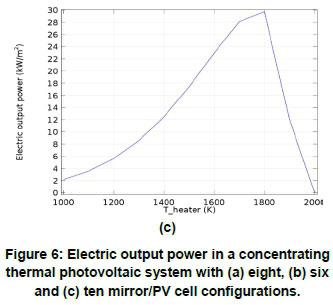
The results in Figures 3(a), (b) and (c) show the visual temperature distribution (stationary) for the CTPV systems with eight, six and ten mirrors, respectively, that were subjected to operating emitter temperature conditions of 2000 K. The structure with eight numbers of mirrors was set as the standard and the geometry was built with initial same number of eight numbers of mirrors and PV cells and other materials. The results showed that the CTPV system experienced a remarkable temperature distribution that varied almost linearly with the operating conditions. The stationary temperature distributions are graphically represented in Figures 4(a), (b) and (c), where the PV cells reached temperature values of 1820, 1880 and 1700 K for the systems with eight, six and ten mirrors respectively. These were significantly higher than their best operating temperatures of 780, 1300 and 1300 K for the respective eight, six, and ten mirrors, if extrapolated with Theater of 1200, 1600, and 1800 K respectively. These yielded a system output power of 7800, 31800 and 29800 W/m2 as shown in Figures 6(a), (b) and (c) respectively at the operating temperature of 1200, 1600, and 1800 K. Above each of these Theatervalues, their corresponding output power began to drop sharply and eventually came to zero at 1400, 1800 and 2000 K for the eight, six and ten mirror configurations in Figures 6(a) (b) and (c) respectively and their photovoltaic efficiency collapsed to zero accordingly in each case, as shown in Figures 5(a), (b) and (c). The graphs in Figures 6 illustrate Theaterat which the system attained the maximum electric power output for the system with eight, six and ten mirrors respectively.
Analytic comparison of 2D CTPV geometry with eight number of mirrors and PV cells
In the CTPV system with eight mirrors/PV cells configuration, Figure 3a indicates the stationary temperature distribution on CTPV system with the eight mirrors configuration with temperature range of 1400 K from the source of the heat (centre) down to the insulation (outer boundary) with temperature of 800 K. Figure 4a is where the PV cells experienced temperature distribution from 500 K to approximately 1800 K. Figure 5a shows that Theaterwas 1400 K, already indicated on Figure 3a, which is appreciably higher than the maximum temperature of 1200 K. The increase of the operating temperature to above 1200 K as in Figure 6a caused a sharp decline in the output power of the CTPV system from 7800 W/m2 to zero at an operating temperature of 1400 K and above. The optimum operating temperature for the heater, at which the CTPV system achieved maximum electric power output, was 1200 K, as shown in Figure 6a. At this temperature, the PV cells reached a temperature of approximately 780 K, as shown in Figure 4a, which they could withstand. The best operating condition (emitter temperature) and the PV cells temperature for optimal output power (7800 W/m2) were, therefore, respectively 1200 and 780 K. It can be inferred that any system operation outside these temperature ranges is a waste of resources because the output power becomes zero and therefore needs to be avoided. The optimal efficiency obtained was 19.8% as shown in Figure 5a.
Analytic comparison of 2D CTPV geometry with six number of mirrors and PV cells
In the CTPV system with six mirrors/PV cells configuration, Figure 3b indicates the stationary temperature distribution on the system with the eight mirrors configuration with temperature range of 1800 K from the source of the heat (centre) down to the insulation (outer boundary) with temperature of 900 K.
The PV cells in Figure 4b experienced a temperature distribution from 600 K to approximately 1900 K. The operating temperature in Figures 5b, was 1800 K, already indicated on Figure 3b, which is appreciably higher than the (heater) maximum temperature of 1600 K. An increase in the operating temperature above 1600 K as in Figure 6b resulted in a sharp decrease in the output power of the CTPV system from 31800 W/m2 to zero at an operating temperature of 1800 K and above. The optimum operating temperature (for the heater), at which the CTPV system achieved maximum electric power output, was 1600 K as shown in Figure 6b. At this temperature, the PV cells reached a temperature of approximately 1300 K, as shown in Figure 4b, which they could withstand. The best operating condition (emitter temperature) and the PV cells temperature for optimal output power (31800 W/m2) were, consequently, 1600 K and 1300 K respectively. It can similarly be inferred that any system operation outside these temperature ranges is only a waste of resources because the output power becomes zero and should, therefore, be obviated. The optimal efficiency obtained was 19.8% as shown in Figure 5b.
Analytic comparison of 2D CTPV geometry with ten number of mirrors and PV cells
Figure 3c in the CTPV system with ten mirrors/PV cells configuration indicates the stationary temperature distribution on CTPV system with the eight mirrors configuration with temperature range of 2000 K from the source of the heat (centre) down to the insulation (outer boundary) with temperature of 1000 K. The PV cells in Figure 4c experienced a temperature distribution from 450 K to approximately 1700 K. The operating temperature of 1800 K in Figures 5c, already indicated on Figure 3c, is appreciably higher than the (heater) maximum temperature of 1800 K. Increasing the operating temperature above 1800 K as in Figure 6c caused an acute decrease in the output power of the CTPV system from 31800 W/m2 to zero at an operating temperature of 2000 K and above. The optimum operating temperature (for the heater) at which the CTPV system achieved maximum electric power output was 1600 K as shown in Figure 6b. The PV cells at this temperature recorded a temperature of approximately 1300 K, as shown in Figure 4b, which they could withstand. The best operating condition (emitter temperature) and the PV cells temperature for optimal output power of 29800 W/m2 were respectively 1800 and 1300 K. A similar inference to that in Sections 4.2 and 4.3 can be made. The optimal efficiency obtained was 19.8%, as shown in Figure 5c.
6. Conclusions
The results in Figures 3 to 6(a, b and c) showed that, in all cases, the CTPV system attained the same efficiency of 19.8%. From the summary and analysis given in Table 9, and the fact that all configurations use the same defined modelling parameters, the better option is between the six mirrors and the ten mirror configurations. The power generated in the six mirrors was 31800 W/m2 and that of the ten mirrors was 29800 W/m2. Furthermore, the percentage temperature deviation increased by 45% and 31% for the six and eight mirrors respectively. In addition, comparison of the temperature deviation on the subjected operating conditions with those considered as the best operating conditions, indicated that the percentage increase deviations were 16.7, 12.5 and 11.1% respectively for the eight, six and ten mirror configurations. Thus, the ten PV cells/mirrors had the least temperature rise, which is desirable.
The six PV cells/mirrors configuration, however, generated the highest power output of the three configurations. In addition, the configuration used the least numbers of mirrors and the PV cells out of the three configurations, with a subsequent reduction in materials costs. The use of mirrors to intensify radiation made the choice of lower number of six mirrors and six PV cells the most desirable.
References
Anjali, S., Avasthi, D.V., Tejbir, S. and Durgesh, K. 2014. Design of a thermophotovoltaic system optimised surface radiative and conductive heat flux. International Journal of Emerging Trends in Engineering and Development 4(4). Available online on http://www.rspublication.com/ijeted/ijeted_index.htm. [ Links ]
COMSOL, AB. 2012. COMSOL multiphysics user's guide, Version 4.3. Available online at http://www.comsol.com.ed., 22 Version. Viewed June 2015. [ Links ]
COMSOL, AB. 2015. Thermo-photo-voltaic cell, Application library path: Heat_transfer_module/ther-mal_radiation/tpv_cell. COMSOL Multiphysics user's guide, Comsol, Version 5.1. Available online at: http://www.comsol.com. ed., 22. Viewed June 2015. [ Links ]
Cotal, H., Fetzer, C., Boisvert, J., Kinsey, G., King, R., Hebert, P and Karam, N. 2009. The III-V multijunc-tion solar cells for concentrating photovoltaics. Energy & Environmental Science 2: 174-192. [ Links ]
Dubey, S. and Tiwari, G. 2008. Thermal modeling of a combined system of photovoltaic thermal solar water heater. Solar Energy 82: 602-612. [ Links ]
Greenhut, A. D. 2010. Modeling and analysis of hybrid geothermal-solar thermal energy conversion systems. Massachusetts Institute of Technology. [ Links ]
Hoeven, M. 2014. Solar thermal electricity - technology roadmap. International Energy Agency, 75015 Paris, France. 1-52. [ Links ]
Kuhlmann, B., Aberle, A.G., Hezel, R. and Heiser, G. 2000. Simulation and optimization of metal-insulator-semiconductor inversion-layer silicon solar cells. IEEE Transactions on Electron Devices 47: 21672178. [ Links ]
Luque, A., Sala, G. and Arboiro, J. 1998. Electric and thermal model for non-uniformly illuminated concentration cells. Solar Energy Materials and Solar Cells 51: 269-290. [ Links ]
Marcucci, A. and Turton, H. 2011. Solar energy perspectives in renewable energy. In Renewable Energy Technologies, ed. Printed in Luxembourg by Impri-merie Centrale: International Energy Agency Publications: 1: 5-288. ISBN 978-92-6412-457-8. [ Links ]
Peter, N., Kabu, O.E., Stephen, K. and Anthony, D. 2015. 3D finite element method modelling and simulation of the temperature of crystalline photovoltaic module. International Journal of Research in Engineering and Technology 4(9) 378-384. Available online at http://esatjournals.ne1/ijret/2015v04/i09/IJRET20150409070.pdf. [ Links ]
Renno, C. and Petito, F. 2013. Energy analysis of a concentrating photovoltaic thermal system. Energy Science and Technology 6(2) : 53-63. DOI:10.3968/j.est.1923847920130602.2618. [ Links ]
Sarhaddi, F., Farahat, S., Ajam, H., Behzadmehr, A. and Adeli, M.M. 2010. An improved thermal and electrical model for a solar photovoltaic (PV/T) thermal air collector. Applied Energy, 87(7): 2328-2339. DOI:10.1016/j.apenergy.2010.01.001. [ Links ]
Singh G.K. 2013. Solar power generation by photovoltaic technology: A review. Energy 53(May):1-13. Available online at http://www.sciencedirect.com/science/article/pii/S0360544213001758. [ Links ]
Steiner, M., Geisz, J.F., Friedman, D.J., Olavarria, W.J., Duda, A. and Moriarty, T.E. 2011. Temperature-dependent measurements of an inverted metamorphic multijunction solar cell. Photovoltaic Specialists Conference, 37th IEEE: 002527-002532. [ Links ]
Tester, J., Dipippo, R., Field, R., Augustine, C., Frey, K. and Thorsteinsson, H. 2008. Utilisation of low-enthalpy geothermal fluids to produce electric power. Final Report Project, 1. [ Links ]
Usama Siddiqui, M., Arif, A.F.M., Kelley, L. and Dubowsky, S. 2012. Three-dimensional thermal modeling of a photovoltaic module under varying conditions. Solar Energy, 86: 2620-2631. [ Links ]
Yahyavi, M., Vaziri, M. and Vadhva, S. 2010. Solar energy in a volume and efficiency in solar power generation. IEEE International Conference proceedings, IRI 2010: 394-399. DOI: 10.1109/IRI.2010.5558900. [ Links ]
Zhang, H.L., Baeyens, J., Degrêve, J. and Cacêres, G. 2013. Concentrated solar power plants: Review and design methodology. Renewable and Sustainable Energy Reviews 22: 466-481. [ Links ]
* Corresponding author: Tel: +234 802 303 6936; Email: alicemafi@yahoo.co.uk; alicemafi1@gmail.com

