


Servicios Personalizados
Articulo
 Inglés (pdf)
 Articulo en XML
 Referencias del artículo
Indicadores

Links relacionados
-
 Citado por Google
 -
 Similares en Google
Compartir

 Permalink
Journal of Energy in Southern Africa
versión On-line ISSN 2413-3051
versión impresa ISSN 1021-447X
J. energy South. Afr. vol.28 no.3 Cape Town ago. 2017
http://dx.doi.org/10.17159/2413-3051/2017/v28i3a2451
ARTICLES
The impact of political objectives on optimal electricity generation and transmission in the Southern African Power Pool
Philipp A. TrotterI, *; Roy MaconachieII; Marcelle C. McManusI
IMechanical Engineering Department, University of Bath, Claverton Down, Bath BA2 7AY, UK
IIDepartment of Social and Policy Sciences, University of Bath, Claverton Down, Bath BA2 7AY, UK
ABSTRACT
Southern Africa's electrification is at odds with United Nations goals to provide modern energy for all by 2030. Electricity planning, a crucial tool to optimally match future supply and demand, has largely focused on minimising costs in southern Africa, sometimes complemented by a discussion of a discrete set of environmental scenarios. Political objectives, although their significance is well documented, have been overlooked in Southern African Power Pool (SAPP) quantitative electrification planning research. This study created a novel geo-refer-enced, multi-objective linear programming (MOLP) model that combined continuous cost and carbon dioxide (CO2) emission minimisation objectives with the political goal of achieving national electricity self-sufficiency, yielding the optimal trade-off between these three objectives. It solved the MOLP for three different political risk scenarios in order to examine a further political objective. The results revealed a sharp monetary trade-off between CO2 emission reductions and national electricity sovereignty objectives in the SAPP. Furthermore, curtailing international political risks has significant consequences for trade and the optimal generation mix. While the optimal size of the frequently recommended Grand Inga dam in the Democratic Republic of Congo was considerably reduced when either national electricity sovereignty or political risk constraints were imposed on the model, solar energy shares increased significantly in both cases. This was the case especially when CO2 emissions were simultaneously curtailed. Increased technological, institutional and policy-making efforts to implement solar PV at scale would therefore imply immediate political and environmental merits for national governments in the SAPP, and present a sustainable development opportunity for the region.
Highlights:
• Multi-criteria optimisation of Southern African Power Pool energy network reveals novel insights.
• Sharp monetary trade-off between CO2 reduction and national electricity sovereignty.
• Electricity sovereignty and political risk restrictions greatly affect generation mix.
• Solar energy meets electricity sovereignty goals and decreases political risks.
Keywords: multi-criteria optimisation, political risk analysis, Grand Inga dam, energy security, renewable energy
1. Introduction
The United Nations (UN) aims to ensure access to modern energy for all by 2030. Some 630 million people in sub-Saharan Africa currently do not have access to electricity (International Energy Agency 2015b). Despite its promising renewable energy resources, the Southern African Power Pool (SAPP) is no exception. Its electrification rate was 33% in 2012, matching the sub-Saharan Africa average. World Bank figures suggest that nine out of the twelve SAPP countries have a rural electrification rate of under 20% (World Bank 2017).
Robust and multi-criteria electricity planning has been argued to be a crucial prerequisite in Africa (Trotter et al. 2017) to help achieve the UN Sustainable Development Goals. Several previous studies examined adequate Southern African electricity supply options to satisfy the growing demand (Spalding-Fecher et al. 2017; Graeber et al. 2005; International Renewable Energy Agency (IRENA) 2013; Graeber and Spalding-Fecher 2000; Bowen et al. 1999; Sparrow and Bowen 2005; Bhagavan 1985; Nziramasanga et al. 2013). These studies constitute a part of the growing literature on international African electricity planning optimisation (Rose et al. 2016; Zeyringer et al. 2015; Ohiare 2015; Ohijeagbon and Ajayi 2015; Gnansounou et al. 2007; Taliotis et al. 2016; Sanoh et al. 2014; Taliotis et al. 2014; Trotter 2017). Yet, while this literature has greatly fostered a better understanding of optimal future African electricity options, their underlying optimisation objective functions focused almost entirely on cost minimisation. Environmental aspects, where modelled explicitly, were either analysed qualitatively (Barnard 2014; Resnick et al. 2012), or by constructing a discrete set of environmental scenarios (Spalding-Fecher et al. 2017; Graeber et al. 2005; IRENA 2013). A continuous multi-criteria approach with the merit of unfolding relative shifts between different renewable energy technologies for different degrees of greenhouse gas (GHG) restrictions, however, is absent in this literature.
What is more, the relevance of political objectives for Southern African electricity expansion planning is well documented (Davidson and Mwakasonda 2004; Resnick et al. 2012) but currently not part of quantitative international electricity network expansion models in the academic literature. Two political factors are highly salient. First, national governments wish to achieve high levels of national electricity self-sufficiency to secure stable and reliable supply, a topic that has received a growing recent scholarly attention (Van de Graaf and Colgan 2017; Hawker et al. 2017; Moore 2017). National electricity sovereignty in the SAPP is an important issue with regards to the political dependencies created by high levels of electricity exports from South Africa to Botswana, Lesotho, Mozambique, Namibia, Swaziland, Zambia and Zimbabwe. Current efforts such as Swaziland's ambitious renewable energy expansion goals following the 2016 Paris Agreement are likely to be partly motivated by reducing these dependencies, which led to the highest electricity tariffs in the region (African Development Bank 2013). Second, different levels of institutional weakness and political instability in the twelve SAPP countries imply that different international network designs lead to greatly differing political risk characteristics of the network. Large-scale renewable electricity export projects, such as the Grand Inga hydroelectric plant in the Democratic Republic of Congo (DRC), have been frequently advertised to power significant parts of sub-Saharan Africa (Taliotis et al. 2016; Sanoh et al. 2014; IRENA 2015; Taliotis et al. 2014; Tshombe et al. 2007). Yet an over-reliance on a highly volatile country marred by dysfunctional political institutions and violent conflict with over eighty armed groups (Stearns and Vogel 2015), where parts of the already installed Inga capacity remained idle, appears to be a politically sub-optimal choice.
Novel insights were derived from creating a multi-objective linear programming (MOLP) optimisation model of the SAPP generation and transmission network that simultaneously included GHG reduction and political electricity sovereignty targets on a continuous scale in addition to cost minimisation. The model yielded geo-referenced Pareto-effi-cient network designs corresponding to the optimal trade-offs between these three objectives. Furthermore, three different political risk scenarios were defined for which the MOLP was solved separately. In their recent study, Spalding-Fecher et al. (2017) concluded that SAPP is likely to experience a shift from fossil fuels to renewables by 2070, when only economic criteria are concerned (Spalding-Fecher et al. 2017). This study explicitly yielded the political and ecological decision-making preferences under which such a shift becomes cost-minimal for satisfying new demand in 2030 in Southern Africa already.
It should be noted that politics further influence national electrification policy issues such as management of state-owned enterprises, tariff setting and subsidy distribution in southern Africa. While such factors are highly relevant, network designers cannot influence them significantly. By contrast, energy security and risks of relying on politically volatile countries for imports strongly depends on network design. Therefore, political factors that cannot be prevented through different network designs were not included in this study.
Section 2 briefly discusses this study's methodology, which was presented in more detail in supplementary material. Section 3 shows data sources for all parameters used, followed by the discussion of model results in Section 4 and implications in Section 5. Section 6 closes with a brief conclusion.
2. Methodology
The MOLP model is used to study the network implications for the optimal trade-offs between cost, GHG emissions and political sovereignty for different political risk scenarios. An instance of an all-pairs shortest-path (APSP) model is solved first to determine the minimal transmission cost between any supply and demand node in each political risk scenario. The exact solution procedure is detailed in the supplementary information.
2.1 All-pairs shortest-path optimisation
An APSP model determines the minimal distance between any two vertices in a network (Dijkstra 1959; Dreyfus 1969; Floyd 1962). The result of an ASAP problem is used to calculate the minimal transmission cost minTranscostsgdbetween each supply node (in supply country s e S using generation technology g e G) and demand node (in demand country d e D). The supplementary material provides mathematical implementation details.
A simple network structure is assumed with one main geo-referenced demand node, representing the entire country demand for all twelve SAPP countries. This demand node is assumed to be located at the country's capital city, except for in the case of South Africa, where it is Johannesburg. The extra costs of transmitting electricity from the main grid, which naturally runs via the main demand node, to the rest of the country is accounted for by using a generic split between industry, urban and rural demand (IRENA 2013). It further assumes one geo-referenced supply node per country and primary energy technology where the domestic potential for such a country-technology combination is significantly greater than 0. All demand nodes can be connected with any neighbouring supply node and any neighbouring country's main grid directly, or with any non-neighbouring supply node with an international grid that connects all countries between the supply origin and the demand country.
It is assumed that each supply country has a certain political risk, PolRisks to create a discrete set of political risk scenario analyses. If PolRisks is greater than a defined threshold value k, this country is not allowed to export electricity, nor are any international transmission lines allowed to pass through it. This allows to analyse the impact of preventing energy dependence on politically highly risky countries. It can be implemented by setting parameter neighbour = 0 (see the supplementary material) where startanode ra is in a country s where PolRisks > k for all possible start nodes in the network-Therefore, neighbour = neighbour (k) and consequently minTranscostsgd= minTranscostsgd(k), the optimal minimal transmission costs depend on the maximum allowed country-level political risk in the network.
2.2 Multi-objective linear programming electricity planning optimisation
To ensure quick and deterministic solution properties, the MOLP model used in this study was linear. It optimally matched supply sites in s e S supply countries using g e G generation technologies with the new additional demand of d e D demand countries arising over t Є T = {t1,..., tter} time periods. All demand in the baseline time period t0 is sunk and not included in the planning model. The model, to keep its linearity, assumes no economies of scale. The deployable capacity by 2030 is at most 25% of the total theoretical maximum potential (Sanoh et al. 2014). The model features three continuous objectives, namely cost minimisation, GHG emission minimisation, and national electricity sovereignty maximisation. Implementation details can be found in the supplementary information.
3. Data
Table A1 in the supplementary material lists data sources for all model parameters. The numerical example includes the SAPP's twelve countries and six generation technologies where their primary energy source is an un-imported resource of southern Africa, namely solar PV, onshore wind, hydro, geothermal, coal, or oil. As this study is concerned with a 2030 timeframe, solar thermal was not included, primarily because cost projections showed a clear dominance of utility-scale solar PV over solar thermal in 2030 (IRENA 2013). Of the 72 potential supply nodes, 41 were found to have a generation potential significantly greater than 0 and were thus included (IRENA 2013; Buys et al. 2007).
Demand estimates were taken from IRENA (2013). Other studies found roughly similar demand developments until 2030 for SAPP overall (Spalding-Fecher et al. 2017; Merven et al. 2010).
This study was only concerned with new demand arising from demand growth and retirement of old power plants (IRENA 2013). The year 2010 was taken as the baseline; all demand already met in 2010 was not part of the model.
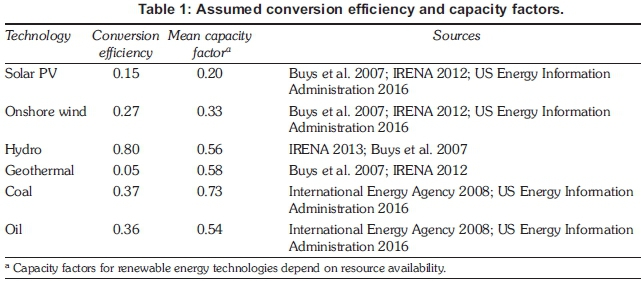
Generation cost for SAPP were taken from IRENA (2013). The solar PV unit costs assumed that two thirds of the capacity was deployed at utility scale, and one third on rooftops fitted with batteries capable of one-hour storage to match the assumed industry-urban-rural demand split (IRENA 2013). Unit transmission costs were set to the average of values presented in three different studies (Sanoh et al. 2014; Milligan 2012; Bahrman 2007). For a generation technology with a capacity factor of 50%, the resulting levelised system unit cost was USD 0.02428/kWh and 1000 km distribution. This value averaged over different distances and included different high-voltage DC and AC configurations. The capacity factors in Table 1 were used to calculate generation technology specific unit transmission costs per unit of electricity. These factors were furthermore used to derive installed capacity values from the model results. Transmission costs further included an assumed 3.5% energy loss per 1000 km of transmission (Sanoh et al. 2014) as well as a price bonus for transmitting electricity to remote areas using the business-urban-rural demand split mentioned earlier and associated costs (IRENA 2013; 2012).
The CO2 emissions were assumed to be 0 for all renewable energy technologies and calculated using standard carbon and energy content values for coal and oil as well as conversion efficiencies in Table 1, leading to 882 and 711 tons CO2/GWh of produced coal and oil electricity, respectively. Much more detail on the carbon footprint of SAPP electricity generation has been provided elsewhere (Zhou et al. 2009).
Solar insulation maps (IRENA 2017) and wind potential maps (Archer and Jacobson 2005) were used and the per-country location was assumed to be where the potentials showed peaks on the country maps taken from Natural Earth (Natural Earth 2017) in order to geo-reference the supply potentials for all 41 supply nodes. These locations were taken from the planning literature (Sanoh et al. 2014) for hydro-energy and geothermal energy.
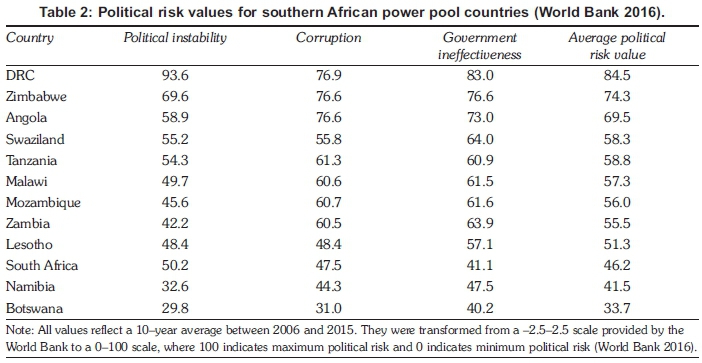
Table 2 assigns a political risk value to each of the twelve SAPP countries based on indicators that quantify country-wide political factors, which were found to be relevant for African electrification (Trotter et al. 2017; Trotter 2016; Ahlborg et al. 2015), in order to model the three different political risk scenarios for which the MOLP model was solved. In the first scenario, the allowed political risk of any supply country PolRisks was set to k = 100, implying that no political risk restrictions were imposed on electricity transmission. In the second scenario, k = 80, therefore DRC, the most politically volatile country in the SAPP, was prohibited from exports and intermediary transmission between two other countries. In the third scenario, k = 60, Zimbabwe and Angola were added to this restriction. Sections 4.1 and 4.2 discuss the optimal trade-off results for the unrestricted k = 100 case in detail. Section 4.3 shows the significant impact that political risk restrictions have on the generation mix.
4. Results and discussion
4.1 The cost of environmental sustainability and national electricity sovereignty
Figure 1 shows all non-dominated solutions of the MOLP model, the so-called Pareto front, for the scenario where political risk was not restricted (k = 100). The minimum cumulative system cost between 2011 and 2030 covering exclusively newly arising demand in SAPP with no emission and electricity sovereignty restrictions was USD 370 billion. This figure is 18% below that reported by IRENA for the 'Renewable energy promotion' scenario for SAPP for the same timeframe (IRENA 2013), mainly because, in contrast to the IRENA study, this study in its global cost minimum did not restrict fossil fuel shares and assign costs to GHG emissions, but modelled their minimisation as a separate objective, and allowed higher levels of trade.
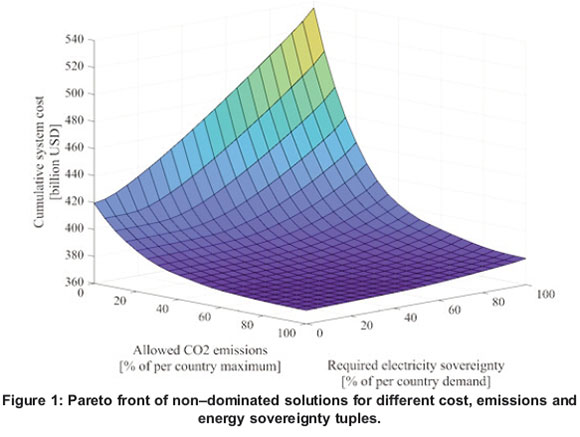
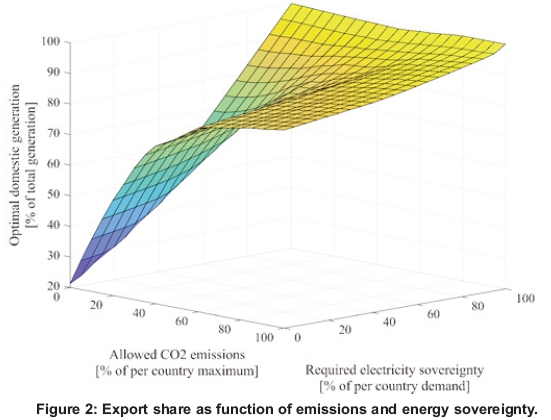
The results show that increasing the minimum level of electricity sovereignty in the SAPP was comparably cheap if no CO2 emission restrictions were applied at the same time. Increasing the cumulative system costs between 2011 and 2030 by 2.6% allowed all SAPP demand to be met domestically. Mitigating CO2 entirely was considerably more expensive, requiring an increase of 13.3% of cumulative system cost. Figure 2 shows the optimal domestic electricity share for the MOLP model with k = 100. The elimination of CO2 emissions was done most cost-effectively by significantly increasing the overall international trade levels, mainly driven by South Africa substituting its reliance on coal with hydroelectric imports from DRC, as well as from other domestic and neighbouring renewable sources. Section 4.2 gives more details.
The simultaneous decrease of GHG emissions and increase of national electricity sovereignty constitutes a sharp trade-off, reflected in an exponential increase in cumulative system costs. If 50% of the maximum CO2 emissions were allowed and 50% national electricity sovereignty were required, the cumulative system costs increased slightly by 2.0%. If only 25% of the maximum CO2 emissions were allowed and 75% electricity self-sufficiency was required, the cost increased by 9.0%. In the fully restricted case, finally, the minimum cumulative system costs were USD 535 billion, or 44.7%, higher than the cost minimum.
4.2 Network effects of emission and electricity sovereignty optimisation
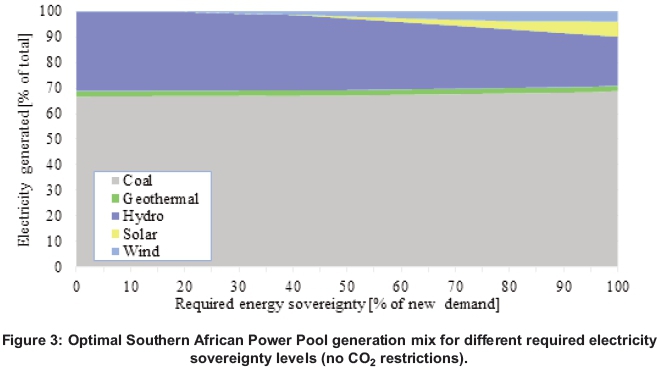
Figures 3, 4 and 5 illustrate the non-dominated generation technology mix for different levels of required national electricity sovereignty of allowed CO2 emissions and a joint restriction of the two, respectively. Figure 6 provides the resulting electricity consumption mix of the twelve SAPP countries and the power pool as a whole for four extreme scenarios, Table A2 in the supplementary material lists all the related optimal capacity additions for all countries. Figures 7 and 8 show the associated geo-referenced non-dominated SAPP network configurations using QGIS software. These results again do not assume a restriction of supply country-inherent political risk, i.e., k = 100.
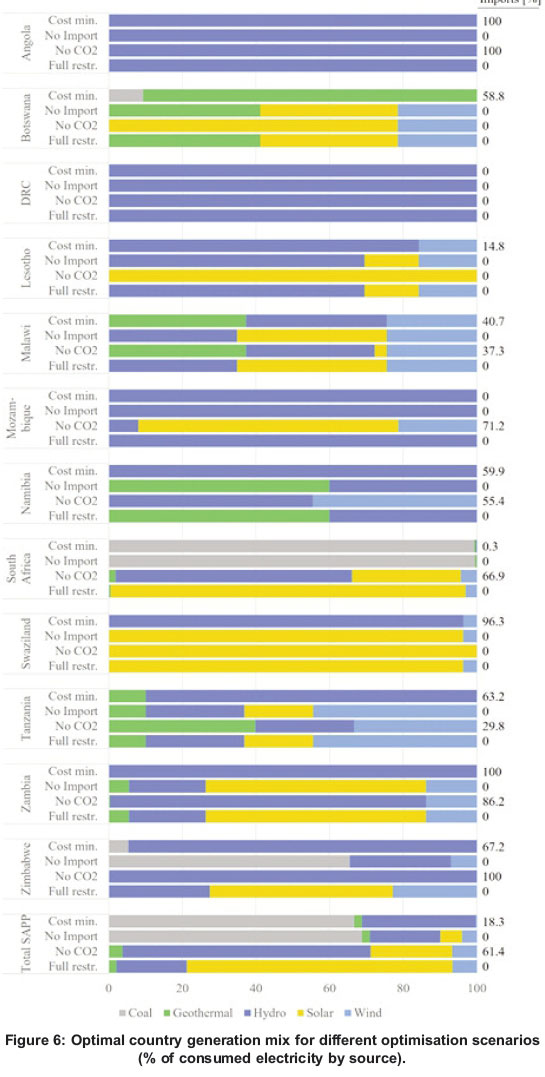

The cost-minimal solution obtained without CO2 and import restrictions is close to the solution provided in other SAPP planning literature (Spalding-Fecher et al. 2017; IRENA 2013). Between 2011 and 2030, almost 34.0 GW of new coal capacity additions were required, followed by 21.2 GW of hydroelectric capacity additions. In addition, the model added 1.4 GW geothermal capacity, while other technologies played a subordinate role. This generation mix, however, changed considerably depending on which additional optimisation criteria were added to the model.
Figure 3 shows that increasing the required level of electricity sovereignty had comparably small effects on the optimal electricity mix for the whole SAPP region when CO2 emissions were not constrained. The overall dominance of coal did not change with higher required national electricity sovereignty, as South Africa continued to use domestic coal to meet its demand. Yet the optimal electricity mix was significantly impacted for several countries. In Namibia, Tanzania, Zambia, Zimbabwe and Swaziland, the hydro share dramatically decreased with increasing national electricity self-sufficiency requirements in the former four countries because of domestic replacement of DRC Grand Inga imports. In the latter case, this was attributable to missing hydro imports from Mozambique. Instead, these countries used domestic coal, wind, geothermal, and, finally, solar potentials to compensate for hydro imports. Angola gradually replaced its hydro imports from the DRC with domestic hydro. Furthermore, Botswana and Malawi received geothermal energy in the unconstrained cost-minimal solution from Namibia and Zambia, respectively, because of the respective geographic proximity between geothermal supply location and demand. Moving to greater electricity sovereignty levels, Botswana and Malawi replaced these geothermal imports with domestic wind and solar energy, as shown in Figures 6, 7a and 7b.
As soon as CO2 emissions were restricted, which translates linearly to introducing increasing CO2 unit emission taxes, the non-dominated generation mix changed significantly (Figure 4). Its main driver was South Africa's need to replace its coal reliance with renewable energies. Where electricity sovereignty was not restricted, South Africa now sourced considerable amounts of its electricity from DRC's Grand Inga hydro dam. If CO2 emissions were restricted by 50% of the maximum possible value in each country and no restrictions were placed on imports, South Africa imported 43.2% of its newly arising electricity demand between 2011 and 2030 from the DRC. If CO2 emissions were entirely prohibited, South Africa sourced 50.8% of its additional demand from the DRC in 2030, 8.5% from hydro in Angola, 2.7% from hydro and wind sources in Zimbabwe as well as 2.6% from hydro in Mozambique, as shown in Figure 7c. In this case, Grand Inga in DRC would need to be operational at close to its full estimated potential, requiring 39 GW in 2030. Although technologically feasible, this represents a highly challenging implementation prospect. In general, the move towards zero extra carbon emissions was cost-minimally achieved by increasing hydro capacities as well as a considerable share of domestic solar PV in Botswana, Lesotho, Mozambique and South Africa.
If SAPP countries value a certain degree of electricity sovereignty, while also wanting to decrease CO2 emissions (Figure 5), it would become infeasible for South Africa to source hydroelectric energy from the DRC. Rather, it significantly extended its solar PV capacities to meet new demand between 2011 and 2030. In a hybrid scenario with CO2 and import restrictions of 50% of their respective maximum values, South Africa met 45.9% of its newly arising electricity demand in 2030 through imports from DRC, therefore, not needing to build any solar PV capacity, as shown in Figure 8. As the import restrictions increased, however, South Africa gradually added more domestic solar PV to meet the CO2 restriction. In the extreme scenario of full electricity sovereignty with zero carbon emissions allowed to serve additional demand, South Africa would be required to build 120 GW of domestic solar PV by 2030 in the cost-minimal solution. South Africa's significant expansion as well as significant additions in Malawi, Swaziland, Zambia and Zimbabwe made solar PV the dominant source of newly installed capacities in SAPP between 2011 and 2030 in this scenario, as shown in Figures 6 and 7d. The required solar PV additions again constitute a technologically feasible order of magnitude. China in 2015 added 2.5 times the solar PV capacity that would be required annually for South Africa to reach 120 GW by 2030 (International Energy Agency 2015a). Twelve different materials for solar PV cells are abundant enough on the planet to build solar PV cells that meet the entire worldwide demand, nine of which may be cheaper than the currently used crystalline silicon (Wadia et al. 2009). Yet such a goal would be a huge challenge given its financial implications as well as doubts of utility Eskom's willingness to allow independent solar PV implementation in South Africa (Ting 2017).
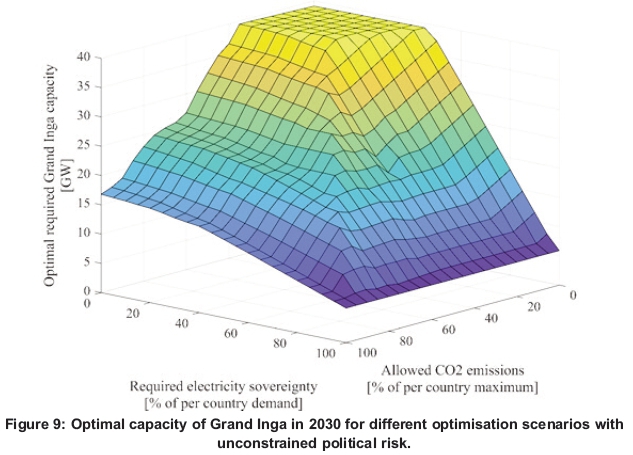
The different optimisation scenarios had considerable implications for the optimal size of the Grand Inga dam in DRC by 2030. Figure 9 shows that its size varied from 39 GW in situations where the CO2 restriction was strict and electricity sovereignty played almost no role to slightly over 5 GW where trade was entirely prohibited and Grand Inga only served national DRC demand. In the cost-minimal solution without CO2 and import restrictions, Grand Inga had a capacity of 16.8 GW by 2030 and produced 79 TWh electricity per year, where 27% was exported to Zambia, 17% to Angola, 14% to Tanzania, 4% to Zimbabwe and 2% to Namibia. The more CO2 restrictions increased, the higher the share of Grand Inga's electricity that was exported to South Africa.
The resulting implications support other research, which found that relying on Grand Inga meant giving up energy sovereignty of many SAPP countries (Sparrow and Bowen 2005). An important implication of this is that a significant amount of political risk in the network was pooled in the politically most poorly performing country in the SAPP, as shown in Section 3. To study the effect of restricting such political risk in the network, Section 4.3 discusses the results when exports from highly politically risky countries were prohibited.
4.3 Impact of restricting political risks
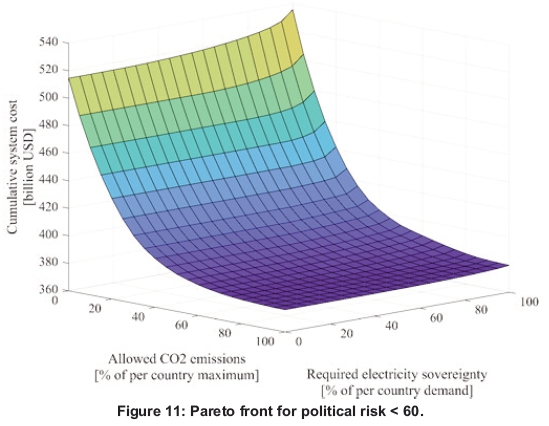
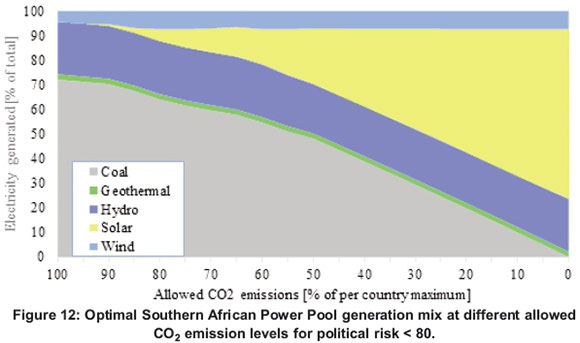
In Sections 4.1 and 4.2, the political risk of the network (other than that arising from low electricity sovereignty values and high CO2 emissions) was not constrained. This section discusses two alternative scenarios where political risks, as defined in Sections 2 and 3, were restricted in the network. In the first alternative scenario, ScenPR80, political risk was curtailed by prohibiting countries with a political risk value of PolRisks > k = 80 from electricity exports and from featuring intermediary transmission lines that connect supply and demand nodes in other countries, as presented in Table 2. In the second scenario, ScenPR60, this value was further reduced to k = 60. The first scenario affected the DRC; in the second scenario, Angola and Zimbabwe were added. Figures 10 and 11 present the non-dominated trade-offs between cost, CO2 emissions and electricity sovereignty for both scenarios. Figure 12 shows the implications of restricting CO2 emissions on optimal generation mix for ScenPR80 (the results for ScenPR60 were similar). Figure 13 depicts the optimal network for ScenPR80 and ScenPR60 when CO2 emissions were not and were fully restricted.
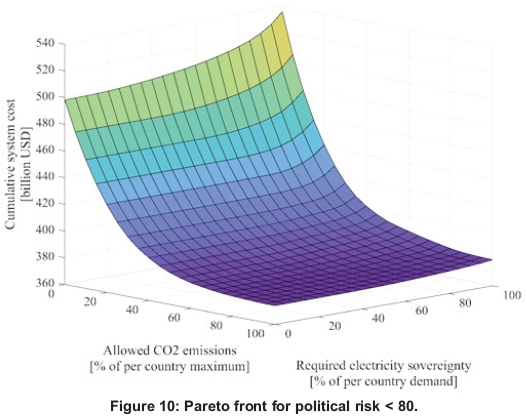
In both scenarios, trade was severely impacted as its main source, the Grand Inga dam, was only active domestically. In the cost-optimal solution of ScenPR80 with no CO2 or electricity sovereignty restrictions, instead of relying on DRC imports, Angola developed significant domestic hydro capacity to meet its own supply and to export to Zambia and Namibia. Furthermore, Zambia, Tanzania and Zimbabwe developed their wind potential. In ScenPR60, Angola's hydro exports were replaced by Namibian hydro, wind and geothermal capacity increased, as did hydro exports from Mozambique.
Requiring electricity sovereignty to be high had only a minor cost effect on the optimal network, because of the added trade restrictions in both scenarios. When CO2 emissions were restricted, however, the generation mix changed significantly towards solar PV, as shown in Figure 12. This was the case for both ScenPR80 and ScenPR60. As soon as hydro imports from DRC were an infeasible option for South Africa to drive down CO2 emissions, the cost-minimal solution to mitigate CO2 in 2030 was considerable domestic solar PV capacity additions. Other cheap renewable sources in South Africa or other SAPP countries were either too small or too expensive to meet the full South African demand. In ScenPR80, South Africa, therefore, installed a maximum of 110 GW of solar PV by 2030 (if CO2 emissions were entirely prohibited) to replace its domestic coal usage in addition to sourcing smaller amounts of renewable energy from Botswana, Mozambique, Zimbabwe and Lesotho, as shown in Figure 13b.
There were some notable country-scale implications in the ScenPR60 scenario (Figure 13). As the model prohibited intermediary transmission through a country with a political risk value greater than 60, the transmission line from Namibia to Zambia was bent to avoid going through Angola. Similarly, transmission lines from Mozambique to Zambia and from Botswana to Zambia were bent to avoid passing through Zimbabwe. Such a network design, while implying higher transmission costs, averted the added complexity of including more politically risky countries into a bilateral electricity agreement. When CO2 restrictions were applied to ScenPR60, several renewable resources in countries bordering South Africa were used for export and Zambia was forced to considerably scale up its domestic solar PV capacity, as shown in Figure 13d.
5. Implications
There are a number of implications arising from this study. First, while relatively cheaply realisable individually, achieving national electricity self-sufficiency and no new CO2 emissions simultaneously implies a significant system cost increase of 44.7%. Thus, CO2 emission reductions and national electricity sovereignty constitute two objectives with comparably small synergies and a sharp monetary trade-off in the SAPP. The strict monetary trade-off between climate change mitigation and national energy sovereignty requires well-defined preferences of decision makers to select a feasible future generation mix for the region.
Second, if each country is restricted to 55% of its theoretical maximum CO2 emissions in 2030, hydro becomes the dominant generation source of meeting demand arising between 2011 and 2030.
However, if countries value a certain degree of national electricity sovereignty, they gradually replace large-scale hydro imports from DRC, as well as from Angola, Mozambique and Zambia, with domestic wind and solar sources in the optimum solution. When both CO2 emissions and foreign electricity dependence are curtailed at 25% of their respective maximum values, solar PV becomes the dominant generation source for meeting demand arising between 2011 and 2030. This is mainly driven by South Africa's need to develop significant domestic solar PV capacities under these circumstances, but also by solar PV additions in Botswana, Lesotho, Malawi, Swaziland, Tanzania, Zambia and Zimbabwe. If South Africa intends to keep its reputation as the region's dominant powerhouse and also reduce its carbon footprint significantly, it needs to quickly scale-up domestic solar energy. An approach that actively includes both Eskom and independent power producers seems most promising given the required scale. Solar PV in the SAPP today presents a unanimously agreed-upon market opportunity with significant foreseeable demand. With the right policy incentives, such as adequate carbon taxes and costing political risks, this move towards solar would be cost-optimal much earlier than in 50 years. To decrease the cost and required scale of this energy transition, both supply-side measures surrounding energy efficiency increases and logistical challenges, and demand-side management to decrease industrial and residential demand need to be stepped up, especially where a business case exists to do so.
Third, when political risk values are restricted, DRC's hydro exports become infeasible due to the country's volatile political nature. As a result, in the cost-optimal solution for cases where CO2 emissions are restricted to at most 35% of their theoretical per-country maximum, solar PV becomes the dominant generation source for serving the newly arising demand between 2011 and 2030 in SAPP. This is the case whether or not decision-makers value national electricity sovereignty. Equivalently, higher solar PV shares manage to reduce the political risk in the SAPP network. In turn, this result implies that despite its obvious cost-effectiveness and large-scale climate change mitigation potential, a number of institutional and political stability considerations need to be addressed before developing DRC's Grand Inga at scale. While scaling solar PV is a considerable challenge, such a move also presents technological opportunities. Switching towards solar PV sooner than later carries the benefit of not having to re-design a whole fossil-fuel based electricity system when solar PV is fully cost-competitive in the future. Rather than constructing a grid designed solely for large-scale projects, it seems worthy to think about grid architectures and storage systems capable of dealing with large-scale centralised and decentralised solar energy today. Furthermore, research into alternative materials for solar PV and batteries should be further fostered which would considerably boost capabilities for supplying the necessary amount of solar PV cells long-term.
It should be noted that the implications of this multi-criteria study could be refined further if future research would improve the geospatial optimisation model to include more concrete site selection within SAPP countries. Methodologically, the model performance could be compared to evolutionary algorithms, for instance multi-objective particle swarm optimisations and reactive search optimisation, which may enable solving bigger models with finer geospatial resolution necessary to incorporate more specific site selection problems.
6. Conclusion
This study examined optimal trade-offs between system cost, CO2 emissions and electricity sovereignty in the SAPP generation and transmission network for the demand between 2011 and 2030 for different political risk scenarios. The study found a number of novel implications for the SAPP network when political factors are added to economic and environmental objectives. These included the swift monetary trade-off between CO2 emissions and electricity sovereignty, as well as the growing share of solar PV capacity in the optimal solution as environmental and political factors are taken into consideration. The multi-criteria nature of the SAPP energy-planning problem thus warrants an increase of technological, regulatory and policy-making efforts to enable large-scale deployment of solar PV in the coming decade, thereby creating a significant domestic development opportunity.
Note
1. Supplementary data associated with this article can be found at https://journals.assaf.org.za/index.php/jesa/article/view/2451/4299.
Acknowledgements
This research was funded by the Engineering and Physical Sciences Research Council grant EP/M507982/1 awarded to the University of Bath, United Kingdom.
References
African Development Bank. 2013. Kingdom of Swaziland - Country strategy paper 2014-2018, Centurion, South Africa: Southern Africa Regional Resource Centre. Available online: https://www.afdb.org/fileadmin/uploads/afdb/Documents/Project-and-Operations/2014-2018_-_Swaziland_Country_Strategy_Paper_Draft_Version_.pdf. Accessed February 2017. [ Links ]
Ahlborg, H., Borang, F, Jagers, S. C. and Soderholm, P 2015. Provision of electricity to African households: The importance of democracy and institutional quality. Energy Policy 87: 125-135. [ Links ]
Archer, C. L. and Jacobson, M. Z. 2005. Evaluation of global wind power. Journal of Geophysical Research. 110(D12). [ Links ]
Bahrman, M. P. J. and Johnson, B. K. 2007. The ABCs of HVDC transmission technologies. IEEE Power and Energy Magazine, 5(2): 32-44. [ Links ]
Barnard, M.. 2014. SADCs response to climate change: The role of harmonised law and policy on mitigation in the energy sector. Journal of Energy in Southern Africa 25(1): 26-32. [ Links ]
Bhagavan, M. R.. 1985. The energy sector in SADC countries. Ambio 14(4-5): 214-219. [ Links ]
Bowen, B. H., Sparrow, F and Yu, Z.. 1999. Modeling electricity trade policy for the twelve nations of the Southern African Power Pool. SAPP Utilities Policy 8(3) 183-197. [ Links ]
Buys, P, Deichmann, U., Meisner, C. M., That, T. T. and Wheeler, D. 2007. Country stakes in climate change negotiations: Two dimensions of vulnerability, World Bank Policy Research Working Paper 4300. [ Links ] .
Davidson, O. and Mwakasonda, S. A. 2004. Electricity access for the poor: A study of South Africa and Zimbabwe. Energy for Sustainable Development 8(4): 26-40. [ Links ]
Dijkstra, E. W. 1959. A note on two problems in connexion with graphs. Numerische Mathematik 1(1): 269-271. [ Links ]
Dreyfus, S. E. 1969. An appraisal of some shortest-path algorithms. Operations research 17(3):395-412. [ Links ]
Floyd, R. W. 1962. Algorithm 97: Shortest path. Communications of the ACM 5(6):345. [ Links ]
Gnansounou, E., Bayem, H., Bednyagin, D. and Dong, J.. 2007. Strategies for regional integration of electricity supply in West Africa. Energy Policy 35(8):4142-4153. [ Links ]
Graeber, B. and Spalding-Fecher, D. R. 2000. Regional integrated resource planning and its role in regional electricity co-operation and development in Southern Africa. Energy for Sustainable Development 4(2):32-37. [ Links ]
Graeber, B., Spalding-Fecher, R. and Gonah, B. 2005. Optimising trans-national power generation and transmission investments: A Southern African example. Energy Policy 33(18):2337-2349. [ Links ]
Green, N., Sovacool, B. K. and Hancock, K.. 2015. Grand designs: Assessing the African energy security implications of the Grand Inga Dam. African Studies Review 58(1):133-158. [ Links ]
Hawker, G., Bell, K. and Gill, S. 2017. Electricity security in the European Union: The conflict between national capacity mechanisms and the single market. Energy Research & Social Science 24: 51-58. [ Links ]
International Energy Agency. 2008. Energy efficiency indicators for public electricity production from fossil fuels. Paris, France: International Energy Agency. [ Links ]
International Energy Agency. 2015a. Snapshot of the global photovoltaic markets. Paris, France: International Energy Agency. [ Links ]
International Energy Agency. 2015b. World Energy Outlook 2015. Paris, France: International Energy Agency. [ Links ]
International Renewable Energy Agency [IRENA]. 2012. Prospects for the African power sector - Scenarios and Strategies for Africa Project. Abu Dhabi, UAE: International Renewable Energy Agency. [ Links ]
International Renewable Energy Agency [IRENA]. 2013. Southern African Power Pool: Planning and prospects for renewable energy. Abu Dhabi, UAE: International Renewable Energy Agency. [ Links ]
International Renewable Energy Agency [IRENA]. 2015. Africa power sector - Planning and prospects for renewable energy. Abu Dhabi, UAE: International Renewable Energy Agency. [ Links ]
International Renewable Energy Agency [IRENA]. 2017. Global atlas for renewable energy. Available online: https://irena.masdar.ac.ae/gallery/#gallery. Accessed February 2017. [ Links ]
Merven, B., Hughes, A. and Davis, S.. 2010. An analysis of energy consumption for a selection of countries in the Southern African Development Community. Journal of Energy in Southern Africa 21(1):11-24. [ Links ]
Milligan, M., Ela, E., Hein, J., Schneider, T., Brinkman, G. and Denholm, P 2012. Volume 4: Bulk electric power systems: Operations and transmission planning. Golden, CO: National Renewable Energy Laboratory. [ Links ]
Moore, S. 2017. Evaluating the energy security of electricity interdependence: Perspectives from Morocco. Energy Research & Social Science 24: 21-29. [ Links ]
Natural Earth. 2017. Natural Earth large scale data. Available online: http://www.naturalearthdata.com/. Accessed December 2017. [ Links ]
Nziramasanga, N., Batidzirai, B. and Rowlands, H. 2013. Regional electricity mitigation options. In Rowlands, I. H. (ed). Climate change cooperation in Southern Africa. Routledge: 102-119. [ Links ]
Ohiare, S. 2015. Expanding electricity access to all in Nigeria: A spatial planning and cost analysis, Energy, Sustainability and Society, 5(8): 1-18. [ Links ]
Ohijeagbon, O. D. and Ajayi, O. O.. 2015. Solar regime and LVOE of PV embedded generation systems in Nigeria. Renewable Energy 78: 226-235. [ Links ]
Resnick, D., Tarp, F. and Thurlow, J. 2012. The political economy of green growth: Cases from Southern Africa, Public Administration and Development 32(3):215-228. [ Links ]
Rose, A., Stoner, R. and Pérez-Arriaga, I. 2016. Prospects for grid-connected solar PV in Kenya: A systems approach. Applied Energy 161:583-590. [ Links ]
Sanoh, A., Kocaman, A. S., Kocal, S., Sherpa, S. and Modi, V. 2014. The economics of clean energy resource development and grid interconnection in Africa. Renewable Energy 62:598-609. [ Links ]
Spalding-Fecher, R., Senatla, M., Yamba, F., Lukwesa, B., Himunzowa, G., Heaps, C., Chapman, A., Mahumane, G., Tembo, B. and Nyambe, I.. 2017. Electricity supply and demand scenarios for the Southern African Power Pool. Energy Policy 101:403-414. [ Links ]
Sparrow, F. T. and Bowen, B. H.. 2005. The future of SAPP, WAPP CAPP and EAPP 2005 Ieee Power Engineering Society General Meeting, Vols 1-3: 1825-1827. [ Links ]
Stearns, J. K. and Vogel, C.. 2015. The landscape of armed groups in the Eastern Congo. New York, NY: Congo Research Group. [ Links ]
Taliotis, C., Bazilian, M., Welsch, M., Gielen, D. and Howells, M.. 2014. Grand Inga to power Africa: Hydropower development scenarios to 2035. Energy Strategy Reviews 4:1-10. [ Links ]
Taliotis, C., Shivakumar, A., Ramos, E., Howells, M., Mentis, D., Sridharan, V, Broad, O. and Mofor, L. 2016. An indicative analysis of investment opportunities in the African electricity supply sector - Using TEMBA. The electricity model base for Africa. Energy for Sustainable Development 31: 50-66. [ Links ]
Ting, B.. 2017. Drifting into a crisis-regime resistance and stability: A case study on South Africa's electricity system. In 1st International Conference on Energy Research & Social Science, April 2nd - April 5th, Sitges, Spain. [ Links ]
Trotter, P A.. 2016. Rural electrification, electrification inequality and democratic institutions in sub-Saharan Africa. Energy for Sustainable Development 34: 111-129. [ Links ]
Trotter, P. A.. 2017. Discussion paper: Identifying and resolving methodological issues in previous Africa-wide electricity planning optimisation research: A comment on Sanoh et al. (2014). Renewable Energy 114PB: 1442-1446. [ Links ]
Trotter, P A., McManus, M. C. and Maconachie, R.. 2017. Electricity planning and implementation in sub-Saharan Africa: A systematic review. Renewable and Sustainable Energy Reviews 74: 1189-1209. [ Links ]
Tshombe, L. M., Ferreira, I. W. and Uken, E.. 2007. NEPAD vision and the INGA hydro-electric scheme. Journal of Energy in Southern Africa 18(4):19-25. [ Links ]
US Energy Information Administration. 2016. International Energy Outlook 2016 Washington, DC: US Energy Information Administration. [ Links ]
Van de Graaf, T. and Colgan, J. D.. 2017. Russian gas games or well-oiled conflict? Energy security and the 2014 Ukraine crisis, Energy Research & Social Science 24: 59-64. [ Links ]
Wadia, C., Alivisatos, A. P and Kammen, D. M.. 2009. Materials availability expands the opportunity for large-scale photovoltaics deployment. Environmental science & technology 43(6):2072-2077. [ Links ]
World Bank. 2016. Worldwide Governance Indicators. Available online: http://info.worldbank.org/governance/WGI/#home. Accessed December 2016. [ Links ]
World Bank. 2017. World development indicators. Available online: http://data.worldbank.org/data-catalog/world-development-indicators. Accessed December 2016. [ Links ]
Zeyringer, M., Pachauri, S., Schmid, E., Schmidt, J., Worrell, E. and Morawetz, U. B. 2015. Analyzing grid extension and stand-alone photovoltaic systems for the cost-effective electrification of Kenya, Energy for Sustainable Development 25: 75-86. [ Links ]
Zhou, P P, Yamba, F D., Lloyd, P, Nyahuma, L., Mzezewa, C., Kipondya, F., Keir, J., Asamoah, J. and Simonsen, H. 2009. Determination of regional emission factors for the power sector in Southern Africa. Journal of Energy in Southern Africa 20(4):11-18. [ Links ]
* Corresponding author: Tel: +44 1225 383888; email: p.trotter@bath.ac.uk

