


Services on Demand
Article
 English (pdf)
 Article in xml format
 Article references
Indicators

Related links
-
 Cited by Google
 -
 Similars in Google
Share

 Permalink
Journal of Energy in Southern Africa
On-line version ISSN 2413-3051
Print version ISSN 1021-447X
J. energy South. Afr. vol.28 n.2 Cape Town May. 2017
http://dx.doi.org/10.17159/2413-3051/2017/v28i2a1640
ARTICLES
Solar resource classification in South Africa using a new index
Evans Zhandire*
University of KwaZulu-Natal, School of Engineering, Engineering Access, Howard College Campus, Durban 4041, South Africa
ABSTRACT
This paper introduces a solar resource index that responds to site-specific sky conditions resulting from stochastic movement and evolution of clouds. The developed solar resource classification index called probability of persistence (POPD) had limited capabilities to distinguish persistent clear-sky conditions from persistent overcast-sky conditions. The metric proposed in this investigation, referred to as the solar utility index (SUI), seeks to extend the POPD index to a simple enough index that can singly discriminate different states of a solar resource. It gives a measure of the fractional time during which a solar resource exhibits predefined characteristics over a specific time period not exceeding the time interval between sunrise and sunset. These solar resource qualities, which are user-defined, measure: (1) the fluctuation characteristic of the solar resource magnitude, and (2) the solar resource diffuse and beam composition. Values of the indexes computed over daily time intervals of 7:00-17:00 apparent solar time were tested for their solar resource classification qualities.
Five distinct classes using K-means clustering algorithm were identified for the solar radiation resource measured at eight stations in South Africa. The SUI was found to have superior solar resource discriminating and grouping abilities when compared with other indexes like POPD and fractal dimension.
Highlights
• Solar utility index, a new solar resource classification index was defined.
• Five classes of the solar resource in South Africa were identified.
• The five clusters showed reasonably homogeneous solar resource properties.
Keywords: fluctuation magnitude, K-means clustering, relative composition
1. Introduction
Solar energy is becoming an increasingly important component of the energy mix required to confront current global energy and environmental challenges. Detailed knowledge about its availability and variability over different time-scales are important for its exploitation to be cost-effective and efficient. Solar resource variability is primarily caused by earth-sun relative motion and movement and evolution of clouds. Variations induced by the apparent motion of the sun relative to the earth are visible on diurnal and seasonal scales, and can be predicted precisely from well-established astronomical equations [1, 2]. Variability caused by clouds is less predictable, and manifests as short-term temporal fluctuations that modulate the otherwise uniform astronomically-driven diurnal irradiance profiles. These stochastic fluctuations vary in amplitude, persistence (duration), and frequency of occurrence [3]. Assessment of the solar resource therefore requires a statistical approach using appropriate statistical metrics that model the variation in solar resource magnitude under the influence of local stochastic weather influences over different time-scales. Several metrics that show varied solar resource discrimination capabilities exist in available literature. These include fractal dimension (FD) of daily profile of global horizontal irradiance (GHI) [4], daily clearness index probability distribution functions [5], granulometric size distribution of GHI [6], variability index (VI) [7] and daily probability of persistence POPd [8]. The FD of GHI as proposed by Maafi and Harrouni [4] measures the amount of daily solar irradiance fluctuations that are due to changes in the state of the sky. Values of FD close to 1 indicate persistent sky-conditions that are characteristic of either a clear day or an overcast day. These two extremes of the solar resource were distinguished by combining the FD with the daily clearness index Kj, to present a solar resource classifier that identified three classes of solar resource days using GHI data from two sites in Algeria [4]. The approach proposed by Soubdhan et al. [5] was that the classifier discriminates daily solar resource according to daily distribution histograms of instantaneous clearness indexes kj. Four solar resource classes were identified at Guadeloupe, an island in the West Indies, from a year-long sample of irradiance data measured at a frequency of 1 Hz. The membership of each class is subject to similarities in marginal probability density functions (pdfs) that are modelled using Dirichlet distribution functions from the daily histograms of clearness indexes kj(t). An elaborate five-step computational algorithm was used to implement the classification process [5]. Gastón-Romeo et al. [6], in another solar resource classification approach, proposed the use of granulometric size distribution curve, a mathematical morphology parameter, as a descriptor of the shape and dynamic of GHI daily curves. A sample of 609 solar radiation curves were partitioned into 4 classes using the partition around medoids clustering algorithm. Kang and Tam [8], in a more recent study, proposed a new metric: the daily probability of persistence POPd. This metric measures the persistence of the normalised instantaneous magnitude of the GHI, i.e., instantaneous clearness index kj(t). Cases of consistently high or low magnitudes of kj(t) characteristic of clear-day or overcast-day GHI time series will inevitably show similarly high POPd values [8] . These two extremes were differentiated by pairing the POPd with daily clearness index to form the K-POP method [8]. This method was used to classify the solar resource into 10 classes.
The present investigation focused on developing a solar resource metric that captures the cloud-induced fluctuations of the solar resource and that is able to classify the solar resource according to distinctive effects of weather induced effects. It extended POPd index to a simple enough index that can singly discriminate different states of a solar resource. This index is referred to as the solar utility index (SUI), which may also be considered as an indicator of the practical usefulness of a solar resource. The theoretical basis of the SUI and how it relates to the POP metric are discussed, followed by an outline of methodology to predict the properties of SUI and their subsequent demonstration, including solar resource classification capabilities.
2. The solar utility index
The SUIt measures the fractional time when the solar resource has short-term fluctuation magnitudes and energy quality that satisfy a given set of conditions, for a solar resource available during a time t, between sunrise and sunset. The short-term fluctuation characteristic is given by , a time series of absolute changes in
  the instantaneous clear sky index (CSI)) [9]. The CSI is simply a ratio of measured GHI to clear-sky global horizontal irradiance GHIclear, predicted by a suitable clear-sky model. A clear-sky model developed by Ineichen and Perez [10] and its MATLAB implementation developed by Sandia National Laboratory [11] were used to generate site-specific daily time series of GHIclear in this investigation. The fluctuation characteristic
  for a time interval Δt,- = t,+1-ti within a time span t, is given by Equation 1.

The energy quality is quantified by a new index called the relative composition index (RCI), which, for a time interval Δt,- = tt+ 1-ti, is defined according to Equation 2.

The kbd = (DHI-BHI)/GHI is the instantansous rslativs difference between the diffuse horizontal ir-radiance DHI and beam horizontal irradiance BHI at time t,-, within the time span t. These instantaneous indexes vary from a maximum value of 1 for overcast sky-conditions, through 0 when the beam and diffuse components are equal, to a negative value that is indicative of clear-sky conditions given by (DHIclear-BHIclear)/GHIclear.The solar utility index for a solar resource spanning the time period t is then defined by Equation 3, which can be interpreted as the joint probability density function of a solar resource having fluctuation magnitude  less than or equal to Δk*th and relative composition index, RCI, less than or equal to RCIth within a time span t.
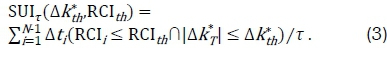
where RCIth, and  are reference values that define the threshold values of the RCI and fluctuation magnitude, respectively; and N = T/At is the number of solar resource sampling points within the time span t. The SUIt is notably a function of two marginal probabilities related to the cumulative distribution functions (CDFs) of the | Δk*t | and RCI according to Equations 4 and 5.

The marginal probability distribution POPT in Equation 4 is equivalent to the probability of persistence metric originally proposed by Kang and Tam [8]. The variation of
  with the threshold values Δkt, can be obtained from
  , which is the CDF of
  evaluated at
  . Equation (5) defines a marginal probability distribution PRCT(RCIth) called probability of relative composition (PRC), which is the probability that RCI, < RCIth. It follows that FRCIi(RCIth), which is the CDF of the RCI, describes the variation of the PRC with the relative composition threshold. The PRC is related to the concept of utilisability, which is defined as the fraction of insolation incident on a collector's surface that is above a given threshold or critical value [12]. The functional relationship between the solar utility index and the two marginal probabilities
 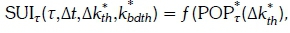 , PRCT(RCIth)), depends on the probabilistic dependence of the two marginal events
  , and RCI,- < RCIt,. If they were statistically independent, then their joint probability distribution SUIT(Akjh,RCIth) could equal the product of their marginal probabilities
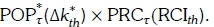
3. Methodology
3.1 Experimental
The irradiance information used in this investigation was obtained from ground irradiance results measured at eight stations with differing latitudes, altitudes and microclimates. The specific locations of the stations are shown on a map in Figure 1, which also shows the respective location altitudes in metres.

The station names that correspond to the acronyms displayed on the map are: Ritchersveld (RVD), Vanrhynsdorp (VAN), Graaff-Reinet (GRT), Nelson Mandela Metropolitan University (NMU), University of Free State (UFS), University of KwaZulu-Natal Howard College, (KZH), Vryheid (VRY) and University of Pretoria (UPR). They form part of Southern African Universities Radiometric Network (SAU-RAN), an initiative setup to provide high-resolution, ground-based radiometric data for Southern Africa [13, 14]. The solar radiation components, global horizontal irradiance GHI, beam normal irradiance BNI, and diffuse horizontal irradiance DHI, are measured using state-of-the-art Kipp and Zonen [15] radiometers and are archived as one-minute-, hourly- and daily-averaged data. These data can be publicly accessed through a website interface [14]. A sample of one-minute-averaged solar irradiance data (Δt = 60s) measured over the year 01 July 2014-30 June 2015 was used. The BNI was converted to its horizontal surface component beam horizontal irradiance BHI through multiplication by the cosine of the solar zenith angle, i.e., BHI = BNI cos 0z. Daily time series of the solar resource features (Equations 2 and 3) were generated from this data sample using MATLAB Release 2011a. The solar utility indexes and the other parameters were computed for daily time intervals t during 7:00 to 17:00 apparent solar time, with the fluctuation  and relative composition RCIth thresholds set respectively at 0.01 and 0. These daily probabilities are denoted by replacing the general time interval subscript t by D, i.e., SUId, POPd and PRCd.
3.2 SUI solar resource application to classification of solar resource
The classification properties of the SUI are determined from a solar resource classifier built from the computed daily values of SUId using K-means method to identify homogenous solar resource clusters. For a collection of m, SUID data points where n = 1, 2, ...m, the K-means clustering algorithm it-eratively groups the data points into k disjoint clusters Cj (j = 1, 2, ...k), each containing msdata points subject to minimisation of the within-cluster-sum-of-squares error function [16]. The sum-of-square error is given by Equation 6.

where Mj is the centre of the th cluster, given by the mean of the data points belonging to the cluster. A collection of solar resource classification features consisting of a total 8 X 365 sample of daily solar utility indexes was used. To determine the number of clusters k a distribution histogram of the SUId data visually identified the likely partitions of the data points. The K-means algorithm was applied to the data to create the clusters using a built-in function in the statistical toolbox of MATLAB software with the minimisation of the squared Euclidean distance as the clustering score. Measures known as silhouette values, s(Cjwere calculated for each datum i in each cluster Cjusing a built-in MATLAB function also named silhouette to determine the quality of the clusters. The silhouette values range from +1 indicating well-separated datum, through 0 for datum on the border of two clusters, to -1 for misclassified or outlier datum [17]. The cluster-specific averages  measure how tightly grouped are all the data in the respective clusters. Values where
  were accepted to be representative of reasonably clustered data points.
4. Results and discussion
Solar utility index as a function of POPd and PRCd
A somewhat moderate dependence exists between the marginal probabilities POPq(0.01) and PRCd(0) as shown in Figure 2(a) and is characterised by a correlation coefficient of 0.65. This probabilistic dependence is substantiated by Figure 2(b), which reveals a non-linear relation between joint probability SUId (0.01, 0) and the product of the marginal probabilities . The solid line in Figure 2(b), assumes independence of the marginal probabilities i.e.
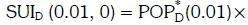
 ; and shows that this assumption generally underestimates the SUId. The mean bias error and root mean square error relative to the sample mean SUId associated with this assumption for this sample of data are - 5.1% and 9.2%, respectively. A quadratic fit as shown by the broken line on the same graph gives a better fit with coefficient of determination value R2 = 0.99 and a root mean square error relative to mean SUId of 5.8%.
4.2 Variation with Δk*th, and RCIth
The variation of SUId with  , and RCIth, can be indirectly inferred from the daily Cumulative Distribution Functions
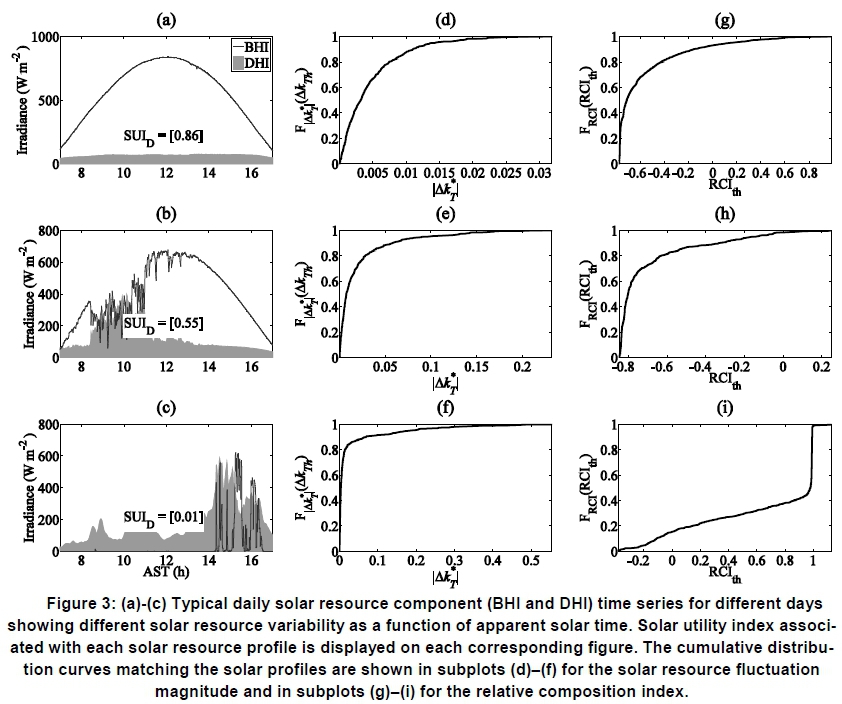
 , and FRd(RCIth,). Figure 3 illustrates these functions for three solar resource profiles that exhibit different characteristics. It was found that, for PRCd > 0, SUId increases with the fluctuation threshold
  ,since
 is a monotonically increasing function of
  despite the error associated with estimating the
  . By examining the FRCI(RCIth, ) curve we also similarly observe that for
  , increasing RCIth, results in higher values of PRQj hence higher SUId. The solar utility indexes can be computed for shorter time intervals t, such as hourly intervals, or longer time intervals t, such as months, as long as the irradiance data sampling time interval Δt, allows for large enough sample sizes, N= τ/Δt. Longer sampling time intervals may, however, mask the effect of the short-term solar resource variability.
4.3 The SUId solar resource classification qualities
This section demonstrates the solar resource classification qualities of the SUId- A sample of 365x8 values of SUId, generated using the following parameters: Δkth= 0.01, RCIth= 0, Δt = 1 min and τ = 7:00-17:00 apparent solar time, was considered.
Clustering results
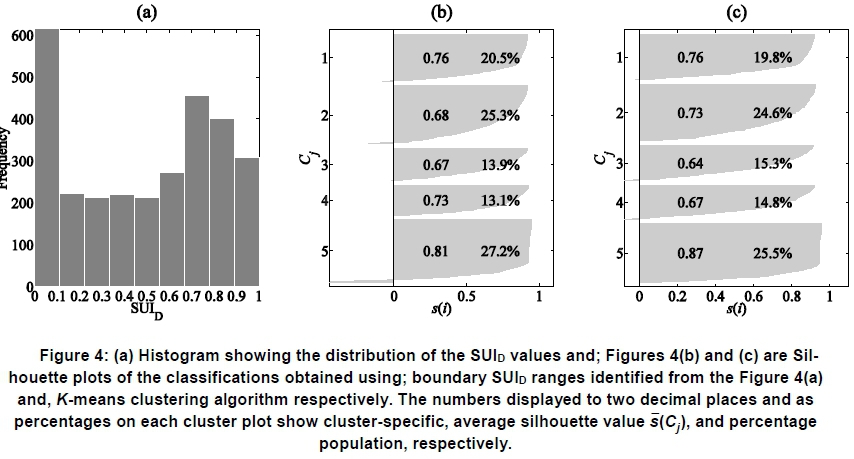
Figure 4(a) shows a histogram of the distribution of the sample SUId values for all stations, from which one can identify the following five cluster-defining-boundaries: SUId > 0.8, 0.6 < SUId < 0.8, 0.4 < SUId < 0.6, 0.2 < SUId < 0.4, and SUId < 0.2; labelled cluster 1 to 5 respectively. The quality of each of these clusters is shown by the silhouette plot in Figure 4(b). A small percentage of its population of about 4% is misclassified as indicated by the negative silhouette values, despite the largest cluster-averaged silhouette values recorded by cluster 5 pointing to a good clustering. Some misclassified data representing 1.3%, 2.4% and 0.25% of the respective cluster populations was also shown in clusters 1, 2 and 3. Applying the K-means, clustering method shows an improvement in the data clustering as shown in the silhouette plot of Figure 4(c). Cluster 5 again appeared to be the best clustered. Cluster 3 and 4 show some data points that have negative silhouette values, but constitute only 1.8% and 1.1% of the respective cluster populations.
Interpreting the clusters
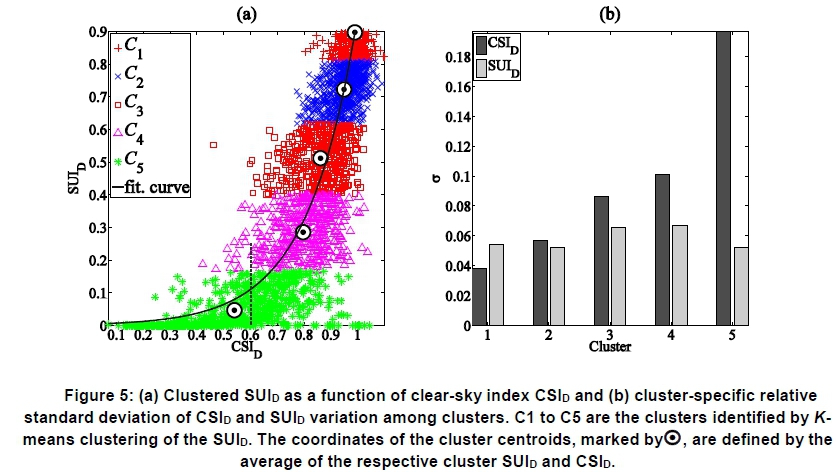
Figure 5(a) shows the clustered SUId as a function of CSId, the daily-averaged value instantaneous CSI- The results show a positive correlation between the SUId and CSId following an exponential relationship as shown by the solid line that traces the trend of cluster centroid on the graph. The results also show a spread of data points around these cluster centroids and the extent of these dispersions vary as shown in Figure 5(b) by the sample standard deviations of the cluster CSId and SUId- Cluster 5 is the least compact with largest spread of CSId- It is conceivable that 2 smaller and more compact clusters can be obtained by splitting cluster 5 along the line CSId = 0.6, illustrated by the thick broken vertical line in Figure 5(a). Clusters 1 and 2 appear to be the most compact clusters judging from the spread of their CSId and SUId values.
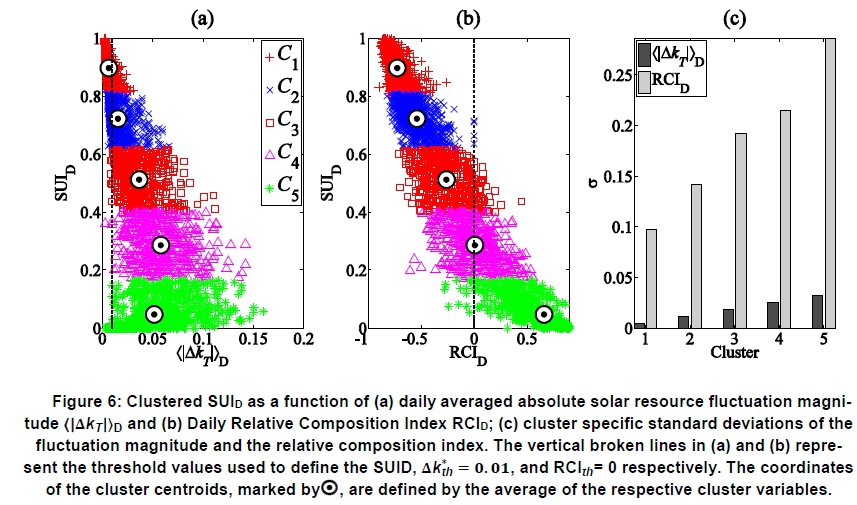
Further characteristics of the five clusters are demonstrated in in Figures 6(a) and (b), which show the SUId as a function of daily-averaged fluctuation magnitude  and daily-averaged relative composition index RCId respectively. There is a general increase in solar resource
  from cluster 1 to cluster 4. Cluster 5 shows a slight deviation from this trend, an indication of significant population of low fluctuation cloudy-sky solar resource within this cluster. The dispersion of the fluctuation magnitudes within each cluster also tended to increase with the cluster number as shown by the cluster-specific standard deviations in Figure 6(c). Figure 6 (b), while recalling that the RCId is an indication of the balance between the DHI and BHI, reveals that BHI dominated the solar resource belonging to clusters 1 to 3 (RCId < 0). Cluster 4, having and average RCId close to 0, appears to be evenly populated by both BHI dominated, and DHI dominated, solar resource. An additional cluster is conceivable from splitting cluster 4 along the RCId = 0. The within-cluster standard deviations of RCId are shown in Figure 6(c) and show a general increase with cluster number.
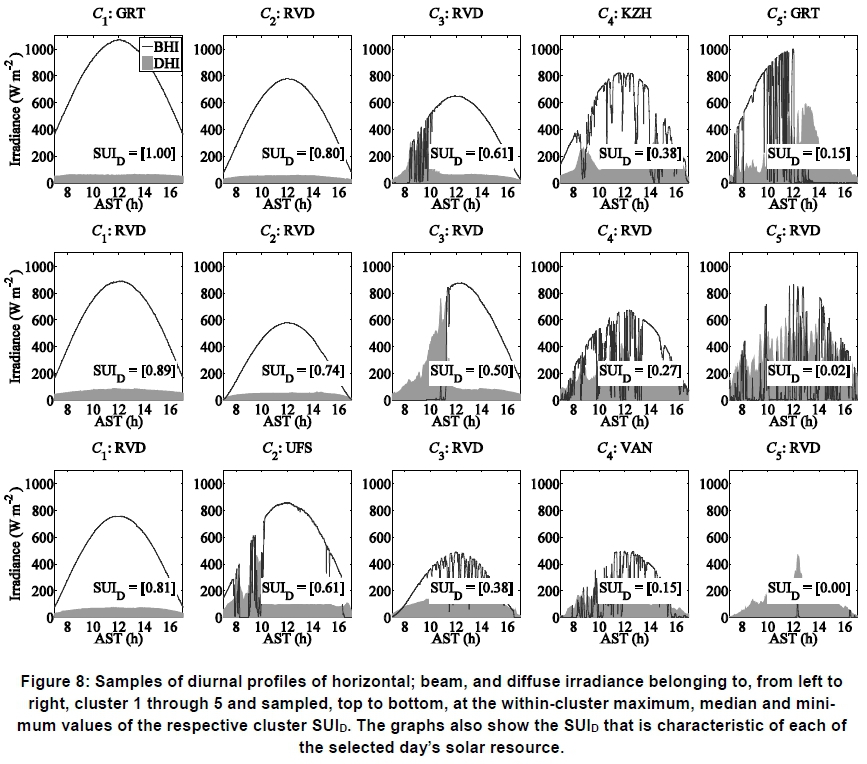
Figure 7 gives a summary of the characteristic statistics of the clusters in terms of the mean values of SUID, CSID, RCID and  . Figure 8 shows typical solar resource diurnal profiles sampled from each cluster at: maximum, median, and minimum SUId values. The profiles vary across the clusters in amplitude as well as the frequency and duration of cloud induced discontinuities. The trends of these variations correspond to the trends of the summary statistics depicted in Figure 7. For example, cluster 4 profiles shown in Figure 8 appear to have the highest frequency of discontinuities in agreement with mean value of
  , which is also largest for cluster 4 as shown in Figure 7. It is also noted that the solar resource profiles at the shared boundaries of the clusters show similar properties.
Cluster variation amongst stations
The observed varying of the five clusters was also investigated across the eight stations. Figure 9 shows silhouette plots of the five clusters for each station.
The results reveal a distribution of cluster populations that varied across the stations and appeared to be a function of site specific climatic conditions. For example, the solar resources at NMU and KZH were dominated by cluster 5-type solar resource, which represents the lowest values of the SUI, hence an indication of high prevalence of cloudy-sky conditions. The NMU and KZH are located in coastal cities of Port Elizabeth and Durban, respectively, and were characterised by sky conditions that are cloudy, or with shade, haze or low sun intensity for 37.5% and 46.5% of the possible sunshine hours, respectively [18]. The RVD, VAN, UFS and UPR, on the other hand, appeared to have a higher prevalence of clear-sky periods as shown by the larger populations of data points in clusters 1 and 2.
5. Conclusions
This paper proposes and presents a new solar resource metric named solar utility index that measures the fractional time when a solar resource has short-term fluctuation magnitudes and energy quality that satisfy given or set conditions during a time period t within a solar resource time span from sunrise to sunset. Five clusters were identified and were found to have reasonably homogeneous intra-cluster properties, in terms of energy content CSId, short-term variability  , and relative DHI and BHI composition RCId. A closer look at the cluster properties, however, revealed that clusters 5 and 4 can be split into smaller clusters by taking into account the distribution of their CSId and RCId, respectively. The theoretical basis of the SUI suggests that it can be computed for periods longer or shorter than the 10 hour daily period considered. It is therefore important to investigate its solar resource classifying properties for periods shorter or longer than the daily period. It is also interesting to investigate how the SUI performs as a solar resource forecasting metric.
Acknowledgements
The author wishes to acknowledge the Southern African Universities Radiometric Network as the source of solar radiation data used in this work.
References
1. Twidell, J. and Weir, T. 2006. Renewable energy resources, 2nd edition. Taylor and Francis. [ Links ]
2. Duffie, J. and Beckman, W. 2013. Solar engineering of thermal processes. 4th edition. John Wiley and Sons. [ Links ]
3. Peled, A. and Appelbaum, J. 2013. Evaluation of solar radiation properties by statistical tools and wavelet analysis. Renewable Energy 59: 30-38. http://dx.doi.org/10.1016/j.renene.2013.03.019. [ Links ]
4. Maafi, A. and Harrouni, S. 2003. Preliminary results of the fractal classification of daily solar irradiances. Solar Energy 75: 53-61. http://dx.doi.org/10.1016/S0038-092X(03)00192-0. [ Links ]
5. Soubdhan, T., Emilion, R. and Rudy, C. 2009. Classification of daily solar radiation distributions using a mixture of dirichlet distributions. Solar Energy 83: 1056-1063. http://dx.doi.org/10.1016/j.solener.2009.01.010. [ Links ]
6. Gastón-Romeo, M., Leon, T., Mallor, F. and Ramírez-Santigosa, L. 2011. A morphological clustering method for daily solar radiation curves. Solar Energy 85: 1824-1836. http://dx.doi.org/10.1016/j.solener.2011.04.023. [ Links ]
7. Stein, J. S., Hansen, C. W. and Reno, M. J. The variability index: A new and novel metric for quantifying irradiance and PV output variability. World Renewable Energy Forum, Denver, CO, 2012. [ Links ]
8. Kang, B. O. and Tam, K. 2013. A new characterization and classification method for daily sky conditions based on ground-based solar irradiance measurement data. Solar Energy 94 :102-118. http://dx.doi.org/10.1016/j.solener.2013.04.007. [ Links ]
9. Perez, R., Kivalov, S., Schlemmer, J., Hemker Jr, K. and Hoff, T. 2011. Parameterization of site-specific short-term irradiance variability. Solar Energy, 85 : 1343-1353. http://dx.doi.org/10.1016/j.solener.2011.03.016. [ Links ]
10. Ineichen, P. and Perez, R. 2002. A new airmass inde pendent formulation for the linke turbidity coefficient. Solar Energy, 73: 151-157. http://dx.doi.org/10.1016/S0038-092X(02)00045-2. [ Links ]
11. SNL. 2012. Pv_lib toolbox for matlab. Sandia National Laboratories. Available from: http://pvpmc.org/pv-lib/ [Accessed: 02 January 2015]. [ Links ]
12. Kalogirou, S. A. 2014. Chapter 11 - designing and modeling solar energy systems. In: Kalogirou, S. A. (ed.) Solar energy engineering, second edition. Bos ton: Academic Press, 583-699. http://dx.doi.org/10.1016/B978-0-12-397270-5.00011-X. [ Links ]
13. SAURAN. 2015. Southern African Universities Radiometric Network. Available from: http://www.sauran.nel/ [Accessed: 10 October 2015]. [ Links ]
14. Brooks, M. J., du Clou, S., van Niekerk, W. L., Gauche, P., Leonard, C., Mouzouris, M. J., Meyer, R., van der Westhuizen, N., van Dyk, E. E. and Vorster, F. J. 2015. Sauran: A new resource for solar radiometric data in Southern Africa. Journal of Energy in Southern Africa 26: 2-10. [ Links ]
15. Kipp and Zonen. 2017. Kipp & zonen pyranometers. Available from: http://www.kippzonen.com/Product-Group/3/Pyranometers [Accessed: 17 May 2017]. [ Links ]
16. Nabney, I. T. 2002. Netlab: Algorithms for pattern recognition. In: Singh, S. (ed.) Advances in pattern recognition. Great Britain: Springer. [ Links ]
17. Rousseeuw, P. J. 1987. Silhouettes: A graphical aid to the interpretation and validation of cluster analysis. Journal of Computational and Applied Mathematics, 20: 53-65. http://dx.doi.org/10.1016/0377-0427(87)90125-7. [ Links ]
18. Climatemps. 2014. Sunshine & daylight hours in Durban, South Africa. Climatemps. Available from: http://www.durban.climatemps.com/sunlight.php [Accessed: 27 January 2016]. [ Links ]
* Corresponding author: Tel: +27 31 260 4101: Email: Evans.zhandire@gmail.com

