


Servicios Personalizados
Articulo
 Inglés (pdf)
 Articulo en XML
 Referencias del artículo
Indicadores

Links relacionados
-
 Citado por Google
 -
 Similares en Google
Compartir

 Permalink
Journal of Energy in Southern Africa
versión On-line ISSN 2413-3051
versión impresa ISSN 1021-447X
J. energy South. Afr. vol.28 no.2 Cape Town may. 2017
http://dx.doi.org/10.17159/2413-3051/2017/v28i2a1673
ARTICLES
Is the summer season losing potential for solar energy applications in South Africa?
Jyotsna SinghI, * ; Andries KrugerI, II
ISouth African Weather Service, 442 Rigel Avenue South, Erasmusrand, Pretoria 0181, South Africa
IIDepartment of Geography, Geoinformatics and Meteorology, University of Pretoria, Private Bag X20, Hatfield 0028, Pretoria, South Africa
ABSTRACT
Seasonal trends using in situ sunshine duration (SD) and satellite, incoming shortwave solar radiation (SIS) data for South Africa over a period up to six decades were investigated. Trend analysis was applied to SD data of 22 sunshine-recording stations from the South African Weather Service that cover the length and breadth of South Africa. Satellite application facility on climate monitoring provided the high-resolution derived SIS for the period 1983-2013. A number of stations show a statistically significant decreasing trend in SD in all four seasons on a seasonal scale. Declines (number of stations showing significant trend) in SD at 17(7), 8(3), 7(3) and 3(0) stations, were observed for summer, autumn, winter and spring, respectively. The SIS has also shown a decreasing trend over South Africa in most of the regions during the summer season followed by autumn. The results indicated a general tendency of decrease in incoming solar radiation mostly during summer which could be of some concern for solar energy applications.
Keywords: in situ data, sunshine duration, shortwave solar radiation, satellite data, climate trends, solar energy
1. Introduction
Solar radiation data analyses across the world revealed that there was a decline in solar radiation from the 1950s to the 1990s (Singh et al., 2016; Wild, 2009). In South Africa also, studies by Singh, 2016 (1980s to 2000s) and Power and Mills, 2004 (1957 to 1997) indicated a decline in solar radiation. Air pollutants like atmospheric aerosols were considered to be one of the main reasons for this decline (Streets et al., 2006). Air pollution is one form of environmental pollution that is arguably the greatest problem the world is currently facing. The use of fossil fuels makes a paramount contribution to environmental pollution, including in South Africa, and many countries are now focusing on cleaner energy resources, in an endeavour to solve the issues of environmental pollution. South Africa showed a 37% increase in renewable energy consumption from 1990 to 2010, but the consumption of renewables was higher in some other African countries in 2010 (Nakumuryango and Inglesi-Lotz, 2016).
Research and development in the field of renewable energy will help to find ways of increasing renewable energy consumption. Dresselhaus and Thomas (2001) explained the alternative energy technologies that can be used to meet the world's energy demand. Solar energy is a freely available energy resource, and indirectly the source for all the other types of energy (e.g. wind, hydro and biomass energy) on earth. Most solar energy-related studies require three solar radiation parameters: global horizontal irradiance (GHI), direct normal irradiance (DNI) and diffuse horizontal irradiance (DHI) (Gauché et al., 2017; Martin-Pomares et al., 2017; Perez-Astudillo and Bachour, 2014). Different types of radiometric instruments - such as pyra-nometers for GHI, pyrheliometers for DNI and shaded ring pyranometers for DHI - are needed to measure different types of irradiances. These instruments are expensive, making it not feasible to install all of them at many locations to develop a dense radiometric network. The network for measuring the duration of sunshine is, however, dense compared with GHI, DNI and DHI. There are long established sunshine duration (SD) measurement activities across the world (Sanchez-Romero et al, 2015). The data availability for SD is also better than for GHI, DNI and DHI in South Africa because simpler and less expensive instruments are used for measuring it.
The SD (also known as the sunshine hour or bright sunshine hour) is a measure of the duration of sunshine for that day. The device (sunshine recorder) for measuring sunshine hours is simple (more details in Section 2), but useful information can be generated from the data and can be employed in many areas of research. This data has been used in several studies, including for air quality (Sanchez-Romero et al, 2016; Li et al., 2016); environmental pollution (Kaiser and Qian, 2002; Statheropoulos et al., 1998); energy (Yaiche et al., 2014); and solar radiation prediction modelling studies (Mulaudzi et al., 2015; Adeyemi et al., 2015; Singh et al, 2011). The sunshine hour of any day is affected by varying atmospheric and sky conditions, so SD can, therefore, indirectly indicate atmospheric turbidity, visibility and sky conditions.
There is a relatively dense network of in situ SD observation points over South Africa. Satellite data is, however, always a better option when it comes to spatial coverage (Rees, 2013; Bojanowski et al., 2014; Singh, 2016). Various issues related to satellite data, like low temporal resolution compared to the in situ data must nonetheless be taken into account. Where both in situ and satellite data are available, it is advisable to use both to extract the most possible information. The satellite application facility (SAF) on climate monitoring (CM), CM-SAF produced the surface solar radiation dataset -Heliostat (SARAH); which provides a useful high-resolution data set of incoming surface shortwave (SIS) for solar radiation studies. The use of this data set has become popular in the scientific community (Ruiz-Arias et al., 2016, Trentmann et al., 2016; Badescu and Dumitrescu, 2013). The present study aims to assess long-term trends in SD and change detection using SIS over South Africa on a seasonal scale. The datasets and periods used in the analyses are explained in detail.
2. Study region and datasets
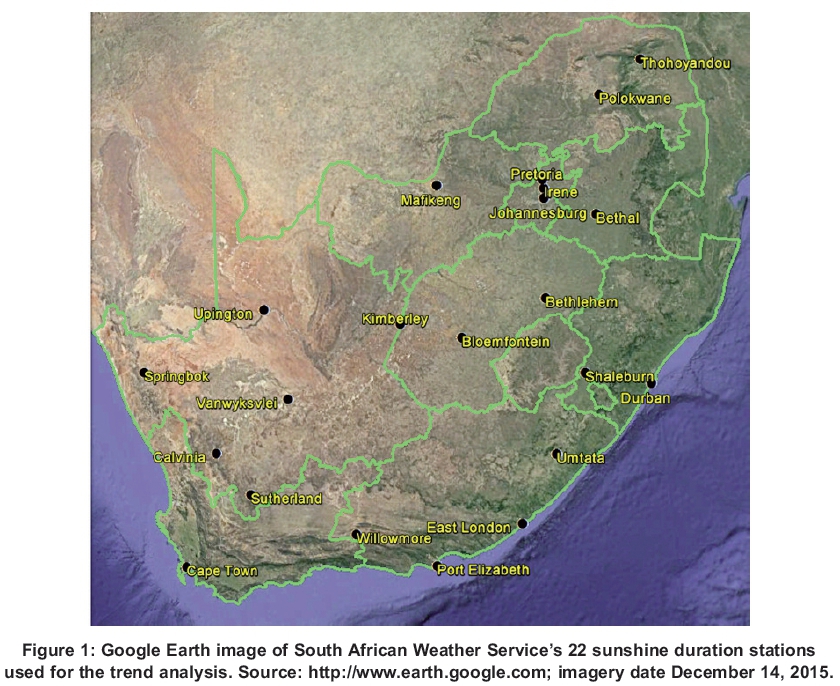
The present study has been conducted over the country using in situ SD observation data (22 stations) from the South African Weather Service (SAWS) and SARAH SIS satellite data set from CM-SAF. The SAWS has a dense network of SD stations, most of which have measurements from 1950 onwards. The selected 22 stations cover all nine provinces of South Africa, as shown in Figure 1. The long-term SD dataset is required for trend analysis studies. The Campbell-Stokes sunshine recorder, invented in the late nineteenth century (Sanchez-Romero et al., 2015), was the only instrument that SAWS used to measure the sunshine.
This instrument allows SD to be determined by calculating the burn mark made by the sun on a specially coated card. It also indicates times or periods of cloudiness and solar irradiance along with SD (Wood and Harrison, 2011; Stanhill, 2003).
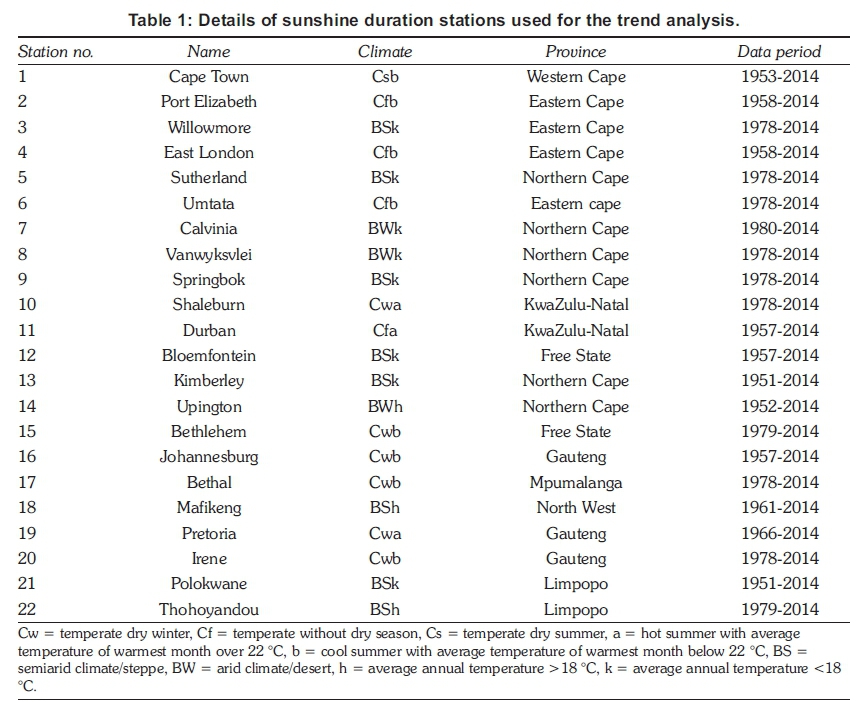
The time series produced from the measured data can be regarded as homogeneous if the instrument was continuously well-exposed during the station's history. Many stations that could otherwise have been used in the study had large gaps in their time series, while most stations have data only since around 1978. The 22 selected stations are given in Table 1, together with the analysis periods, from various start dates up to the end of 2014. Relevant climatic regions of the stations are also given, with many in arid or semiarid environments (Kruger, 2004).
The SIS or global radiation was derived from the long-term EUMETSAT CMSAF a European Union-based initiative to produce high-quality satellite-derived data and services for climate monitoring (Müller et al., 2015). The SARAH dataset comprises derived global solar surface radiation with a resolution of 0.05° x 0.05° for the period 1983-2013 (Müller et al., 2015).
3. Methodology
This investigation focuses on SD and SIS trends in different seasons. The SD data used goes back to 1951 and was minutely analysed for quality assurance.
3.1 Data quality
Only those years were used for the trend analysis where percentage SD data availability was more than 90%. The SD data was checked carefully and all the impossible SD values were removed, e.g., the days where more hours are reported than the maximum possible SD. False zeros were also removed, thus ensuring quality SD data before trend analyses.
3.2 Trend analysis
Trend analysis was performed on the quality checked SD data on a seasonal scale - summer: December, January and February (DJF); autumn: March, April, and May (MAM); winter: June, July, and August (JJA); and spring: September, October, and November (SON). The significance of the linear trend was tested using the t-test at the 5% level of significance and the change detection method was used on SIS datasets. The differences in attributes, processes, and phenomena over different time periods in the change detection method were examined. The SIS dataset (1983-2013) was subsequently divided into two groups of almost equal periods, (i) 1983-1997 and (ii) 1998-2013. The detection of the change between the two data groups was achieved by subtracting the mean of (i) from (ii).
4. Results and discussion
There was, in most cases, a broad agreement between the seasonal SD and SIS data. Figure 2 illustrates, per season, the differences in the average global solar radiation/SIS received between the periods 1983-1997 and 1998-2013 from the CM-SAF SARAH data. Table 2 presents the results of linear trends of the daily sunshine hours received per season for the periods from the start year (as indicated in Table 1) to 2014.
4.1 Trends in SD
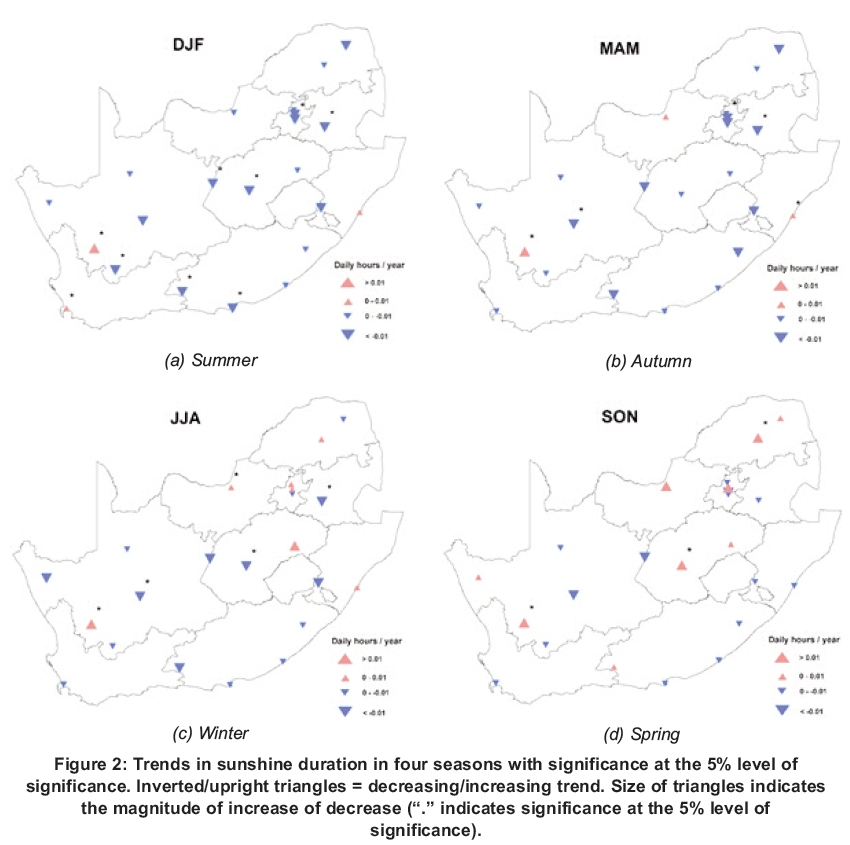
Significant trends at 5% level of significance (p<0.05) are marked by an asterisk in Table 2. Kimberley and Vanwyksvlei in the Northern Cape Province were the only two out of the 22 stations that showed declining trends in all seasons.
The decline in SD at Kimberley in all the seasons was possibly because of the mining in this area, as mining activities release air pollutants that interact with the incoming solar radiation. No trend was observed at Upington over all the seasons. It was noted that Calvinia, on the other hand, was the only station where a significant increase in SD occurred in all seasons. Calvinia is a sparsely populated regional town in Northern Cape Province with little industrial activity. The Eastern Cape stations also showed a decline or no trend in all the seasons, except Willowmore, where there was an increasing trend (0.01 hr yr-1) in SD in spring. Both stations (Bloemfontein and Bethlehem) in the Free State Province showed a decline in SD during summer. Bloemfontein showed a decreasing trend in SD in summer (-0.01* hr yr-1) and winter (-0.01* hr yr-1), but an increasing trend in SD was observed during spring (0.02* hr yr-1). Bethlehem showed a declining trend in SD only in summer (-0.01* hr yr-1), and in other seasons either no or and increasing trend were observed in SD. This could be explained by the possibility of less aerosol concentration over the Free State during winter and spring season, probably because of the cleaning of the atmosphere by baroclinic westerly disturbances passing over the region. This disturbance is associated with high wind speed and advection of cleaner air from the west (Ross et al., 2003).
Two stations of KwaZulu-Natal indicated opposite behaviour. In Shaleburn, there was a negative trend in SD in all the seasons, except spring with no trend. In Durban, on the other hand, increasing trends were observed in autumn (0.01* hr yr-1) and winter (0.01 hr yr-1). No trend was observed during summer and spring in Durban. The two stations of Limpopo were also characterised by declining trends in summer: Polokwane (-0.01 hr yr-1) and Thohoyandou (-0.01 hr yr-1). North West province (Mafikeng), however, displayed a declining trend only in summer (-0.01 hr yr-1), and in other seasons showed an increasing trend: autumn (0.01 hr yr-1), winter (0.01* hr yr-1), and spring (0.02 hr yr-1). The SD in the Western Cape (Cape Town) did not show any trend in most of the seasons, except an increasing trend in summer (0.01* hr yr-1).
Mpumalanga (Bethal) showed a declining SD trend in all the seasons except spring, when there was no trend. A maximum decline in SD (-0.04* hr yr-1) over this station during summer was also observed. There are many thermal power stations in Mpumalanga (http://www.eskom.co.za/sites/her-itage/Documents/Mpumalanga90th.pdf). Eskom Komati power station near Bethal consumes 10 000 tonnes of coal per day (Singer, 2010). Coal-fired power plants produce many pollutants like sulphur dioxide, nitrogen oxides, ash, and particulate matter. An increase in atmospheric load because of the particulate matter might account for a decrease in the incoming solar radiation.
Gauteng, also in summer, displayed a decreasing SD trend at all three stations: Irene (-0.02 hr yr-1), Pretoria (-0.01 hr yr-1) and Johannesburg (0.02* hr yr-1). Irene, however, was characterised by maximum decreasing trend during autumn (-0.03* hr yr-1). In this province, Johannesburg was the only station with a declining SD trend in all the seasons except winter (no trend). Johannesburg, Bloemfontein and Pretoria, as the largest cities in the interior, all showed a declining trend in SD during summer. Johannesburg is densely populated and the economic capital of South Africa, with road traffic, biomass burning and industrial activities contributing to the particulate and gaseous pollutants. The city is also near the industrialised region of Mpumalanga (100 km west) and Vaal Triangle (50 km south) and these areas also influence its air quality (Aurela et al., 2016).
During summer most of the stations showed a decreasing trend except Cape Town and Calvinia. Upington, Springbok and Durban, however, displayed no trend in SD in summer. In summer, out of the total number of stations (22), 17 stations showed declining trends with 7 of them statistically significant. In autumn, 8 stations showed declines with 3 significant, in winter 7 and 3, and spring 3 with 0 significant. The decrease in SD in summer was likely caused by cloudier conditions. The inverted triangles in Figure 2 indicate a decline in SD, while upright triangles show the increasing trend. The size of the triangles signifies the magnitude of decrease or increase. From Figure 2, there are more inverted triangles than upright ones during summer (Figure 2a), followed by autumn (Figure 2b).
The SD trends in Figure 2 accord with the decreasing trend in worldwide solar radiation (Wild, 2009). Several studies have explained the decrease in solar radiation in past decades by an increase in aerosol concentrations and cloud cover (Singh et al., 2012; Wild 2009; Liepert and Kukla 1997).
Summer in South Africa is the main rainfall season except for the western and southern Cape regions. Clouds can absorb and reflect the incoming solar radiation and in this way play an important role in the decline of solar radiation. Kruger (2007) observed a decline in total cloud cover over South Africa for the period 1960-2005, with the decline at a minimum during autumn and summer. The current analyses also showed that a decrease in SD was at a maximum in summer, followed by autumn. Southern and south-western parts of the country also experienced an increase in cloud cover (Kruger, 2007), which could explain the significant decrease in SD in Willowmore (-0.03* hr yr-1), Sutherland (-0.03* hr yr-1), and Port Elizabeth (0.01* hr yr-1). Studies have confirmed that a decline in solar radiation during cloudy conditions was greater than with clear skies (Wang et al., 2014; Liepert and Kukla 1997). Aerosols are mainly responsible for the decline in solar radiation during clear sky conditions.
4.2 Change detection in SIS
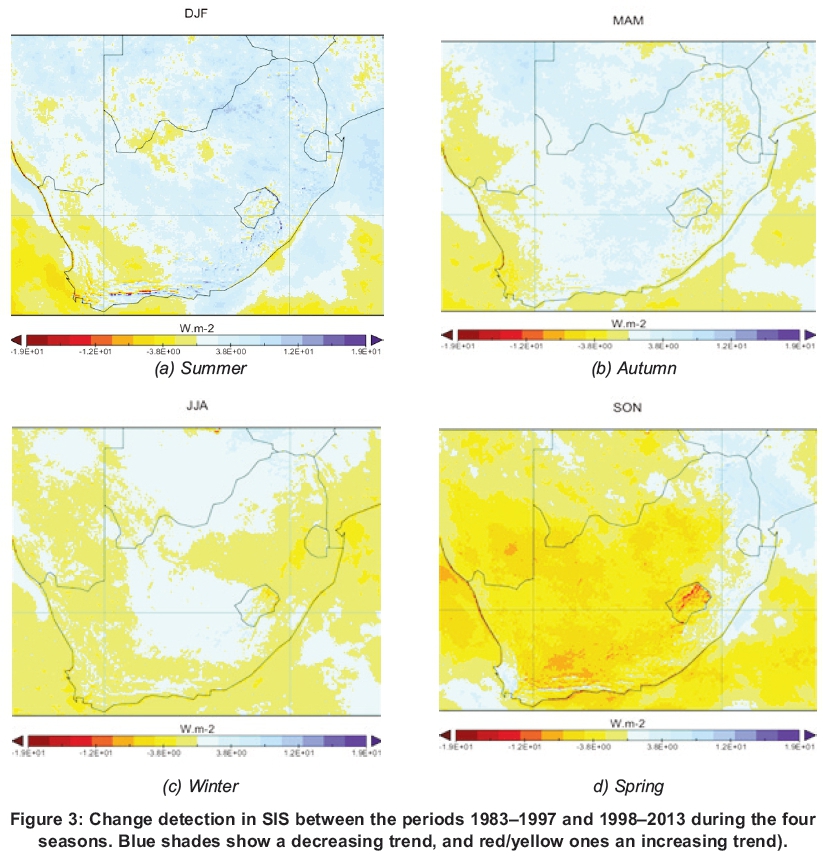
This investigation endeavoured to identify the differences in SIS over different time periods. The calculations explained in Section 3 showed that the positive change was associated with a decreasing trend, while a negative change with an increasing trend. The positive and negative changes are shown in blue and yellow/red, respectively, in Figure 3.
Cape Town showed a positive or no SD trend in all seasons. The SIS data also showed that, in almost all seasons, the change was negative, meaning that the amount of incoming solar radiation over this region followed a positive trend. Satellite data of SIS and SD trend results showed approximately the same behaviour, i.e. a decrease in SIS over most of the country, except for the south-western Cape and some areas in the west of the Northern Cape and the interior of the Western Cape. Autumn showed SIS trends similar to those of summer, but with the SARAH data showing, for most regions, little change over the 1983-2013 period. The decreasing trend was evident in the winter season from the SARAH data. The only stations with significantly positive trends were Calvinia in the southern Northern Cape and Mafikeng in North-West. Most of the country for spring showed a positive tendency of received radiation, in contrast with summer and autumn. Some areas in the western interior that showed large differences between the radiations received during 1997-2014 and 1983-1996, however, probably indicated strong positive trends.
5. Conclusions
This study set out to analyse long-term seasonal trends in sunshine hours using in situ SD and satellite CM-SAF, SARAH SIS data, with linear trend
analysis. It was shown that a decline in SD occurred mostly in summer. The results from the satellite-derived radiation SIS matched with the SD trend in summer. The results could provide helpful information for current and future developments in solar energy-based projects. Further research, particularly into the effect of aerosols and cloud cover on incoming solar radiation could prove useful.
Acknowledgement
The authors acknowledge the European Organisation for the Exploitation of Meteorological Satellites (EUMET-SAT) Satellite Application Facility on Climate Monitoring (CMSAF) for incoming surface shortwave radiation data, and the reviewer and editor of this journal for their valuable comments.
References
A new dawn has arrived 1923-2013 Mpumalanga Province (http://www.eskom.co.za/sites/heritage/Documents/Mpumalanga90th.pdf) (accessed 11 December 2016). [ Links ]
Aurela, M., Beukes, J.P, Van Zyl, PG., Vakkari, V, Teinilä, K., Saarikoski, S. and Laakso, L. 2016. The composition of ambient and fresh biomass burning aerosols at a savannah site, South Africa. South African Journal of Science 112(5/6): 1-8. [ Links ]
Adeyemi, A.A., Huan, Z. and Enweremadu, C.C. 2015. Evaluation of global solar radiation using multiple weather parameters as predictors for South Africa provinces. Thermal Science 19(2): S495-S509. [ Links ]
Badescu, V and Dumitrescu, A. 2013. The CMSAF hourly solar irradiance database (product CM54): Accuracy and bias corrections with illustrations fo Romania (south-eastern Europe). Journal of Atmospheric and Solar-Terrestrial Physics 93: 100-109. [ Links ]
Bojanowski, J.S., Vrieling, A. and Skidmore, A.K. 2014. A comparison of data sources for creating a long-term time series of daily gridded solar radiation for Europe. Solar Energy 99:152-171. [ Links ]
Dresselhaus, M.S. and Thomas, I.L. 2001. Alternative energy technologies. Nature 414(6861): 332-337. [ Links ]
Gauché, P, Rudman, J., Mabaso, M., Landman, W.A., von Backstrõm, T.W. and Brent, A.C. 2017. System value and progress of CSP Solar Energy. Doi.org/10.1016/j.solener.2017.03.072. [ Links ]
Google Earth Image: Source: http://www.earth.google.com. Imagery date- December 14, 2015. December 10, 2016. (Retrieved on 10 December, 2016). [ Links ]
Kaiser, D.P and Qian, Y 2002. Decreasing trends in sunshine duration over China for 1954-1998: Indication of increased haze pollution? Geophysical Research Letters 29(21). [ Links ]
Kruger, A.C. 2004. Climate of South Africa. Climate regions. WS45. South African Weather Service, Pretoria. [ Links ]
Kruger, A.C. 2007. Trends in cloud cover from 1960 to 2005 over South Africa. Water SA, 33(5): 603-608. [ Links ]
Li, J., Liu, R., Liu, S.C., Shiu, C.J., Wang, J. and Zhang, Y. 2016. Trends in aerosol optical depth in northern China retrieved from sunshine duration data. Geophysical Research Letters 43(1): 431-439. [ Links ]
Liepert, B.G. and Kukla, G.J. 1997. Decline in global solar radiation with increased horizontal visibility in Germany between 1964 and 1990. Journal of Climate, 10(9): 2391-2401. [ Links ]
Martín-Pomares, L., Martinez, D., Polo, J., Perez- Astudillo, D., Bachour, D. and Sanfilippo, A. 2017. Analysis of the long-term solar potential for electricity generation in Qatar. Renewable and Sustainable Energy Reviews 73:1231-1246. [ Links ]
Müller, R., Pfeifroth, U., Trãger-Chatterjee, C., Trentmann, J. and Cremer, R. 2015. Digging the METEOSAT treasure-3 decades of solar surface radiation. Remote Sensing 7(6):8067-8101. [ Links ]
Müller, Richard; Pfeifroth, Uwe; Trãger-Chatterjee, Christine; Cremer, Roswitha; Trentmann, Jõrg; Hollmann, Rainer. 2015. Surface Solar Radiation Data Set - Heliosat (SARAH) - Edition 1. Satellite Application Facility on Climate Monitoring. http://dx.doi.org/10.5676/EUM_SAF_CM/SARAH/V001. [ Links ]
Mulaudzi, T.S., Maluta, N.E. and Sankaran, V 2015. Evaluation of the global solar irradiance in the Vhembe district of Limpopo Province, South Africa, using different theoretical models. Turkish Journal of Physics 39(3): 264-271. [ Links ]
Nakumuryango, A. and Inglesi-Lotz, R. 2016. South Africa's performance on renewable energy and its relative position against the OECD countries and the rest of Africa. Renewable and Sustainable Energy Reviews 56: 999-1007. [ Links ]
Perez-Astudillo, D. and Bachour, D. 2014. DNI, GHI and DHI ground measurements in Doha, Qatar. Energy Procedia 49: 2398-2404. [ Links ]
Power, H. C., and Mills, D. M. 2004. Trends in solar radiation over South Africa and Namibia during the period 1957-1997. Presented at American Geophysical Union Spring Meeting 2004. [ Links ]
Rees, W.G., 2013. Physical principles of remote sensing. Cambridge University Press. [ Links ]
Ross, K.E., Piketh, S.J., Bruintjes, R.T., Burger, R.P, Swap, R.J. and Annegarn, H.J. 2003. Spatial and seasonal variations in CCN distribution and the aerosol-CCN relationship over southern Africa. Journal of Geophysical Research: Atmospheres 108(D13). [ Links ]
Ruiz-Arias, J.A., Arbizu-Barrena, C., Santos-Alamillos, FJ., Tovar-Pescador, J. and Pozo-Vázquez, D. 2016. Assessing the surface solar radiation budget in the WRF model: A spatiotemporal analysis of the bias and its causes. Monthly Weather Review 144(2): 703-711. [ Links ]
Sanchez-Romero, A., Gonzalez, J.A., Calbó, J. and Sánchez-Lorenzo, A. 2015. Using digital image processing to characterize the Campbell-Stokes sunshine recorder and to derive high-temporal resolution direct solar irradiance. Atmospheric Measurement Techniques 8(1): 183-194. [ Links ]
Sanchez-Romero, A., Sanchez-Lorenzo, A., González, J.A. and Calbó, J. 2016. Reconstruction of long- term aerosol optical depth series with sunshine duration records. Geophysical Research Letters 43: 1296-1305. https://doi.org/10.1002/2015GL067543. [ Links ]
Stanhill, G. 2003. Through a glass brightly: some new light on the Campbell-Stokes sunshine recorder. Weather 58(1): 3-11. [ Links ]
Statheropoulos, M., Vassiliadis, N. and Pappa, A. 1998. Principal component and canonical correlation analysis for examining air pollution and meteorological data. Atmospheric Environment 32(6): 1087-1095. [ Links ]
Singer, M., 2010. Changing conceptions of South African coal-based pollution, with special reference to the Witbank coalfield, 1906-1978. University of the Witwatersrand, Johannesburg (Doctoral dissertation). http://hdl.handle.net/10539/8366. [ Links ]
Singh, J., Kumar, M. and Bhattacharya, B.K. 2011. Estimation of diffuse insolation for Nagpur, India. Geophysical Research Abstracts 13, EGU2011-906-1. [ Links ]
Singh, J. 2016. Ranking South African provinces on the basis of MERRA 2D surface incident shortwave flux. Journal of Energy in Southern Africa 27(3): 50-57. [ Links ]
Singh, J., Bhattacharya, B.K. and Kumar, M. 2012. Solar radiation and evaporation trend over India. Journal of Earth Science and Engineering 2(3): 160-165. [ Links ]
Singh, J. and Kumar, M. 2016. Solar radiation over four cities of India: Trend analysis using Mann-Kendall statistical test. International Journal of Renewable Energy Research (IJRER) 6(4): 1385-1395. [ Links ]
Singh, J., Kumar, M. and Bhattacharya, B.K. 2012. Global radiation, transmissivity and bright sunshine hour trend over Nagpur in pre-monsoon and mon soon seasons. Atmospheric and Climate Sciences. 2(2): 206-209. [ Links ]
Streets, D. G., Wu, Y., and Chin, M. 2006.Two-decadal aerosol trends as a likely explanation of the global dimming/brightening transition. Geophysical Research Letters 33, L15806. Doi: 10.1029/2006gl026471. [ Links ]
Trentmann, J., Müller, R.W., Posselt, R. and Stõckli, R. 2013, April. Satellite-based surface solar radiation data provided by CM SAF-Solar energy applications. In EGU General Assembly Conference Abstracts 15, EGU2013-10494. [ Links ]
Wang, L., Gong, W., Lin, A. and Hu, B. 2014. Analysis of photosynthetically active radiation under various sky conditions in Wuhan, Central China. International Journal of Biometeorology 58(8): 1711-1720. [ Links ]
Wild, M. 2009. Global dimming and brightening: A review. Journal of Geophysical Research: Atmospheres 114(D10), D00d16. Doi: 10.1029/2008jd011470. [ Links ]
Wood, C.R. and Harrison, R.G. 2011. Scorch marks from the sky. Weather 66(2): 39-41. [ Links ]
Yaiche, M.R., Bouhanik, A., Bekkouche, S.M.A., Malek, A. and Benouaz, T. 2014. Revised solar maps of Algeria based on sunshine duration. Energy Conversion and Management 82: 114-123. [ Links ]
* Corresponding author: Tel: +27 12 367 6049; email: jsinghenv@gmail.com

