


Services on Demand
Article
 English (pdf)
 Article in xml format
 Article references
Indicators

Related links
-
 Cited by Google
 -
 Similars in Google
Share

 Permalink
Journal of Energy in Southern Africa
On-line version ISSN 2413-3051
Print version ISSN 1021-447X
J. energy South. Afr. vol.28 n.2 Cape Town May. 2017
http://dx.doi.org/10.17159/2413-3051/2017/v28i2a1740
ARTICLES
The impact of residential rooftop solar PV on municipal finances: An analysis of Stellenbosch
N. KorstenI; A.C. BrentII, III, *; A.B. SebitosiIV; K. KritzingerII
ISchool of Public Leadership, and the Centre for Renewable and Sustainable Energy Studies, Stellenbosch University; Private Bag X1, Matieland, 7602, South Africa
IIDepartment of Industrial Engineering, and the Centre for Renewable and Sustainable Energy Studies, Stellenbosch University; Private Bag X1, Matieland, 7602, South Africa
IIISustainable Energy Systems, School of Engineering and Computer Science, Victoria University of Wellington; PO Box 600, Wellington, 6140, New Zealand
IVDepartment of Mechanical and Mechatronic Engineering, and the Centre for Renewable and Sustainable Energy Studies, Stellenbosch University; Private Bag X1, Matieland, 7602, South Africa
ABSTRACT
Electricity utilities throughout the world are responding to the increased uptake of rooftop solar photovoltaic (PV) in the household sector. Although the increase of decentralised solar PV is seen as progressive for sustainable development, it is not without financial implications for electricity utilities. There is a concern in South Africa that allowing rooftop solar PV connection to the grid will reduce electricity sales for local governments and thus their revenue streams from electricity. An investigation was carried out to examine the financial impact that increasing installations of grid-connected rooftop PV at a household level might have on local governments in South Africa. Stellenbosch Municipality was used as a case study, and two different approaches were used. The first considered the maximum grid capacity for distributed generation, as determined by the South African grid standards. The second was based on individual households that would gain the most financial benefit from investing in rooftop PV. The outcome indicated a financial reduction in total electricity revenue of 0.6-2.4% depending on the approach followed. A fixed monthly charge of about R363 would counter these potential financial loses, but entail a disincentive for households to invest in solar PV installations.
Keywords: renewable energy; electricity utility revenue; embedded energy; distributed generation; photovoltaic
1. Introduction
Worldwide, the uptake of distributed electricity generation has increased and, in some places, even boomed (Burger and Weinmann, 2014; Mountain and Szuster, 2014), causing a disruption in a once robust regime of centralised electricity utilities. Although a transitioning away from the reliance on centralised, unsustainable, fossil fuel-based electricity will be a positive development, it is not without implications for electricity utilities that may see their revenues decline as a result. Since households are able to produce their own decentralised electricity through rooftop solar photovoltaic (PV) systems, and thereby reduce their electricity consumption from the grid, sales of utilities are threatened. Rooftop PV is therefore seen as a disruptive technology to the traditional order that worked well for decades. This change in the traditional centralised and regulated business model of utilities is accelerated by continuous falling costs of rooftop PV, public policy support of distributed generation (Kirsch and Morey, 2015), and, in the case of South Africa, drastic price increases of conventional grid-supplied electricity (Walwyn and Brent, 2015). The transition of the centralised electricity sector to more decentralised, sustainable energy production leads to a structural change in the electricity industry. As a consequence of this transition, electricity utilities face new challenges and have to re-evaluate the way of operating their business in order to generate enough revenue to remain sustainable (Richter, 2012). The responses towards the changing electricity business environment, and especially the reduction of revenue as a result of decentralised electricity generation, differ per utility in different countries. As stated in the report of REN21 (2015), utilities in many countries attempt to push back against the expansion of rooftop solar PV because of concerns about shrinking electricity sales and revenue loss. Major utilities in Australia acted to slow or halt the development of solar PV installations, as they were concerned about their future prospects (Parkinson, 2014). Utilities in Japan restricted PV access to the grid, and in many United States jurisdictions, as well as in Europe, the debates about retail tariff design and net-metering laws continue within the context of increasing distributed generation (REN21, 2015). The signs of change are initially noticeable in countries with mature economies, low or non-existent energy demand growth, high and rising electricity tariffs, ambitious renewable energy targets, and supportive policies that encourage decentralised generation (Sioshansi, 2014). Similar conditions to those in mature economies are, however, expected to apply to an increasing number of countries over time (Sioshansi, 2014).
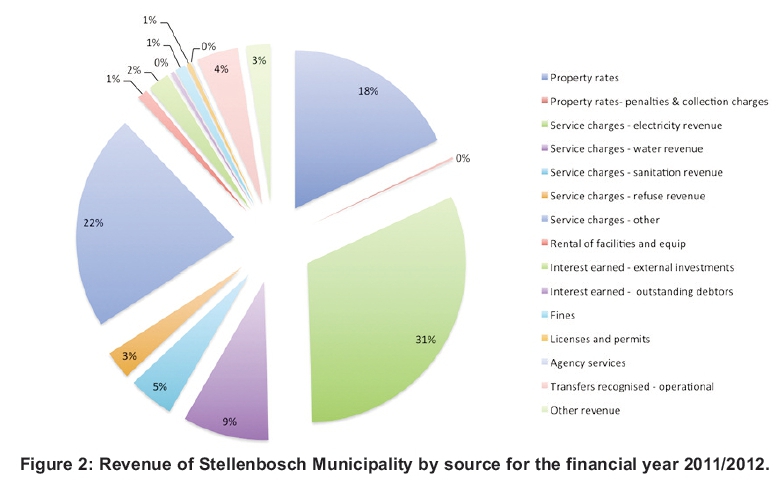
There is also an increasing amount of households in South Africa investing in sustainable energy technologies, such as rooftop solar PV systems, since it has become more financially attractive (Ahlfeldt, 2013), although not yet on a massive scale. South African municipalities face financial challenges similar to those of utilities across the world, as they are historically responsible for the distribution network and sales of electricity within their borders of jurisdiction (Sebitosi, 2010). This is especially relevant since municipalities are allowed to generate a surplus on the revenue that can be channelled to other municipal services (Swilling and de Wit, 2010). The study summarised in this investigation examined the possible financial implications of residential solar PV installations for Stellenbosch Municipality in South Africa. As is shown in the paper, the municipality generates around 30% of its total revenue stream from electricity sales, the highest single revenue item for the municipality when compared with other services. It is, therefore, not surprising that the loss of income to decentralised energy generation is a concern to the municipality, given that this revenue is used to supplement underfunded services.
The aim of the paper is, firstly, to investigate what the potential revenue reduction would be if society fully exploited the maximum capacity of the electricity grid to incorporate residential distributed generation. Secondly, to use an approach that examines the financial impact considering only the households that can exploit the maximum financial benefit from such an investment, according to a set of criteria. Lastly, to inform policy-makers on how to respond to an inevitable energy transition.
2. Unsustainable business model of electricity utilities
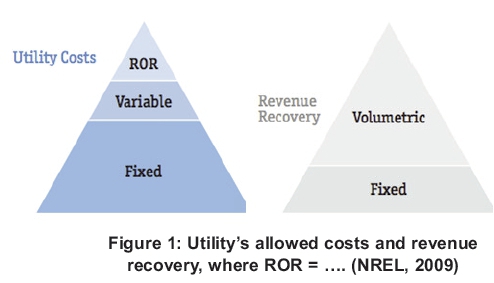
The traditional business model of electricity utilities is based on revenue collection through volumetric (consumption-based) sales (Nillesen et al., 2014). In basic terms, the more electricity units are sold, the more revenue is generated. Some public state utilities in the United States in the 1980s and 1990s already saw the need to re-examine the model and applied a decoupling mechanism (Carter, 2001). This was mainly because of the impacts of energy efficiency and energy reduction and the need to finance the high fixed costs of the grid infrastructure and maintenance over long periods. The urgency to revise the old business model was, however, not pressing until the rapid increase in distributed generation, with the increase in 'prosumers' (consumers of grid electricity who produce electricity as well). These trends led to a decrease in electricity sales for utilities. The problem lies in the inherent unsustainability of an electricity rate, or tariff, design based on volumetric sales (Felder and Athawale, 2014). The problem is that the costs incurred by utilities do not decrease in proportion to the decrease in electricity consumed. This is because the fixed costs utilities pay for the distribution infrastructure are so high that they need to be recovered over a long period (Cai et al., 2013). When an electricity consumer is only charged for the costs per kWh consumed, provided net-metering is applied, this would jeopardise cost recovery of the capital expenditures that are not related to kWh consumed, but to kW capacity invested (Eid et al., 2014). Volumetric sales in South Africa is also a prevalent business model used by Eskom, the single national utility, as well as local municipalities that buy electricity from Eskom and resell it to customers (Swilling and de Wit, 2010). Stellenbosch Municipality, in the Western Cape Province of South Africa, also has a sales system based on volume to recover its costs for electricity provision (Stellenbosch Municipality, 2013). Figure 1 shows a utility's costs in proportion to cost recovery through volumetric sales and fixed charges, and that the fixed costs are not recovered through just fixed charges, but mainly through volumetric sales (NREL, 2009).
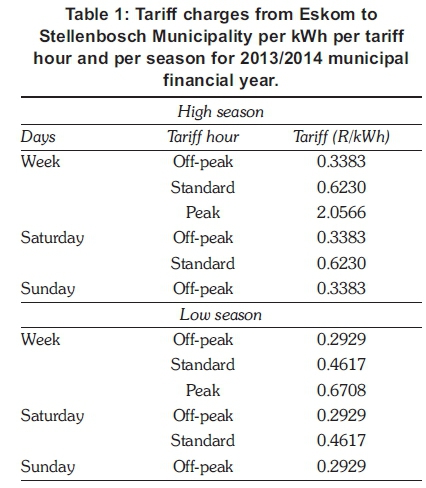
As a result of decreases in electricity demand, overall electricity rates or tariffs must increase so that utilities can continue to recover the fixed costs. A further increase in electricity tariffs leads to more incentives for people to invest in self-generation systems, such as rooftop solar PV. Rooftop PV adoption, therefore, in combination with increasing electricity rates, leads to a positive feedback loop - a process in which a disturbance to the system includes a constant re-enforcing in the magnitude of the occurrence (Cai et al., 2013). This may lead to a death spiral from a utility's perspective, representing an unstable dynamic process that threatens the prospects for its financial viability (Costello and Hemphill, 2014). 'A utility death spiral refers to the reinforcing feedback loop of higher prices for electricity paired with customers who are switching to lower-cost alternatives' (Hedman, 2014). A further challenge is that the most expensive hours to supply electricity are contemporaneous with electricity peak demand hours (Duthu and Bradley, 2015). PV-generated electricity occurs during the day when higher residential electricity consumption is actually a benefit for the municipality, because of a lower purchasing price (from the national utility). The national utility discourages municipal electricity consumption by charging higher prices at peak hours, which occurs early mornings and evenings during the week. Residential rates charged by the municipality, however, do not change based on time-of-use; the tariff for residential consumption remains the same. The municipality, therefore, makes more money from the electricity sold during the day and would benefit more from higher residential consumption at daytime. A form of energy storage might mitigate this problem somewhat. Table 1 shows the tariffs Stellenbosch Municipality paid in the 2013/2014 financial year to Eskom based on a time-of-use (TOU) model. Eskom charges Stellenbosch Municipality based on the time, day, and whether electricity is consumed in low season (summer) or high season (winter). The most expensive hours are at peak in high season when it costs more than R2 per unit of electricity.
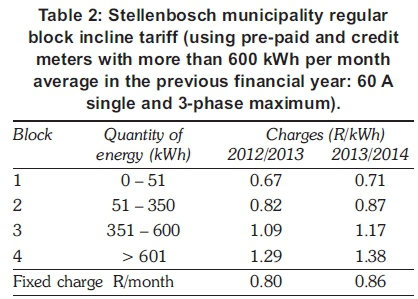
The tariff structure for residential households in Stellenbosch municipality, in contrast, is shown in Table 2. This tariff is not based on the TOU, but on a block-incline-tariff (BIT) with pre-paid or credit contracts. The data shows that the municipality pays more to Eskom during peak hours in winter than it receives from its electricity consumers, even when it pays the highest BIT. It would be an advantage for the municipality if solar decentralised generation could provide electricity during peak hours. However, only a small portion of the peak is typically covered with solar energy, as data further in this article will show.
3. Methodology
A single case study methodology was deemed most appropriate to the enquiry. A case study refers to a process of examining and analysing in depth (AAPS, 2012). Stellenbosch Municipality was chosen as the case study because of a good working relationship with the University of Stellenbosch and accessibility to prerequisite data. The scope includes the suburbs Uniepark and Karindal, Dalsig and Brandwacht, Paradyskloof and Die Boord, Onder Papegaaiberg, and Welgevonden, which were grouped according to how the municipality manages the electricity distribution network with respect to the main substations. The rationale for choosing these areas was their high average and maximum electricity usage on monthly and yearly bases. Two different approaches were followed.
The first approach was based on grid capacity, examining the maximum distributed generation that the distribution grid of Stellenbosch can easily incorporate before grid studies are needed. The grid standards (NRS) of South Africa were used as guiding principles. This extreme case approach (upper limit of the current system according to NRS guidelines) was used to model future scenarios of the share of embedded generation onto the municipal electricity grid in comparison with conventional municipality-distributed electricity. It provided a clear and solid point of departure from which policy-makers can base their decisions. An electricity grid map from the municipality concerning high-and medium-voltage cables and transformers was used to calculate the maximum capacity the grid can receive in terms of embedded generation in the researched residential areas. A program from Zimele Technology, which provides hourly updates of municipal electricity output from substations, was used to plot a profile of the electricity output for Stellenbosch Municipality. The NRS 097-2-series standard recommends using a maximum of 15% of the medium-voltage electricity grid cable capacity and a maximum of 25% of the transformers' capacity (also named mini-substations or LV feeders) to calculate the maximum amount of embedded generation that can be channelled to the grid. Calculations were made for both the medium-voltage cables and the transformers located in the identified areas.
The second approach focused on the financial criteria according to which households decide to install rooftop PV. Only households in high electricity consumption areas that can get the maximum benefit from an investment in self-generation were considered. The maximum benefit was determined by examining the electricity usage profile of individual households in those areas. Only the households that would not fall below a usage of 600 kWh after installing rooftop PV were taken into account. The 600 kWh was used as the threshold, as households paid more per kWh when more than 600 kWh was consumed (see Table 2), thereby gaining the maximum financial benefit of installed PV systems.
The high electricity consumption suburbs in Stellenbosch were examined in both approaches, as these are regarded as the areas in which it makes most financial sense to invest in distributed generation. A PV solar data tool was used to receive accurate data about the solar penetration for every day of the 2013/2014 municipal financial year. The solar data used in the hind-cast model to predict the PV plant production output was sourced from SoDa solar radiation data. This data was in turn supplied by SoDa from the HelioClim database that combines measurements from ground stations and satellite data, as well as provides hourly global horizontal irradiance data used in the PVsyst software for detailed modelling. The municipal financial year was chosen instead of the calendar year, in order to be consistent with Eskom and municipal electricity tariffs, which are set for the financial year. The most representative day of each month in terms of solar penetration was selected to determine the solar penetration in Stellenbosch. It was determined per substation what part of electricity consumption will be replaced by rooftop solar electricity generation. A simulation approach was used to model possible future extreme case scenarios, based on the maximum grid capacity for embedded generation, and based on the solar penetration in the specific identified high electricity use suburbs. The solar penetration was based on recorded data from a 1.68 MWp solar PV system that has tracked the exact solar penetration on every day of the year between July 2013 and June 2014.
Questions arose on the electricity usage trend in Stellenbosch over the past five years, on the percentage of the electricity revenue that come from the residential sector, on the total revenue from electricity in comparison with other income sources and on the difference between the revenue generated and the expenditure on electricity to find out the exact surplus. It is this surplus, not the revenue, which supplements the municipal coffer and can be used for cross-subsidisation.
4. Case study: Stellenbosch Municipality
The municipality buys electricity in bulk from Eskom, receiving it via high-voltage 66 kV electricity lines to its main substations in Cloetesville, Stellenbosch, and Franschhoek. The municipality, from there, is responsible for distribution within its licensed area of supply, as regulated by the National Energy Regulator. The electricity is distributed via medium-voltage (11 kV) cables to transformers in neighbourhoods where it gets converted into low voltage for supply to households. The total notified maximum demand (NMD) that was allocated to the municipality by Eskom is 80 MW, aggregated by 55, 16 and 9 MW for the Stellenbosch, Cloetesville and Franschhoek substations, respectively. The demand for electricity in Stellenbosch as a whole is currently close to Eskom's NMD allocation. This limits further connections and hampers electricity allocation to proposed economic developments. Figure 2 shows the electricity revenue by source in the financial year 2011/2012. This financial year was used because it is the latest actual data that was available from Stellenbosch Municipality. The following years were budgeted in the data source, but were not assessed as actual data. The main income source amongst service delivery and property rates revenue is electricity, with 31% of the total income, according to Figure 2. It therefore makes a large contribution to the municipal finances and, as a result, officials and especially in the finance department would endeavour to keep this income source.
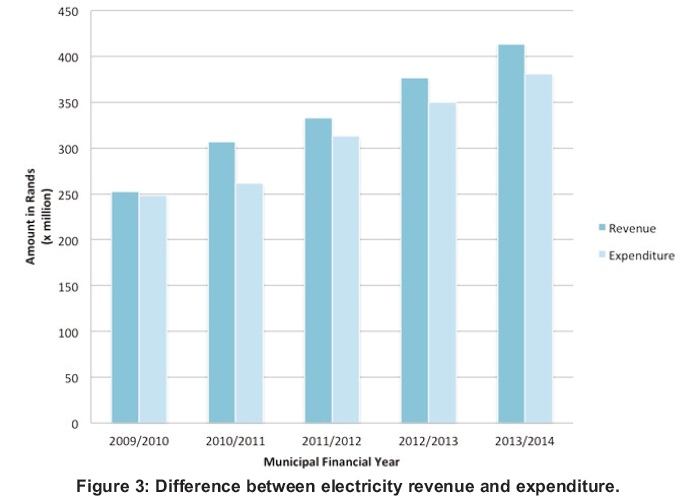
The difference between revenue from electricity and the expenditure on electricity infrastructure and services, as shown in Figure 3, was, however, found to be negligible, which might lessen the validity of the common argument taken by municipalities that rooftop solar PV threatens the electricity revenue. In the financial year 2009/2010 there was almost no difference between the two, indicating that the actual surplus on electricity was extremely low. The 2010/2011 financial year showed a larger surplus. It was this surplus that could be used for cross-subsidisation that is threatened. There could, however, also be a possibility (as when considering the 2009/2010 financial year, for example) that the revenue would diminish so significantly as a result of rooftop PV that it would result in losses. The expenditure in that year could exceed the revenue if large amounts of households had invested in rooftop PV. Moreover, expenditure on grid maintanance could increase when more PV was connected.
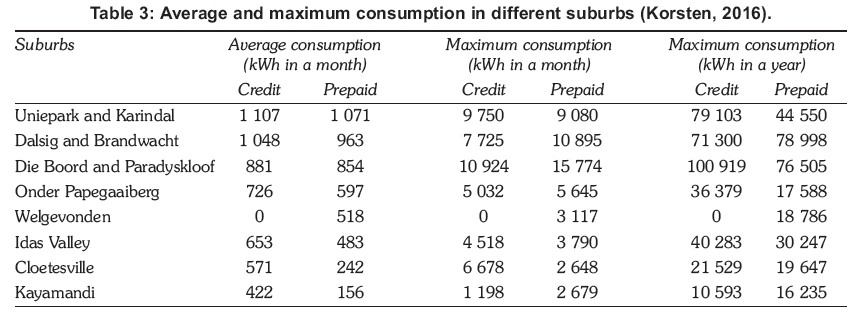
Wealthier residents, in particular for Stellen-bosch, consumed more electricity and it is also this group that is financially better equipped to invest in rooftop solar PV to reduce their consumption. Table 3 shows that, on average, the first five suburbs (high-income) in the table consumed more electricity than the last three suburbs, consisting of mixed and low-income households. The side effect of this could be that, if prices of municipal electricity increased because of rooftop PV installations, the lower-income households would be faced with a higher financial burden.
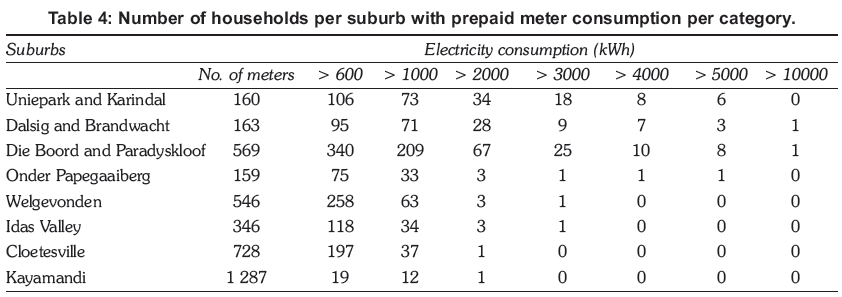
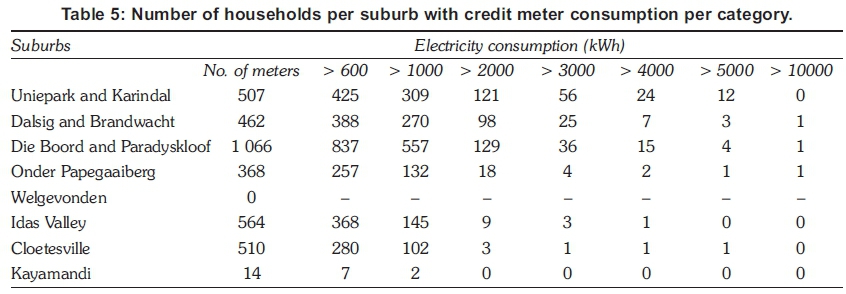
The averages, maximums and medians do not, however, provide as much information per suburb to determine how many households consume electricity above a certain number of kWh. Tables 4 and 5 show the number of households that consumed electricity in the categories above 600 kWh per month for prepaid and credit meters. The first category is determined as >600 kWh per month, as from this amount of consumption electricity is most expensive. The number of meters per suburb used as the research group is given in the second column. For the prepaid meters, half to two-thirds of the households fall into >600 kWh electricity consumption or above. Only 19 out of 1 287 households with a prepaid meter in the low-consuming areas such as Kayamandi, in contrast, consumed more than 600 kWh per month. For Cloetesville, this figure is around a quarter, or 197 out of the 728 consumers. Idas Valley, however, was very similar to Onder Papegaaiberg, but in percentage terms there were fewer households consuming in the >1 000 kWh per month category in this area. The number of households in the high-use categories was significantly higher for credit meters than for prepaid meters, across all suburbs. The credit meter table substantiates the fact that more households in the high-consuming suburbs also fell into higher-consuming categories. It is noted that, although Idas Valley, Cloetesville and Kayamandi have fewer households consuming in high categories, this does not mean there were no households able to invest in embedded generation. Only the top five consuming suburbs were analysed in this investigation, nevertheless.
5. Impact of rooftop solar PV on Stellenbosch Municipality
5.1 Grid capacity for distributed generation
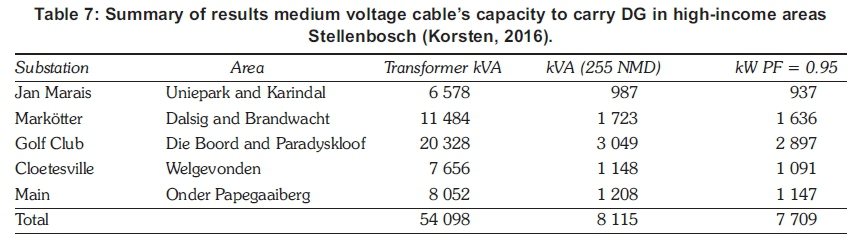
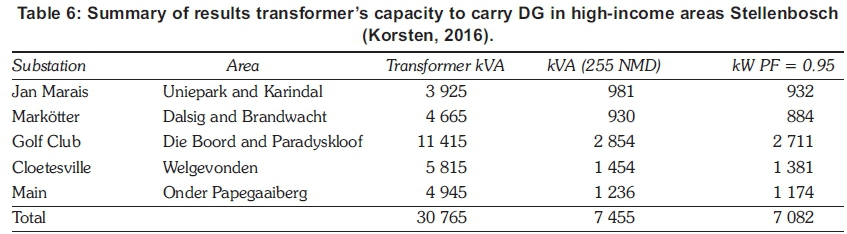
Tables 6 and 7 show the calculated values of the maximum per area for the transformers and the medium-voltage cables. The results show the maximum embedded generation in kW by suburb that households in the five different high-income areas can feed back to the grid, as can be accommodated by transformers and medium-voltage cables respectively. The maximum capacity of the mini-substations or transformers in the areas is calculated as 7 082 kW. The maximum capacity of the medium voltage cables is approximately 7 709 kW. In the entire town of Stellenbosch this means that the maximum from embedded generation would be 7.7 MW. It is taken into account that this result is used as a point of departure, without having done an extensive grid study. The policy uses a safer approach than the grid potentially could take; in reality the grid could possibly receive more without creating strains on it. It is noted that even if the maximum of 7.7 MW were fully utilised for embedded generation, this still remains less than 10% of the 80 MW maximum NMD allocated by Eskom to the municipality. The lowest value means that, if the transformers have a lower capacity than the medium-voltage cables, the point of departure should be the transformers. An example is for Welgevonden. As Table 7 indicates, the capacity that the medium voltage cables can carry is around 1 148 kW. Looking at the transformers in that area would mean the maximum capacity is approximately 1 454 kW. The safest point of departure would in this case be to take the lowest maximum, which is the maximum carrying capacity of the medium voltage cables.
Using the limiting value for maximum capacity in each suburb, it was calculated that the maximum capacity for embedded generation is 6 765 kW. If all households considering rooftop PV were to install a 3 kWp system, this would equate to 2 255 rooftop PV systems. In other words, when looking from a grid capacity point of view, 2 255 households in the high electricity use suburbs would theoretically be able to put up a 3 kWp rooftop system. This maximum number of households that can put up rooftop PV is later compared to the households that would (potentially) invest in rooftop PV according to certain criteria.
5.2 Load profile impact
This section provides the findings on what part of the electricity load profile would be taken up by distributed generation, indicated as an averaged kW value over an hour. The grid capacity results from the previous section are used as a basis for the results. Figure 4 shows the impact of rooftop solar PV from the residential suburb Welgevonden, on a typical winter day in August 2013. The black line represents the total energy demand for Thursday 22 August 2013. The yellow coloured field represents the electricity that will be substituted by grid connected embedded generated electricity in an extreme case scenario from the residential sector. The grey field represents the remaining load after solar electricity production.
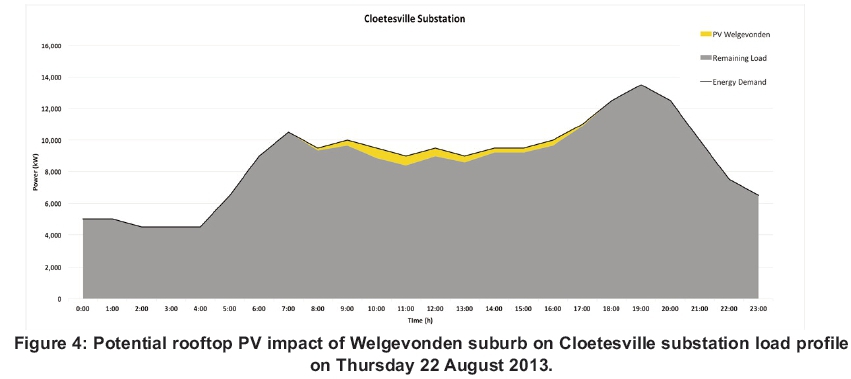
Figure 5 shows the impact from rooftop solar PV in the residential suburbs Uniepark and Karindal, Dalsig and Brandwacht, Paradyskloof and Die Boord, and Onder Papegaaiberg, marked with different colours, for Tuesday 14 January 2014 - a typical summer weekday.
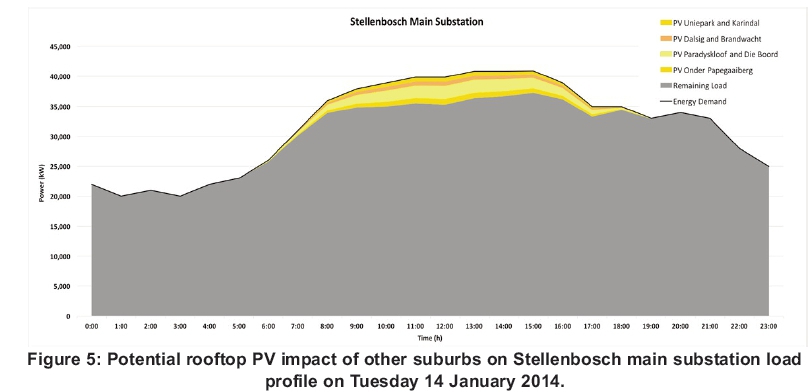
The PV electricity is produced during the day when electricity is relatively cheap for the municipality to buy from Eskom, so the margin during these hours is higher for the municipality than during peak hours. If the generated electricity could be stored sustainably, and consumed during peak hours, it would be more financially beneficial for the municipality, especially in winter periods when electricity is more expensive during peak hours.
5.3 Financial impact
Table 8 shows the outcomes of the calculations to determine how much the municipality would save when people start investing in solar PV. The savings are calculated as what the municipality does not need to pay to Eskom because of the reduction in electricity demand. The calculations are based on the maximum grid capacity for embedded generation and the maximum solar penetration in Stellenbosch. This is split as a proportion over the week, Saturday and Sunday, during peak, off-peak and standard hours. The total embedded generation produced was determined as 11 144 917 kWh. The proportions of the electricity generated during the time-of-use are multiplied with the tariff charged by Eskom to the municipality. This leads to a total of R 5 465 182 saving for the municipality if 2 255 households installed a 3 kWp solar PV system.
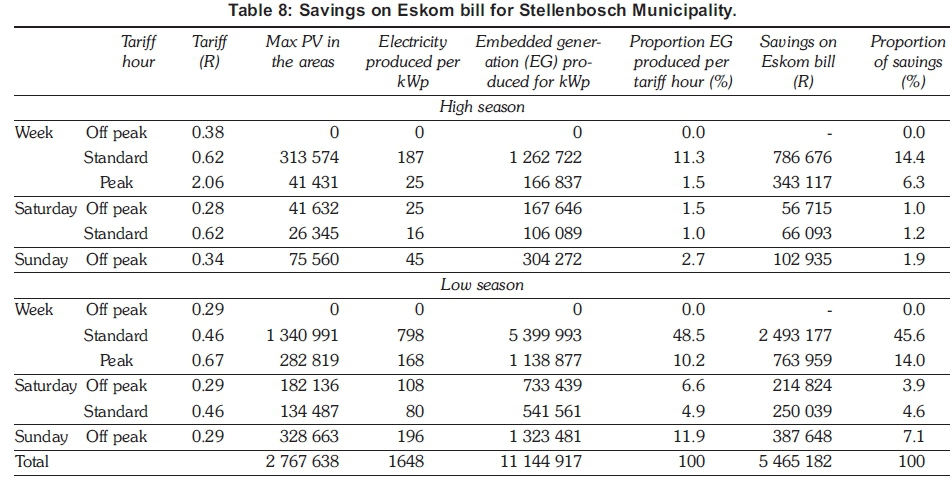
Table 8 shows that almost 60% of the total electricity from embedded generation is produced during the week in standard hours, when electricity is bought at relatively cheaper prices. During the peak hours, 11.7% of the electricity is produced by embedded generation. In addition, the saving in proportion to the standard hours is 60%. The saving during peak hours as part of the total is higher than the electricity generated because of the influence of a higher tariff. The saving during peak hours is 20.3%.
As indicated before, households in high electricity consumption areas that can get the maximum benefit from an investment in self-generation were further considered. Only those households where usage does not fall below 600 kWh after installing rooftop PV were taken into account. The total number of such households, which are therefore deemed able to (potentially) invest in rooftop PV, is 541 (see Table 9). This is a quarter of the 2 255 households that could potentially connect to the grid with a 3 kWp system.
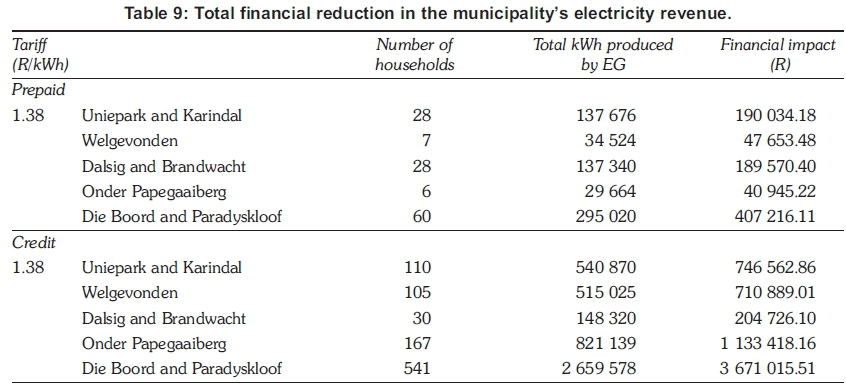
Table 9 shows the total kWh produced by embedded generation by suburb. The total kWh multiplied by the applicable tariff of R1.38 per kWh provides the financial impact. The R1.38 is the amount per unit in block 4 of the BIT system for 2013/2014 for the municipality. When adding all the amounts per suburbs, the total financial impact would be a R3 671 016 reduction in municipal revenue.
6. Results and conclusions
This paper investigates the potential revenue reduction of households in high-consumption areas of Stellenbosch Municipality fully exploiting the maximum capacity of the electricity grid to incorporate rooftop solar PV. The financial impact, in terms of considering only the households that can exploit the maximum financial benefit from such an investment, was further analysed.
Firstly, the maximum capacity of the grid to accommodate embedded electricity was calculated using the NRS standard. This suggested that if households were to invest in a 3 kWp rooftop solar PV system, a maximum of 2 255 households could potentially connect to the grid. Taking into account the load profile for solar PV generation and electricity tariffs, this would result in a reduction of municipal electricity revenue by R15 301 555. It would also result in a municipal expenditure saving of R5 465 182 for electricity from Eskom. The net loss on the electricity for the municipality would thus be R9 836 373 per annum. This represents a percentage loss of 2.4% of the total municipal electricity revenue of R413 698 000 in the 2013/2014 financial year.
Secondly, the scope of study was reduced to the 541 households that would not fall below a monthly usage of 600 kWh of electricity after installing rooftop PV, and that are therefore more likely to invest in rooftop PV. This scenario would result in a financial reduction on the electricity revenue of R3 671 016. The savings on the municipality's annual bill for the procurement of electricity from Eskom as a result of fewer electricity sales would be R1 318 429. This would lead to a net loss of R2 352 587, or a 0.6% loss on the total revenue on electricity for the 2013/2014 municipal financial year.
If the municipality would consider a charge for distributed generation owners to cover the net loss of R9 836 373, the fixed monthly charge for the 2 255 households would be R363.50 per month. An approximate similar amount is calculated to cover a net loss of R2 352 587, namely a R362.40 monthly charge for the 541 households. However, fixed charges can be very counter-productive and represent a real disincentive for households to invest in solar PV installations.
It is encouraging that in 2016 Stellenbosch Municipality released a new policy for embedded generation, with a tariff structure that indicates a fixed monthly charge of R140.00, and a buy-back option of 10% below the Eskom rate. The fixed monthly charge for embedded generation users is on top of the regular fixed monthly charge of R142.09 for pre-paid meter consumers, and R255.18 for credit meter consumers, when using more than 500kWh electricity per month. The potential influence of such a policy on household behaviour is the subject of further research. However, a better approach for the Municipality would be to allow for a small increase in rates and taxes in higher income areas to absorb the potential losses, which would incentivise a sustainable energy transition. This is also the basis for further research.
References
Association of African Planning Schools (AAPS). 2010. Case research toolkit: Guidelines for case study research and teaching. Available online at: http://www.africanplanningschools.org.za/images/sto-ries/aaps/aaps_cr_toolkit.pdf (accessed 8 August 2014). [ Links ]
Ahlfeldt, C. 2013. The localisation potential of photo- voltaics ( PV) and a strategy to support large scale roll-out in South Africa. Integrated report for SAPVIA, WWF and the DTI, available online at: http://www.sapvia.co.za/wp-content/uploads/2013/04/PV-Localisation_Draft-Final-Report-v1.2.pdf (accessed 7 February 2017). [ Links ]
Burger, C. and Weinmann, J. 2014. Germany's decen tralised energy revolution. In: FP Sioshansi (ed). Distributed generation and its implications for the utility industry. Elsevier, Amsterdam: 49-73. [ Links ]
Cai, D.W.H., Adlakha, S., Low, S.H., De Martini, P and Mani Chandy, K. 2013. Impact of residential PV adoption on retail electricity rates. Energy Policy 62: 830-843. [ Links ]
Carter, S. 2001. Breaking the consumption habit. The Electricity Journal 14(10): 66-74. [ Links ]
Costello, K.W. and Hemphill, R.C. 2014. Electric utilities' 'death spiral': Hyperbole or reality? The Electricity Journal 27(10): 7-26. [ Links ]
Duthu, R.C. and Bradley, T.H. 2015. An evaluation of customer-optimized distributed generation in New England utility and real-time markets. The Electricity Journal 28(3): 70-85. [ Links ]
Eid, C., Guillén, J. R., Marín, P F and Hakvoort, R. 2014. The economic effect of electricity net-metering with solar PV: Consequences for network cost recov ery, cross subsidies and policy objectives. Energy Policy 75: 244-254. [ Links ]
Felder, FA. and Athawale, R. 2014. The life and death of the utility death spiral. The Electricity Journal 27(6): 9-16. [ Links ]
Hedman, B. 2014. Death spirals and other things that go bump in the night. Available online at: http://www.cadmusgroup.com/articles/2014-year-review-death-spirals-things-go-bump-night/ (accessed 26 September 2015). [ Links ]
Kirsch, L.D. and Morey, M.J. 2015. Pricing retail electricity in a distributed energy resources world. The Electricity Journal 28(3): 112-121. [ Links ]
Mountain, B. and Szuster, P 2014. Australia's million solar roofs: Disruption on the fringes or the beginning of a new order? In: FP Sioshansi (ed). Distributed generation and its implications for the utility industry. Elsevier, Amsterdam: 75-96. [ Links ]
Nillesen, P, Pollitt, M. and Witteler, E. 2014. New utility business model: A global view. In: F.P. Sioshansi (ed). Distributed generation and its implications for the utility industry. Elsevier, Amsterdam: 33-47. [ Links ]
National Renewable Energy Laboratory (NREL). 2009. Decoupling policies: Options to encourage energy efficiency policies for utilities. Available online at: https://energy.gov/eere/downloads/decoupling-policies-options-encourage-energy-efficiency-policies-utilities-clean (accessed 7 February 2017). [ Links ]
Parkinson, G. 2014. Utilities move to kick rooftop solar off the grid : Renew economy. Available online at: http://reneweconomy.com.au/2014/utilities-move-to-kick-rooftop-solar-off-the-grid-15250 (accessed 26 September 2015). [ Links ]
REN21. 2015. Renewables 2015 global status report. Available online at: http://www.ren21.net/status-of-renewables/global-status-report/ (accessed 7 February 2017). [ Links ]
Richter, M. 2012. Utilities' business models for renewable energy: A review. Renewable and Sustainable Energy Reviews 16(5): 2483-2493. [ Links ]
Sebitosi, A.B. 2010. Is the South African electricity tariff model conducive to an energy efficient economy? Energy for Sustainable Development, 14(4): 315319. [ Links ]
Sioshansi, F 2014. The rise of decentralised energy. In: FP Sioshansi (ed). Distributed generation and its implications for the utility industry. Elsevier, Amsterdam: 3-32. [ Links ]
Stellenbosch Municipality. 2013. Tariff policy 2013/2014. Stellenbosch, South Africa. [ Links ]
Swilling, M. and de Wit, M. 2010. Municipal finance, service delivery and prospects for sustainable resource use in Cape Town. In: M. Swilling (ed). Sustaining Cape Town: Imagining a livable city. Sun Press, Stellenbosch: 23-40. [ Links ]
Walwyn, D.R. and Brent, A.C. 2015. Renewable energy gathers steam in South Africa. Renewable and Sustainable Energy Reviews 41: 390-401. [ Links ]
* Corresponding author: Tel: +27 21 808 9530; email: acb@sun.ac.za

