


Services on Demand
Article
 English (pdf)
 Article in xml format
 Article references
Indicators

Related links
-
 Cited by Google
 -
 Similars in Google
Share

 Permalink
Journal of Energy in Southern Africa
On-line version ISSN 2413-3051
Print version ISSN 1021-447X
J. energy South. Afr. vol.28 n.2 Cape Town May. 2017
http://dx.doi.org/10.17159/2413-3051/2017/v28i2a1754
ARTICLES
Potential for domestic biogas as household energy supply in South Africa
Sunset S. Msibi; Gerrit Kornelius*
University of Pretoria, Department of Chemical Engineering, Environmental Engineering Group, Private Bag X20, Hatfield 0028, South Africa
ABSTRACT
Biogas is a clean and renewable form of energy accessible to low-income households through anaerobic digestion of readily available organic waste. The objectives of this desktop study were to investigate the feasibility of biogas use for substitution of presently used solid fuels in rural and peri-urban households, the subsequent health co-benefits, and the constraints to adoption of domestic biogas technology in South Africa. The energy demand of low-income South African households for cooking with fuelwood was found to be 27 MJ/day and the total energy demand 68 MJ/day. This is equivalent to 2 500 L/day/household of biogas for cooking and 6 250 L/day/household of biogas for complete substitution of conventional domestic fuels. Complete substitution of fuelwood used for cooking and household fuelwood use with biogas can result in the avoidance of 43% and 85.4% respectively of total disability adjusted life-years lost (702 790) and mortalities (22 365) from indoor smoke as a consequence of solid fuel use. Approximately 625 000 households in South Africa can potentially benefit from bio-digester fed with cattle and pig waste, on the basis of livestock numbers. It is infeasible to operate a domestic bio-digester fed solely with human waste, chicken waste and food waste because of insufficient feedstock. Non-sewerec households with access to on- and off-site wate supply generate sufficient greywater for feeding a domestic bio-digester for cooking purposes. This is therefore, recommended over the use of drinking water.
Keywords: domestic biogas technology, anaerobk digestion, organic waste, indoor air pollution, bio digester feedstock
1. Introduction
Energy overview in Africa
Africa is a net energy exporter, but the majority of its population lacks access to clean energy, and many African countries rely on imported energy (Amigun et al., 2012). Biomass, mainly in the form of fuelwood and charcoal, is the dominant energy source used in sub-Saharan Africa (SSA) and accounts for approximately 74% of total energy consumption there, compared with 37% in Asia and 25% in Latin America. Half a billion of people living in SSA do not have access to electricity in their homes and rely on solid fuels (fuelwood, agricultural/crop residues and animal wastes) to meet basic energy needs for cooking, heating and lighting. The disadvantages of these traditional fuels are many: (i) they are inefficient energy carriers and the heat release rate is difficult to control; (ii) they release harmful gases; and (iii) the current rate of extraction is unsustainable (Parawira, 2009).
Energy utilisation in South African households
In South Africa, 15% of households did not have access to electricity in 2014 (World Bank, 2017) and used fuelwood as the main energy source. Approximately 54%, 46% and 29% households without access to electricity rely on fuelwood as the main energy source for cooking, water heating and space heating, respectively (Department of Energy, 2013). In the South African context, fuelwood can be considered the major solid fuel of concern for substitution with biogas. The proportion of South African households that rely on coal as the main source of energy for cooking and space-heating declined from 3% to 0.8% and 5% to 1.8%, respectively, from 2002 to 2012. Mpumalanga province remains the main user of coal, with 5.7% and 10.5% of households still relying on it for cooking and space-heating respectively (Statistics SA, 2013b).
Biogas as a renewable energy source
Biogas energy is currently employed in the developing world, especially Asia to meet energy demand by low-income households and combat the environmental and health effects of solid fuel use (SFU) (Gautam, Baral & Herat, 2009). It is produced through anaerobic digestion (AD) of organic waste (i.e. kitchen, animal and human waste), making the technology ideal for developing countries that lack waste handling and sanitation facilities. South Africa, unlike its Asian counterparts, is amongst the African countries that have seen limited growth in terms of domestic bio-digester installations, which Bond and Templeton (2011) attribute to limited research.
Problem statement
Although there has been extensive academic research into the status, prospects and constraints of domestic biogas technology in the developing world (Van Nes & Nhete, 2007; Gautam et al., 2009; Greben & Oelofse, 2009; Parawira, 2009; Bond & Templeton, 2011; Amigun et al., 2012; Ghimire, 2013; Pérez et al., 2014; Surendra et al., 2014), scant research is available in the South African context. Hennekens (2012) conducted a study aimed at gaining a sociological understanding of the potential of biogas practices to address the problem of domestic energy in low-income households, in rural and peri-urban areas in South Africa. A study was also conducted by Austin and Blignaut (2008), as cited in Smith et al. (2013), which highlighted some of the social, economic and environmental benefits associated with implementation of a rural bio-digester programme in South Africa. The objectives of this desktop study were to investigate the feasibility of biogas use for substitution of presently used solid fuels in rural and peri-urban households, the consequent health co-benefits and the constraints to adoption of domestic biogas technology in South Africa.
Methods
The primary research method used is to calculate the required parameters based on values obtained from a literature study. The literature study was also used to identify the gaps and opportunities in terms of biogas technology adoption and dissemination in South Africa, thereby formulating the research questions to address those gaps.
2. Literature review
2.1 Energy demand in low-income South African households
Low-income households without access to electricity in rural areas of KwaZulu-Natal, Eastern Cape and Limpopo and peri-urban/informal settlements of Gauteng rely on biomass (predominantly fuel-wood) as a main source of energy for cooking, space-heating and water-heating (Department of Energy, 2013). These households are in the lowest income brackets, ranging from R0-9 600 per annum. Based on total annual fuelwood consumption, the average annual household fuelwood consumption for these households in South Africa is «12 kg/day/household. (Damm & Triebel, 2008).
2.2 Energy efficiencies of domestic fuels
In the rural areas of developing countries, traditional/conventional cook-stoves, three-stone fires or open fires are still prevalent. As in other African countries, the uptake of more efficient wood-burning appliances has been limited in South Africa (SALGA 2014). As shown in Table 1, several studies have been conducted to determine the fuelwood efficiency of various cooking methods, including three-stone fires, using a water-boiling test, which is a simplified simulation of a cooking process. Table 1 shows the reported fuelwood thermal efficiencies for open fires measured using this test.
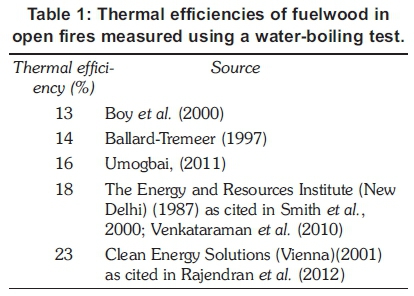
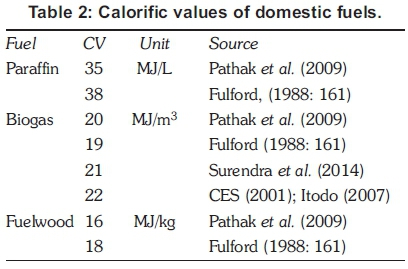
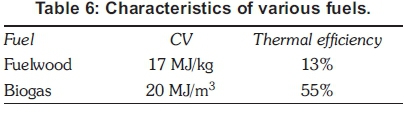
One of the limitations of the water-boiling test is that, as a controlled test it may not be representative of actual cooking conditions and the figure for thermal efficiency obtained may overestimate actual thermal efficiency. The lowest thermal efficiency (13%) from Table 1 is, therefore, used in this study. Thermal efficiency for the biogas stoves varies between 50% and 60% (Clean Energy Solutions (Vienna), 2001as cited in Rajendran et al., 2012; Itodo et al., 2007; Resources Centre for Sustainable Development (Assam), 2008; Fulford, 1988). Khadi and Village Industries Commission and Bureau of Indian Standards recommend that the efficiency of domestic biogas burners should be >55% (Smith et al., 2000). A biogas efficiency of 55% reported in Smith et al. (2000) is therefore used in the present study. Biogas can also be used for lighting with bio-gas lamps with an efficiency of 3-5% (Thom, 1994; Everson & Smith, 2015; Al Seadi, 2008; Smith & Everson, 2016). Household energy demand is also dependent on the heating or the calorific value (CV) of fuel used. Table 2 shows the reported CVs of various domestic fuels. The CVs of 17 MJ/kg and 20 MJ/m3 for fuelwood and biogas respectively are used.
2.3 Economic value of fuelwood
The net direct-use value of fuelwood is approximately R1 250 per household per year, where net direct-use value is the gross market value of fuel-wood (R1 970) less the opportunity costs associated with collecting fuelwood (R720) (Damm & Triebel 2008). Census 2001 showed that 2.3-2.8 million households rely on fuelwood, which translates to a total gross national net direct-use value of fuelwood at about R3-R3.5 billion/annum in 2008 values (Damm & Triebel, 2008).
2.4 Burden of disease attributed to indoor smoke from fuelwood use
Various studies have shown reasonably consistent and strong relationships between the indoor use of solid fuels and a number of diseases (WHO, 2002). They estimate that indoor smoke from solid fuels causes about 35.7% of acute lower respiratory infections, 22.0% of chronic obstructive pulmonary disease and 1.5% of trachea, bronchus and lung cancer. Indoor air pollution (IAP) may also be associated with tuberculosis, cataracts and asthma. Various estimators of the health impact of air pollution were employed in recent health impact assessments. The estimator used in the present study is the disability adjusted life-years (DALY). The DALY combines the health impacts of air pollution on morbidity and mortality, where 1 DALY = loss of one healthy life year (WHO, 2002). Estimated DALYs lost and mortalities in South Africa due to IAP from SFU in 2001 are 822 940 and 26 189, respectively (WHO, 2002). According to Statistics SA (2013b), SFU for cooking in South African households in 2002 comprised 1.3%, 13.3% and 85.4% of, respectively, animal dung, coal and fuel-wood. The inference from this is that complete substitution of household fuelwood use with biogas will result in 85.4% reduction in DALYs lost and mortalities because of IAP from SFU.
2.5 Domestic biogas production
Biogas consists of 50-70% methane, 30-40% carbon dioxide and traces of other gases such as hydrogen sulphide, ammonia and hydrogen produced by AD of biological matter (Surendra et al., 2014). Various biological matters (substrates) can be used as feedstock in a domestic bio-digester, such as animal waste, human excreta and kitchen/food waste, because of their availability at household level.
2.6 Biogas digester technology
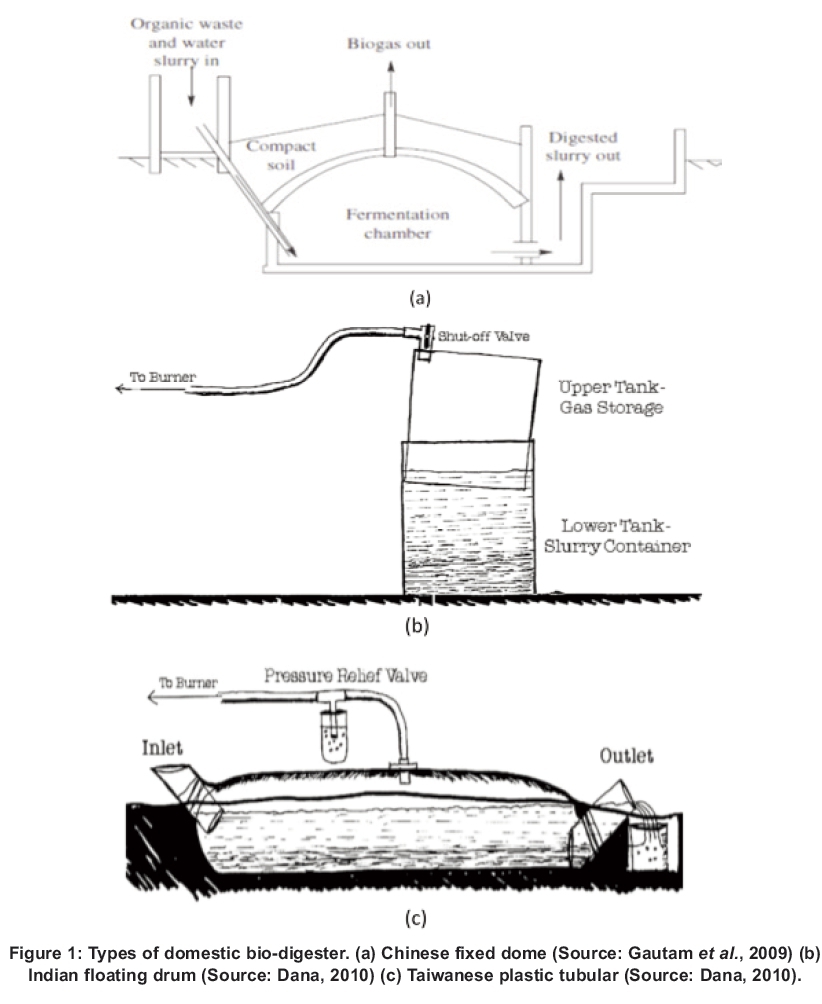
Three types of domestic bio-digester (see Figure 1) are popular in developing countries, namely, Chinese fixed dome, Indian floating drum and Taiwanese plastic tubular. They are small (5-10 m3) and mostly used to meet household energy demand for cooking and lighting. Taiwanese plastic tubular digesters are the least expensive design but are susceptible to mechanical damage and have a short operational life of only 2-10 years (Pérez et al., 2014). The Chinese fixed dome digester is often the design of choice because of its reliability, low maintenance requirements and long lifetime (Parawira, 2009). About 1 500-2 400 L/day of biogas is considered sufficient to supply cooking requirements for a family of five (Bond and Templeton, 2011).
2.7 Characteristics of feedstocks
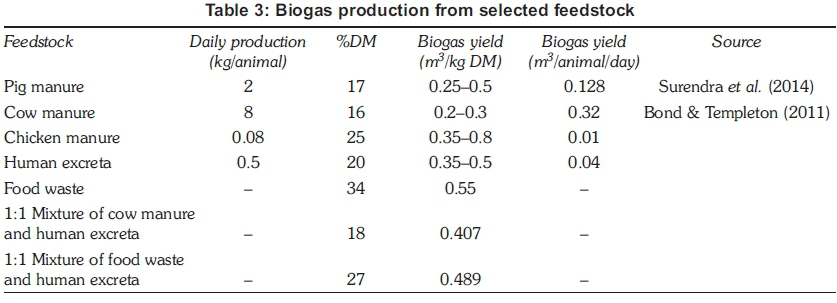
In general, all types of biomass can be used as feedstock as long as they contain carbohydrates, proteins, fats, cellulose, and hemicellulose as main components (Bond & Templeton, 2011). However, the biodegradability of the feedstock depends on its physical and chemical form (Fulford, 1988). Typical feedstocks used for biogas production are animal waste, human excreta/sewage, kitchen/food waste and co-digestion of multiple feedstocks. Table 3 shows typical biogas production potential of the abovementioned feedstock used for domestic bio-digesters.
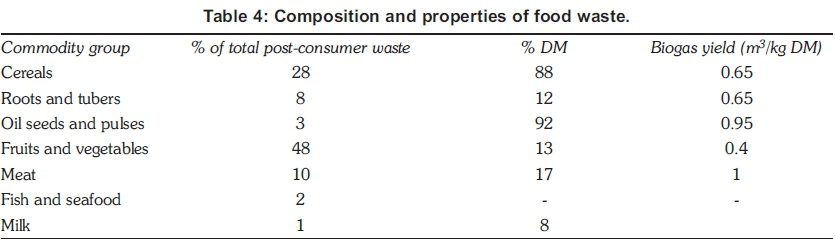
The composition of food waste at post-consumer stage is shown in Table 4. The percentage DM and biogas yield per commodity was obtained from Deublein and Steinhauser (2008). Equations 1 and 2 were used to calculate the percentage DM and biogas yield for a composite feedstock or a mixture of different feedstocks.
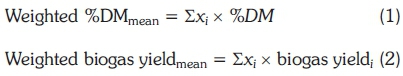
where xi, = % composition of food waste as shown in Table 4.
2.8 Biogas as a renewable energy source in the developing world
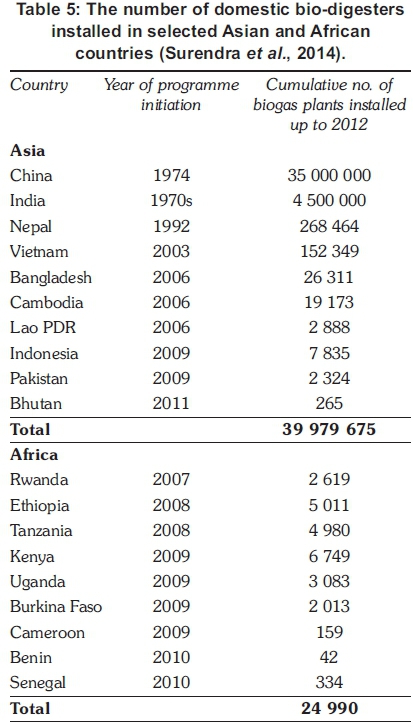
The number of domestic bio-digesters installed in selected developing countries and the year of bio-gas programme implementation are listed in Table 5. In South American countries such as Argentina, Peru, Brazil, Chile and Mexico, the implementation of domestic bio-digesters is just starting (Deublein & Steinhauser, 2008). From 2006 to 2011 only a few digesters (predominantly the plastic tubular type) were implemented in rural Peruvian communities by means of pilot research and development cooperation projects (Ferrer et al., 2011). In South Africa, 38 biogas production operations (predominantly of fixed dome type) are registered by National Energy Regulator of South Africa, according to the requirement of the Gas Act of 2001 (De Bruyn, 2013).
2.9 Challenges for the dissemination of domestic biogas technology
Developing countries encountered the following challenges in the biogas sector, constraining the dissemination of domestic bio-digesters:
(i) Lack of a renewable energy policy: An existing renewable energy policy can assist in breaking the barriers for the wide-scale dissemination of biogas technology. Policy should guide the stakeholders and suppliers to maintain quality of product and services.
(ii) Climate too cold or too dry: Areas where the temperature sometimes goes below 10 °C (such as the hilly areas of Nepal and the Peruvian Andes) are not suitable for biogas production unless the digester is protected against temperature variations (Gautam et al., 2009).
(iii) Limited private sector participation: The private sector has a key role in promoting renewable energy and making the biogas sector commercially sustainable and market oriented. The national policy should be developed in such a way that it attracts more private companies to participate in the biogas sector (Ghimire, 2013).
(iv) Low income of the target group: One of the major barriers for the widespread dissemination of domestic biogas technology is the high installation, operating and maintenance (IOM) costs, which puts it out of financial reach of many rural households (Surendra et al., 2014).
(v) Lack of technical knowledge: Lack of knowledge about the construction, operation and maintenance of biogas systems is often cited as a reason for non-adoption of biogas in some countries in Africa. Poor IOM capacity of the users has led to poor performance and even abandonment of bio-digesters (Amigun et al., 2012).
(vi) Limited water availability: The site-specific issues that have limited the scope of biogas technology in sub-Saharan Africa include the availability of water and organic materials for effective bio-digester operation. Bio-digesters typically require water and waste to be mixed in an equal ratio (Surendra et al., 2014). Mengjie (2002) and Ng'wandu et al. (2009) have recommended the use of greywater for feeding a domestic bio-digester, but excluding greywater contaminated with detergents or chemical cleaning products to avoid destroying microbial activity in the bio-digester. In South Africa, greywater generated per household is approximately 75% of the household water consumption (Carden et al., 2007).
2.9 Benefits of biogas technology
Beyond supplying free, clean and renewable energy accessible at household level in developing countries, biogas technology offers the following benefits.
(i) Biogas improves health of rural low-income households by providing a cleaner cooking fuel and a waste handling solution thus avoiding health problems (Amigun et al., 2012).
(ii) Bio-slurry/digestate when used as a fertiliser enhances physical, chemical, and biological attributes of the soil and increases crop productivity when applied to the land Surendra et al., 2014).
(iii) Economic benefits from bio-digester installations include job creation in the biogas sector, funds that can be made through carbon credits and reduced costs from imported chemical fer tilisers and fossil fuels (Gautam et al., 2009).
(iv) Social development due to the reduced workload from women and children associated with collecting fuelwood or cow dung and also the availability of clean household energy (Garfí et al., 2012).
(v) Reduction in greenhouse gas (GHG) emissions by displacing the burning of fuelwood and paraffin in inefficient cook stoves with biogas (Dioha et al., 2012). Biogas technology could potentially reduce global anthropogenic methane emissions by around 4% (Bond and Templeton, 2011).
(vi) Reduction in deforestation associated with the dependency of rural areas on fuelwood as the main source of energy. Global deforestation is responsible for 17-25% of all anthropogenic GHG emissions and a contributor to soil erosion resulting in vulnerability to the effects of droughts and floods (Surendra et al., 2014).
2.10 Renewable energy policy in South Africa: The biogas technology context
In the White Paper on Renewable Energy (2003), the government set a medium-term (10-year) target of 10 000 GWh renewable energy contribution to final energy consumption by 2013 (i.e. 1 000 GWh/year), to be produced mainly from biomass, wind, solar and small-scale hydro. The renewable energy is to be utilised for power generation and non-electric technologies such as solar water-heating and bio-fuels. The potential exists to utilise waste from livestock (cattle, pig and poultry) to produce biogas. The potential energy from livestock waste is approximately 5 600 GWh/year (Department of Minerals and Energy, 2003).
2.11 Research gaps
The following gaps were addressed in the literature review:
(i) The availability of animal or livestock waste for feeding domestic bio-digesters.
The following gaps are addressed in this study:
(i) The availability of other types of organic wastes such as kitchen and human waste for feeding bio-digesters.
(ii) The energy demand by an average sized low- income household in South Africa and equivalent biogas requirement to meet that demand.
(iii) The reduction in the burden of diseases and mortalities due to substitution of conventional domestic fuels with biogas.
(iv) The number of households that can potentially benefit from domestic bio-digester installations.
(v) The availability of water at household level to feed simultaneously with feedstock.
3. Methodology
3.1 Research design
The energy demand by an average sized low-income South African household was calculated using Equation 3:

where Q is the household energy demand in MJ/ day, m is the fuel demand in kg/day or L/day, CV is the calorific value of fuel in MJ/kg or MJ/m3, and n is the fuel thermal efficiency (see Table 6).
Biogas requirement was calculated using Equation 4 for the following conditions:
(i) Substitution of fuelwood used for cooking.
(ii) Complete substitution of household fuelwood use.
(iii) Complete substitution of conventional domestic fuels including paraffin used for lighting.
Fuelwood savings from domestic bio-digester installations were calculated and compared against the findings from literature. The income savings incurred by households from using biogas were also calculated using the net direct use value of fuel-wood and the income of low-income South African households. The net direct use value of fuelwood and the upper band of the income bracket was inflated to current times using Equation 4.
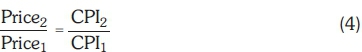
where Price2 is the current item price, Price1 is the base price, CPI2 is the current consumer price index and CPI1 the base year consumer price index.
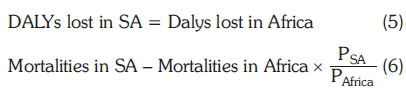
The attributable DALYs lost and mortalities avoided in South Africa due to the substitution of fuelwood use with biogas were calculated using Equations 5 and 6, where Psa, and PAfrica are the population sizes in South Africa and Africa in 2000 (43 791 000 and 655 476 000 respectively). DALYs lost and mortalities in Africa due to IAP from SFU were 12 318 00 and 392 000 in 2000 respectively (WHO, 2002). The solid fuel mix used in South Africa was used to calculate the attributable DALYs lost and mortalities avoided from indoor smoke from fuelwood use.
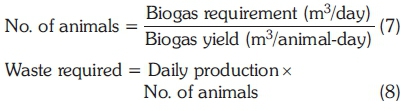
Equations 7 and 8 were used to calculate the number of animals and the animal waste requirements respectively for feeding a domestic bio-digester with an average size of 5-10 m3. The same methodology was followed when calculating the number of people and the human waste required for feeding an average-sized domestic bio-digester.
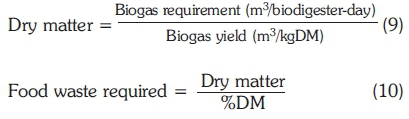
Biogas yield and daily production for animal and human waste were shown in Table 3. The weighted average %DM and biogas yield (m3/kg DM) for food waste were calculated as discussed in Section 2.1. Equations 9 and 10 were used to calculate the dry matter (kg DM/day-bio digester) and the respective daily food waste requirement (kg/day-bio digester).
The amount of water required for mixing waste was calculated using Equation 11. The %DM old for various feedstocks used in calculations were obtained from Table 3, where %DM opt is the optimum percentage dry matter of 8% for feeding a digester as recommended by Yadvika et al. (2004). Feed is the waste requirement calculated using Equations 8 and 10.

3.2 Data collection
In order to achieve the research objectives, the following data were collected from various literature sources.
(i) Thermal efficiencies and CVs for conventional domestic fuels and biogas were obtained from different literature sources as discussed in Section 2.1.
(ii) Fuelwood consumption by low-income households was obtained from Damm and Triebel (2008).
(iii) Energy mix in low-income South African households was obtained from Statistics SA (2013b).
(iv) Economic value of firewood in was obtained from Damm and Triebel (2008).
(v) Number of attributable DALYs and mortalities due to IAP from solid fuels were obtained from WHO (2002).
(vi) Properties of various feedstocks such as biogas yields and %DM were obtained from Bond and Templeton (2011) and Fulford (1988:35).
(vii) The South African population numbers and average size of a household were obtained from Statistics South Africa (2013b).
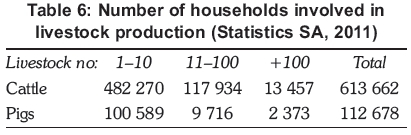
(viii) Household livestock numbers and the number of households involved in livestock production from Statistics South Africa (2011).
(ix) Food waste generated by a low-income South African household from Department of Environmental Affairs (2012).
(x) Available water resource in the form of free basic water supply was obtained from the Department of Water and Forestry (2007).
3.3. Data analysis
A comparative study of the following was conducted, and the results are given in Section 4.
(i) The calculated biogas requirement by low-income households for cooking against the 1 500-2 400 L/day/household that was reported by Bond and Templeton (2011).
(ii) The calculated fuelwood savings from installation of bio-digesters in low-income South African households against the 74% and 84% reported by Bond & Templeton (2011) for China and the Southern province of Sri Lanka respectively.
(iii) The calculated number of animals required per household against the number of animals per agricultural household.
(iv) The calculated number of people to produce enough human waste against the average size of a South African household.
(v) The calculated amount of food waste required against the amount of food waste generated by a low-income South African household.
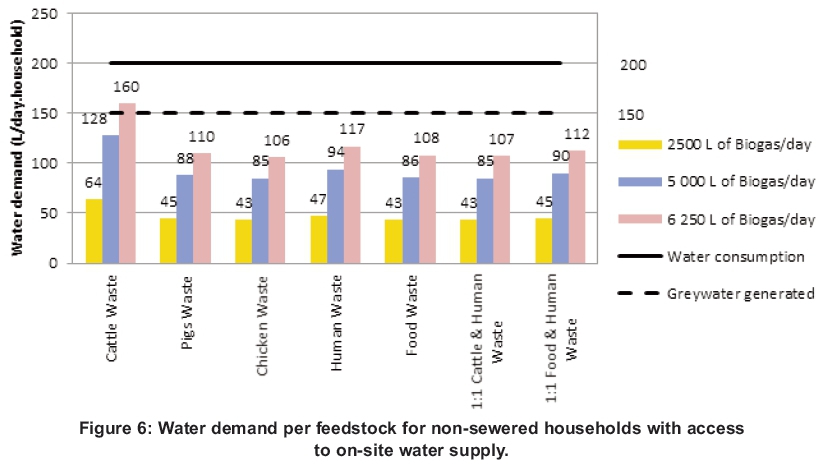
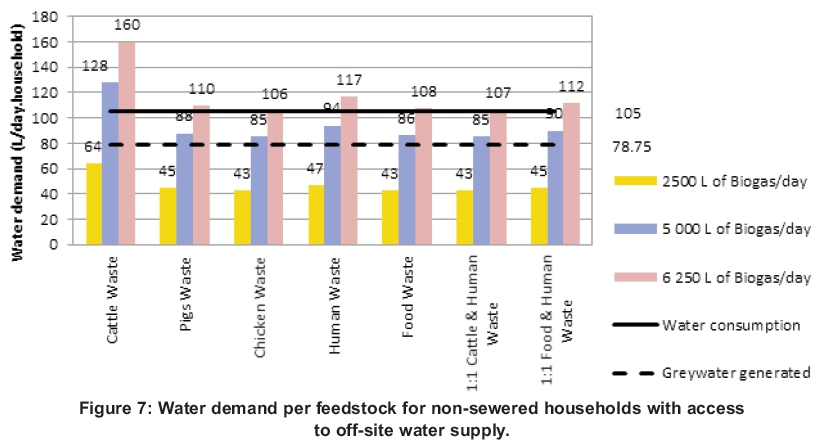
(vi) The calculated water demand for each feedstock against each other and against the 200 L/day/household of free basic water supply.
4. Results and discussion
Energy demand for cooking and the total energy demand by an average sized household were found to be 27 and 68 MJ/day/household respectively.
The biogas requirement for fuelwood replacement used for cooking is estimated at 2 500 L/day/household. This concurs with the biogas requirement for cooking of 1 500-2 400 L/day/house- hold of biogas (Bond & Templeton, 2011).
In low-income South African households, approximately 80% of the total energy used for cooking, space-heating and water-heating is derived from burning fuelwood (Damm & Triebel, 2008). This concurs with the assumption made by Pathak et al. (2009) and Surendra et al. (2014) that 80% of the produced biogas would be used for replacement of fuelwood and the remaining 20% would replace paraffin used in households for cooking and lighting respectively. Complete substitution of conventional domestic fuels with biogas requires 5 000 L/day/household for cooking, water- and space-heating and 1 250 L/day/household for lighting. Due to the low efficiency of biogas lamps and their associated safety concerns, the use of biogas for lighting is discouraged. The use of alternative lighting technologies such as PV solar home systems, comprising a solar panel, battery, light-emitting diode lights and a cell phone charger, are recommended.
Installation of a 2 500 L/day capacity bio-digester per household will result in a 50% reduction in total household fuelwood use whereas a 5 000 L/day capacity bio-digester would result in 100% reduction in the total household fuelwood use. This is comparable with the 74% and 84% reduction in household fuelwood use because of domestic biogas implementation in China and Sri Lanka respectively (Remais et al., 2009; Bond & Templeton, 2011; de Alwis, 2002).
Based on the inflated net direct use value of fuelwood (R1 808/annum) and the inflated upper band in the income range of low-income household (R21 013/annum), the installations of a 2 500 L/day capacity bio-digester will result in 4.3% household income savings. Installation of a 5 000 L/day capacity bio-digester will result in 8.6% household income savings. There are approximately 1.581 million households in South Africa that still rely on fuelwood as the main source of energy for cooking (Statistics SA, 2013a). This translates to a national cost savings of R1 billion/annum by replacing fuel-wood used for cooking with biogas, not taking into account the value of wood as an environmental asset.
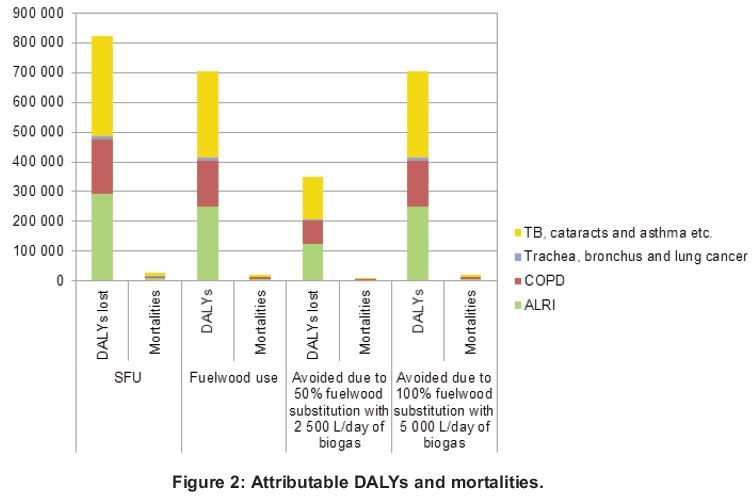
Figure 2 depicts the attributable DALYs lost and mortalities due to SFU, fuelwood use and the avoided attributable DALYs lost and mortalities from the installation of 2 500 and 5 000 L/day capacity bio-digesters. Complete substitution of fuelwood used for cooking with biogas will, therefore, result in the avoidance of 43% of total attributable DALYs lost and mortalities from indoor smoke due to SFU.
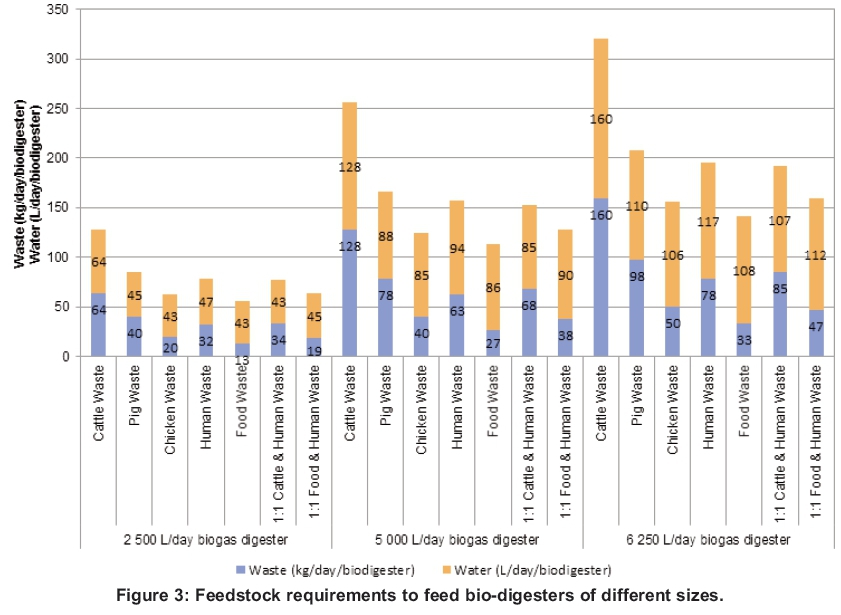
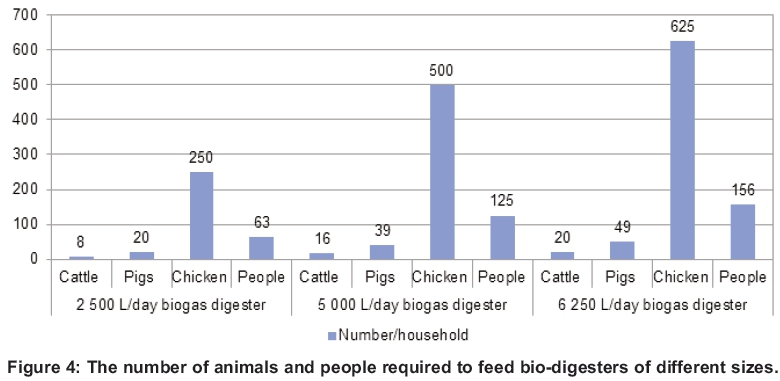
The number of animals and people required per household to produce enough waste for feeding a 2 500, 5 000 and a 6 250 L/day capacity biodigester are shown in Figure 3.
Bembridge and Tapson (1993) and Gaudex (2014) reported that in Southern Africa 68% of communal farmers own fewer than ten cattle, with an average of six per household. Using Figure 4 and Table 6, approximately 613 662 South African households can potentially benefit from a 2 500 L/day bio-digester installations fed with cattle dung. Approximately 131 391 households can potentially benefit from installations of a 5 000 or a 6 250 L/day capacity bio-digester fed with cattle dung.
Using Figure 3 and Table 6, 12 089 households that own pigs have a potential to benefit from a biodigester of any size, as 20 pigs or more are required for the smallest digester fed with pig waste.
The number of households involved in poultry production was estimated at 1.4 million (Statistics SA, 2011). The total number of chickens in South African households reported by Statistics SA (2010) was 22.8 million. The number of chickens per household (involved in poultry production) can be estimated at 16. Based on the number of chickens required (see Figure 4), it is infeasible to operate a bio-digester fed solely with chicken waste at house hold level in South Africa. A chicken farm is required for such an application.
The average size of a South African household is estimated at four (Statistics SA, 2013a). Based on the number of people required (Figure 4), the average size of a South African household is insufficient to produce enough human excreta for feeding a 2 500, 5 000 and 6 250 L/day capacity bio-digester.
A community bio-digester used by 15, 30 and 39 households is consequently recommended for feeding a 2 500, 5 000 and 6 250 L/day capacity bio- digester.
The total food waste generated by South African households is estimated at 1.44 million tons/annum (DEA, 2012). The number of households in 2011 was estimated at 14.6 million (Statistics SA, 2013a). The average food waste generated can therefore be estimated at 270 g/day/household. Based on the calculated food waste shown in Figure 3, an average South African household produces insufficient food waste for feeding a domestic bio-digester.
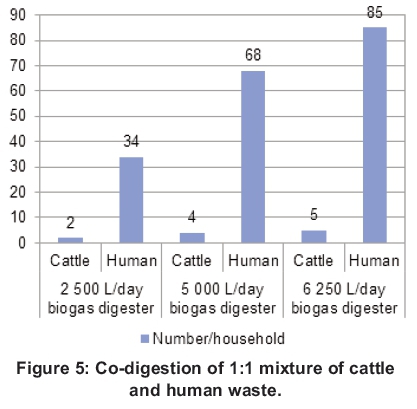
Co-digestion of a 1:1 mixture of cattle dung and human waste is infeasible in South African context because of a large number of people required per household (Figure 5). The majority of households that own cattle are necessarily in rural areas (Statistics SA, 2011). Co-digestion of cattle dung and human waste in a community digester is also infeasible for either rural or urban households because of the unavailability of cattle dung in urban areas and the segregated nature of rural households.
Co-digestion of a 1:1 mixture of food waste and human waste requires a household with at least 19, 38 and 47 members and food waste of 9.5, 19 and 23.5 kg/day for feeding a 2 500, 5 000 and 6 250 L/day capacity bio-digester respectively. Based on the average amount of food waste generated by a South African household and the average household size, there is insufficient kitchen and human waste for feeding a domestic bio-digesters per household. A community digester in a peri-urban area/informal settlement is recommended, due to the availability of both food and human waste.
In terms of water availability (Figures 6 and 7), non-sewered households generate sufficient grey-water for feeding a domestic biogas digester for cooking purposes (2 500L/day/bio-digester). Grey water is therefore recommended over drinking water. Water consumption by non-sewered South African households with access to on- and off-site water supply is approximately 200L/day and 105 L/day respectively (Carden et al., 2007). In cases where greywater is insufficient, augmentation with harvested storm water or water from nearby rivers, dams and streams is recommended.
5. Conclusions
In order to meet the energy demand for cooking in all low-income South African households, 2 500 L/day of biogas per household would be required.
Biogas requirement for complete substitution of household fuelwood use is 5 000 L/day and for complete substitution of conventional domestic fuels is 6 250 L/day of biogas.
Substitution of fuelwood used for cooking with biogas will result in the avoidance of 43% of the total attributable DALYs lost and mortalities from IAP due to SFU. Complete substitution of fuelwood with biogas will result in avoiding 85.4% of attributable DALYs lost and mortalities from IAP due to SFU.
Based on livestock numbers, approximately 625 000 households in South Africa can potentially benefit from bio-digesters fed with cattle and pig waste. It is infeasible to operate a domestic bio- digester fed solely with either chicken waste, human waste or food waste, because of insufficient feed- stock. Co-digestion of human with cattle waste and human with food waste is also infeasible at household level.
Non-sewered South African households generate sufficient greywater to mix with organic waste for feeding bio-digesters for cooking purpose.
6. Recommendations
The following recommendations are made:
(i) Launching of a pilot scale study to determine the actual replacement of fuelwood with biogas as well as the feasibility of domestic biogas technology in low-income South African households.
(ii) Installation of community bio-digesters in peri-urban areas/informal settlements co-fed with human and food waste. The community digesters must be connected to centralised local ablution facilities to make use of flushing water, thus limiting the water demand. Food waste generated by households can also be fed into the bio-digester thus resulting in co-digestion of food and human waste. Approximately 15 households can generate enough human waste to feed a digester for biogas production of 2 500 L/day to be used by at least one household per day for cooking purposes. A few of these bio-digesters can be installed in a single community when households interchangeably utilise biogas for cooking.
(iii) Installation of bio-digesters fed with chicken waste at a commercial level such as in chicken farms.
(iv) The use of greywater supplemented with harvested storm water or water from nearby rivers, dams and streams to limit the use of drinking water for feeding a domestic bio-digester.
References
Amigun, B., Parawira, W., Musango, J.K., Aboyade, A.O. and Badmos, A.S. 2012. Anaerobic biogas generation for rural area energy provision in Africa. In Kumar, S. (ed) Biogas. InTech. Online at: http://www.intechopen.com/books/biogas/anaerobic-biogas-generation-for-rural-area-energy-provision-in-africa [Accessed: May 2017]. [ Links ]
Bond, T. and Templeton, M.R. 2011. History and future of domestic biogas plants in the developing world. Energy for Sustainable Development 15: 347-354. [ Links ]
Carden, K. Armitage, N. Winter, K. Sichone, O. and Rivett, U. 2007. Understanding the use and disposal of greywater in the non-sewered areas in South Africa. Water Research Commission, Cape Town. [ Links ]
Damm, O. and Triebel, R. 2008. A synthesis report on biomass energy consumption and availability in South Africa. GTZ (Gesellschaft für Technische Zusammenarbeid) Programme for basic energy and conservation (ProBEC). ProBEC and LHA Management Consultants, Pretoria, South Africa. [ Links ]
De Bruyn, C. 2013. Nersa registers six KZN biogas production operations [WWW] Engineering News. Available from: https://rn.engineeringnews.co.za/article/nersa-registers-six-kzn-biogas-production-operations-2013-10-28 [Accessed: June 2014]. [ Links ]
Department of Environmental Affairs. 2012. National environmental management: Air quality act (39/2004): Highveld priority area air quality management plan - Gazette No. 35072. Pretoria, South Africa. [ Links ]
Department of Minerals and Energy. 2003. White Paper on the Renewable Energy Policy of the Republic of South Africa. Pretoria, South Africa. [ Links ]
Department of Water Affairs and Forestry. 2007. Free basic water implementation strategy 2007: Consolidating and maintaining, Version 4. Pretoria. South Africa. [ Links ]
Deublein, D. and Steinhauser, A. 2008. Biogas from waste and renewable resources. Weinheim: Wiley- VCH. [ Links ]
Dioha, E. Dioha, J. and Nfor, B. 2012. Operating and financing biogas plant. Journal of Energy Technologies and Policy 2 (5): 25-37. [ Links ]
Everson, T.M. and Smith, M.T. (Eds). 2015. Rural livelihoods through biogas generation using livestock manure and rainwater harvesting. Volume 1: Research report. Report to the Water Research Commission. [ Links ]
Ferrer, I. Garfí, M. Uggetti, E. Ferrer-Martí, L. Calderon, A. and Velo, E. 2011. Biogas production in low-cost household digesters at the Peruvian Andes. Biomass and Bioenergy 35: 1668-1674. [ Links ]
Fulford, D. 1988. Running a biogas programme: A handbook. London: Intermediate Technology Publications. [ Links ]
Garfí, M. Ferrer-Martí, L. Velo, E. and Ferrer, I. 2012. Evaluating benefits of low-cost household digesters for rural Andean communities. Renewable and Sustainable Energy Reviews 16: 575-581. [ Links ]
Gaudex, L. 2014. A health and demographic surveil lance system of cattle on communal rangelands in Bushbuckridge, South Africa: Baseline census and population dynamics over 12 months. MSc. dissertation, University of Pretoria, South Africa. [ Links ]
Gautam, R. Baral, S. and Herat, S. 2009. Biogas as a sustainable energy source in Nepal: Present status and future challenges. Renewable and Sustainable Energy Reviews 13: 248-252. [ Links ]
Ghimire, PC. 2013. SNV supported domestic biogas programmes in Asia and Africa. Renewable Energy 49: 90-94. [ Links ]
Greben, H.A. and Oelofse, S.H.H. 2009. Unlocking the resource potential of organic waste: a South African perspective. Waste Management and Research 27: 676-684. [ Links ]
Hennekens, E. 2012. Biogas as domestic energy solution? Potentials and barriers of the technology for low-income households in South Africa. Master thesis, Wageningen University, Netherlands. [ Links ]
Mengjie, W. 2002. Biogas technology and ecological environment development in rural areas of China. Chinese Academy of Agriculture Engineering Research. http://www.ecosanres.org/PDFfiles/NanningPDFs/Eng/Wang Mengjie 12_C19.pdf [ Links ]
Nahman, A. and de Lange, W. 2013. Costs of food waste along the value chain: Evidence from South Africa. Waste Management 33: 2493-2500. [ Links ]
Ng'wandu, E., Shila, L. and ter Hegde FE.W. 2009. Programme Implementation Document: Tanzania Domestic Biogas Programme. Stichting SNV Nederlandse Ontwikkelingsorganisatie, Den Haag, Netherlands http://area-net.org/wp-content/uploads/2016/01/Tanzania_Biogas_Programme.pdf. [Accessed May 2017]. [ Links ]
Parawira, W. 2009. Biogas eechnology in Sub-Saharan Africa: Status, prospects and constraints. Reviews in Environmental Science Bio/Technology 8: 187-200. [ Links ]
Pathak, H., Jain, N., Mohanty, S. and Gupta, N. 2009. Global warming mitigation potential of biogas plants in India. Environmental Monitoring and Assessment 157: 407-418. [ Links ]
Pérez, I., Garfí, M., Cadena, E. and Ferrer, I. 2014. Technical, economic and environmental assessment of household biogas digesters for rural communities. Renewable Energy 62: 313-318. [ Links ]
Rajendran, K., Aslanzadeh, S., and Taherzadeh, M.J. 2012. Household biogas digester - A review. Energies 5: 2911-2942. [ Links ]
Resources Centre for Sustainable Development, 2008. Biogas manual. Assam, India. http://www.build-a-biogas-plant.com/PDF/biogas-tech-manual2008.pdf [accessed May 2017]. [ Links ]
South African Local Government Organisation (SALGA). 2014. Guideline on technologies for reducing energy poverty in low-income households (Draft). SALGA, Pretoria. [ Links ]
Smith, M.T and Everson, T.M. (Eds). 2016. Improving rural livelihoods through biogas generation using livestock manure and rainwater harvesting. Volume 2: Guideline Report. Report to the Water Research Commission. [ Links ]
Statistics South Africa. 2010. General household survey. Pretoria, South Africa. Statistics South Africa. [ Links ]
Statistics South Africa. 2011. Agricultural households. Pretoria, South Africa. Statistics South Africa. [ Links ]
Statistics South Africa. 2013a. General household survey. Pretoria, South Africa. Statistics South Africa. [ Links ]
Statistics South Africa. 2013b. In-depth analysis of the general household survey data. GHS Series, volume V, Energy, 2002-2012. Pretoria, South Africa. [ Links ]
Surendra, K.C. Takara, D. Hashimoto, A.G. and Khanal, S.K. 2014. Biogas as a sustainable energy source for developing countries: Opportunities and challenges. Renewable and Sustainable Energy Reviews, 31, 846-859. [ Links ]
Van Nes, J. and Nhete, T.D. 2007. Biogas for a better life: an African initiative. Appropriate Technology, 34 (4), 58-62. [ Links ]
WHO (World Health Organization). 2002. The World Health Report 2002: Reducing risks, promoting healthy life. Geneva, Switzerland. [ Links ]
World Bank 2017. Sustainable Energy for All (SE4ALL) database from the SE4ALL Global Tracking Framework. http://data.worldbank.org/indicator/eg.Elc.Accs.Zs [accessed 17 May 2017]. [ Links ]
Yadvika, Santosh, Sreekrishnan, T.R. Kohli, S. and Rana, V. 2004. Enhancement of biogas production from solid substrates using different techniques - a review. Bioresource Technology, 95, 1-10. [ Links ]
* Corresponding author: Tel: +27 82 925 9569; email: gerrit.kornelius@up.ac.za

