


Services on Demand
Article
 English (pdf)
 Article in xml format
 Article references
Indicators

Related links
-
 Cited by Google
 -
 Similars in Google
Share

 Permalink
Journal of Energy in Southern Africa
On-line version ISSN 2413-3051
Print version ISSN 1021-447X
J. energy South. Afr. vol.28 n.1 Cape Town Feb. 2017
http://dx.doi.org/10.17159/2413-3051/2017/v28i1a1498
ARTICLES
The role of energy in development
Philip J. Lloyd*
Cape Peninsula University of Technology, Energy Institute, P.O. Box 1906, Bellville 7595, South Africa
ABSTRACT
Using World Bank Development Indicators, it is shown that the use of energy is strongly related to almost every conceivable aspect of development. Wealth, health, nutrition, water, infrastructure, education, even life expectancy itself, are strongly and significantly related to the consumption of energy per capita. In general, the approach taken was to break the consumption of energy into three or more classes, to calculate the average value of the relevant indicator in each class, and to demonstrate that the average value in one class was statistically different, at above the 95% confidence level, from the average in adjacent classes. In the case of life expectancy, the change in expectancy was tracked against energy consumption over 40 or more years, in India, China, Indonesia and Brazil. It is concluded that energy is such a necessary element in development that it should be seen as a basic right. The impact of energy on development is felt strongly up to about 2 000 kg oil equivalent per capita, and is essentially saturated above that level. The data are qualitatively assessed using the environmental Kuznets curve. The OECD nations appear to have peaked, and emissions may continue to drop for the foreseeable future. However, emissions from the non-OECD nations have surged in this millennium, and are likely to exceed 40 000 Mt CO2 per annum before slowing. In this light, the intent of the Paris Agreement to constrain global temperature rise to less than 1.5 °C, seems unrealistic. Any hopes of reducing carbon dioxide emissions significantly, in the face of development by the developing nations, seems doomed to failure.
Highlights
• Many development indicators are strongly related to the per-capita energy consumption.
• The impacts of increasing energy on development continues up to about 2000 kg oil equivalent per capita per year.
• Over the past 50 years, increases in per-capita energy consumption correlate strongly with increases in life expectancy.
• If all developing nations strive for 2000 kg per capita per year energy consumption, CO2 emissions will continue to rise.
Keywords: development, World Bank Indicators, life expectancy, future emissions
1. Introduction
There is a dichotomy in much of the thinking about development, caused by the dominant position of fossil fuels in the supply of energy. The dichotomy arises because, in general, economic development is associated with greater levels of energy consumption, but that in turn means that there is a conflict between development and the desire to reduce emissions. The Indian position presented to the 21st Conference of Parties held in Paris in November 2015 [1] illustrates the difficulties faced in trying to achieve sustainable development while simultaneously seeking social and economic development:
The desire to improve one's lot has been the primary driving force behind human progress. While a few fortunate fellow beings have moved far ahead in this journey of progress, there are many in the world who have been left behind. Nations that are now striving to fulfill this 'right to grow' of their teeming millions cannot be made to feel guilty of their development agenda as they attempt to fulfil this legitimate aspiration. Just because economic development of many countries in the past has come at the cost of environment, it should not be presumed that a reconciliation of the two is not possible.
As a result, an 'emission' ambition gap has been created calling for enhanced global actions to address it. India, even though not a part of the problem, has been an active and constructive participant in the search for solutions. Even now, when the per capita emissions of many developed countries vary between 7 to15 metric tonnes, the per capita emissions in India were only about 1.56 metric tonnes in 2010.
Importantly, there is the admission that solutions continue to be sought. Considering the magnitude of the problem, it is surprising that there has been only a modest amount of work to address it. The example of China is instructive. For instance, Peters et al. [2] and Minx [3] found that, in China, emissions driven by urbanisation and lifestyle changes were growing faster than gains in economic productivity. Policies that could alter the balance were identified, but with full recognition of the political challenges in introducing such policies. Bosetti et al. [4] argued that developing countries would incur substantial economic losses by following a strategy that disregards climate in the short-run, and that their optimal investment behaviour is to anticipate the implementation of a climate policy by roughly ten years. There were, however, no constructive suggestions given as to how this was to be achieved.
Ultimately, the problem reduces to one of achieving sustainable development. The 2002 Johannesburg World Summit on Sustainable Development formalised the recognition that there are three legs to sustainable development, the environmental, the social and the economic [5]. Previous definitions, such as that by Brundtland [6], tended to focus on intergenerational equity and neglected the economic dimension. The neglect made practical application of the Brundtland definition difficult, which was why the Johannesburg definition became necessary. Nevertheless, achieving a balance between the three legs remains challenging, and varies in difficulty from case to case. The theoretical background for addressing the problem largely rests on the environmental Kuznets curve [7]. As economies grow, at first environmental degradation outstrips the growth in income, then the point is reached where further economic growth permits environmental remediation [8]. The critical question is, therefore, whether there are signs that economic growth has reached the level at which resources can be diverted from consumptive growth to remediation. Thus the purpose of this paper is twofold. First, to examine linkages between development and energy consumption to identify possible signals of limits to growth, and secondly, to apply that signal to various nations to estimate the proximity of their economies to the Kuznets maximum. From this, it should be possible to derive an estimate of the timing of real emission reductions.
2. Methodology
Data on many aspects of development were drawn from the World Bank's World Development Indicators [WDI] database [9]. The database was sorted into nations, and data for specific parameters copied for every nation for the latest year for which there was reasonably complete data, generally 2014. There are some 1500 indicators in the WDI database, each identified by an individual code. There is a separate listing of these codes in the WDI database to aid in locating the data. So, for instance, the national energy use per capita, expressed in kg oil equivalent, was drawn for the series coded EG.USE.PCAPKG.OE for every nation from Afghanistan to Zimbabwe. The primary energy sources - coal, oil, gas, hydro, nuclear, renewable - each deliver so many MJ of energy. For convenience the energy is often quoted in 'oil equivalent'. One tonne of oil is equivalent to about 42 GJ or 12 MWh electricity.
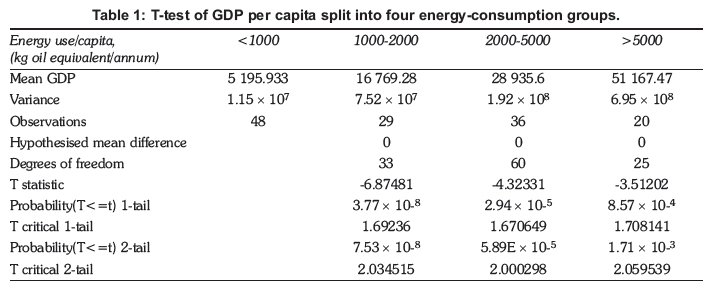
Of the 242 records, 36 were groupings of nations such as World, North America, OECD. These were ignored, leaving 216 individual nations, 140 of which reported energy consumption in 2014. In the same way, the gross domestic product (GDP) per capita, purchasing power parity in constant 2011 international USD, was drawn for the same 216 nations for 2014 from the series NY.GDRPCARPRKD. There were 189 reports of GDP. The two series were sorted on energy consumption. The data were then broken into classes: 0-500 kg oil equivalent per annum, 500-1000, 1000-2000, 2000-5000 and >5000 kg oil equivalent consumption per capita per year. A t-test was used to make certain each class was significantly different from the other classes. In the case of GDP per capita, it transpired that the 0-500 and 5001000 kg oil classes were not significantly different at the 5% level, so they were run together and treated as a single class for the final analysis. Table 1 gives the statistical analysis of the various classes and Figure 1 shows the results. Please note that the numbers above the bars in all the charts indicate the numbers in the samples (countries, in the case of Figure 1).
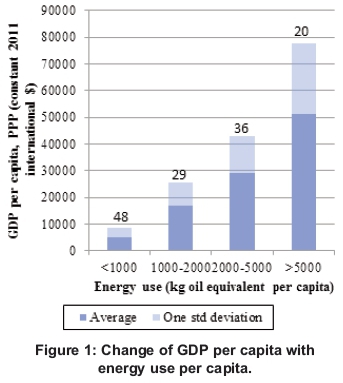
Because the absolute value of t statistic is so much larger than the 95% probability limit, t critical, the probability that the GDP sample in each group comes from a different population is very high.
In Figure 1, there are 48 countries in the energy use category <1000 kg. The average GDP per capita in these countries is about USD 5200 ±2400 (1 standard deviation). This is clearly less than the average USD 16 700 per capita in the 29 countries in the 1000-2000 kg class, which in turn is less than the average USD 28 900 in the 36 countries in the 2000-5000 class, and so on.
It can only be concluded from this example that there is a very strong relationship between energy consumption and the generation of wealth. As wealth is one of the stronger indicators of development, energy clearly plays an important part in development.
In the study of different indicators, a similar methodology is used to show how these other indicators of development are related to energy consumption. In every case shown, the probability that a particular class is different from the class on either side is greater than 95%.
3. Analysis
3.1 Energy and food
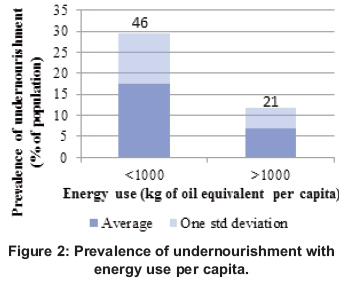
Any attempt to analyse the supply of food soon faces the challenge that today, the majority of the world's population is comparatively well-fed, so that there are only small differences between the different national metrics. Certainly none of the world's wealthier nations admit to any significant level of malnutrition among their citizens. What data is available for 2014 is summarised in Figure 2. This shows that, for energy use below 1000 kg oil equivalent, there is a strong likelihood that over 15% of the population will be undernourished. Above 1000 kg oil equivalent, less than 7% will be undernourished - not shown, because it is statistically not significant, is that when the energy consumption exceeds 2000 kg oil equivalent, all are effectively properly fed, i.e. there is no undernourishment.
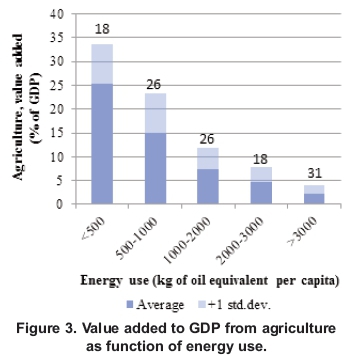
Another way of looking at energy and food is to consider how much energy is expended in agriculture, relative to the energy used elsewhere in the economy. Figure 3 shows the percentage of GDP that is derived from agriculture as a function of energy use. Where energy is in short supply (<500 kg oil equivalent per person), then agriculture is a major factor in the economy, contributing over 25% to the national production. If the economy develops to the point where energy use is over 3000 kg oil equivalent per person, then agriculture contributes less than 3% to national production - the nation is fed without diverting much energy to food.
3.2 Energy and water
The provision of clean potable water is almost a marker for social development. Indeed, engineers who have brought clean water to the people have been hailed by the medical profession as saving more lives than any other act of the health professions. The United Nations Resolution 64/292, of July 2010, makes the provision of clean water a human right [10]. Providing clean water requires energy to:
• raise it from where it is found to the level where it is to be used;
• purify it before use;
• distribute it to homes and industries;
• collect it and purify it after use; and
• move it to power stations to cool them so they can produce the energy needed for the functions listed above.
On average, about 5% of the total energy used worldwide is employed in the treatment and distribution of water. The extent to which clean water is widely available is illustrated in Figure 4.
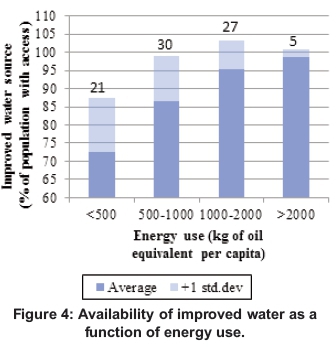
If the nation has a low energy use (<500 kg/capita) then it is probable that more than a quarter of the population will not have access to clean water. As energy use increases, so access to clean water improves. Once the energy use exceeds 2000 kg oil equivalent per capita, access to clean water is virtually guaranteed.
3.3 Energy and infrastructure
The more developed a nation, the greater are its needs to move goods and services. Roads and rail must link cities and ports, rivers must be bridged, mountains passed or tunnelled, seaports and airports created. The World Bank's database has no indicators of this aspect of development, but extensive data on the length of highways in each country is available from Wikipedia [11]. Wikipedia is arguably a source to be normally avoided, but in the present case the quoted material is all from official sources, and the Wikipedia entry provides a convenient tabulation of otherwise very scattered data. The World Bank lists the land area of each nation, so it is a simple matter to calculate the length of road per unit area. Figure 5 gives the results.
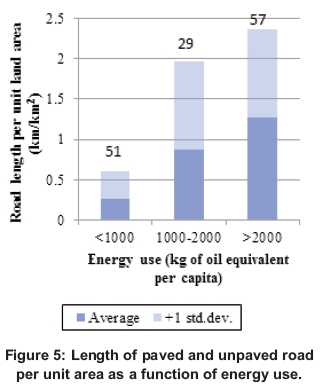
Where the use of energy is below 1000 kg of oil equivalent per capita, there is about 0.2 km of road in every km2 of land. Where the use of energy exceeds 2000 kg of oil equivalent, roadworks extend to nearly 1.3 km for every km2. Thereafter the demand for roadworks is essentially saturated -there is no further increase in the road density. Provision of the necessary infrastructure requires maintenance rather than the expenditure of further capital on roadworks.
3.4 Energy and electricity
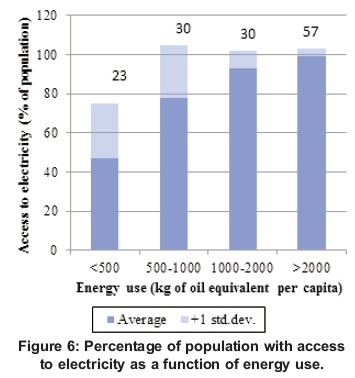
Electricity is a secondary form of energy, derived from the primary sources, oil, gas, coal. Energy is far more readily distributed and used in the form of electrons than in any of the primary forms. The convenience and safety of the use of electricity is unmatched by any other source of energy. This is especially true in the case of domestic energy - the home powered by electricity is cleaner, safer, and enjoys a wider range of energy services than can be provided by any other form of energy. The challenge is to distribute the electrons. At present, the optimal solution is the installation of a transmission grid, carrying the electrons at high voltage across long distances, and a local, low-voltage distribution network. There is a great desire to find ways of providing equivalent levels of service through local renewable energy generation feeding a local grid, but lack of efficient means for storing electrons has thus far defeated these hopes. Accordingly, it remains necessary to build expensive transmission grids to deliver electrons to remote areas. An indicator of development is thus the fraction of the population that can be serviced by a national grid. The data are shown in Figure 6. If the national energy use is less than 500 kg oil equivalent, then less than half the population may have ready access. Energy use has to grow to above 2000 kg oil equivalent for essentially everyone to enjoy the benefits of electrical power.
3.5 Energy and education
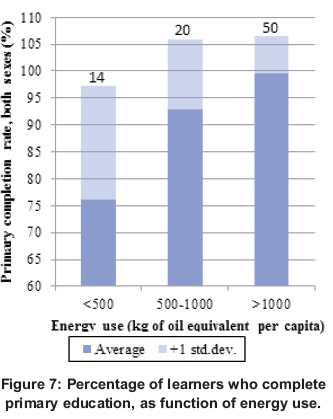
It is generally supposed that the availability of electric light enables learners to continue their studies at night. The data are limited, but they tend to support this hypothesis. If the national energy use is below 500 kg oil equivalent, then about a quarter of the learners will not complete primary schooling; if the energy use rises towards 1000 kg oil equivalent, over 5% will not complete; if the energy use exceeds 1000 kg oil equivalent, then all will complete their primary education.
3.6 Energy and commerce
There is obviously a need for energy in industry, and particularly in heavy industry. But today, heavy industry tends to be associated with the early stages of development. Secondary industry and commercial services assume a larger role as the economy develops. The result is that there is no strong relationship between energy use and heavy industry. Contrariwise, there is a surprising degree of association between energy use and commerce, because commerce grows as economies develop. Internet use rises, for instance. Modern telephony is a counter-example - mobile phone use has everywhere grown far faster than the underlying economies. At present, there is a strong relationship between the availability of automated teller machines (ATMs) for dispensing cash and energy use, as shown in Figure 8. Energy-poor nations with <500 kg oil equivalent per person have about 1 ATM per 10 000 citizens; nations whose citizens use more than 2000 kg oil equivalent per person have an ATM for every 1200. However, nothing stands still in business. The days of ATMs are almost certainly numbered. Particularly in Scandinavia, the cashless society is spreading [12]. Will ATMs soon go the way of fax machines?

3.7 Energy and family
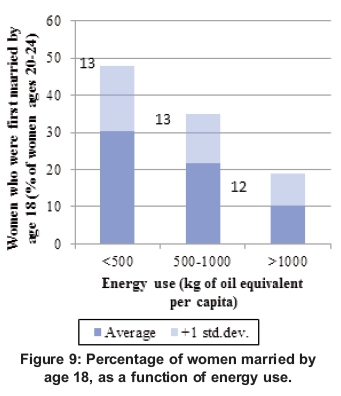
The availability of energy creates opportunities for a wider range of activity than otherwise. The data are limited, but the statistics are quite unequivocal -the more energy a society has available to it, the less will be the tendency for women to marry young. If the energy use were <500 kg oil equivalent, then about 30% of all young women may be expected to be married by the time they are 18, a percentage which drops to 10% once energy use exceeds 1000 kg.
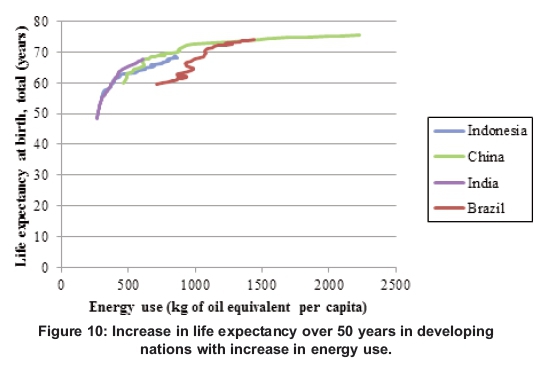
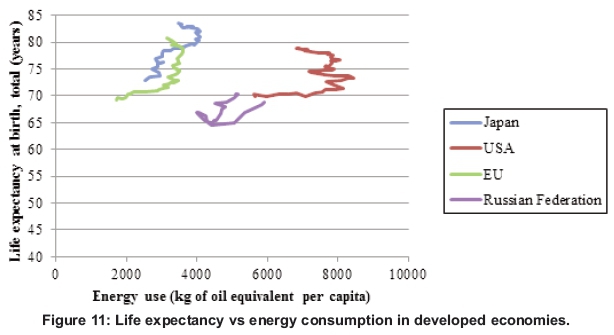
3.8 Energy and life expectancy
The impact of energy on life expectancy is developing nations is very similar, as Figure 10 illustrates. The World Bank data for life expectancy since 1960 until 2014 was plotted against the per capita energy use for Indonesia, China, India and Brazil, as four of the largest developing nations. In every case, an increase in energy use over the years is associated with a significant increase in life expectancy. The same is not true of developed nations, with energy use in excess of 2000 kg oil equivalent per capita. In this case, there is no relationship between energy consumption and life expectancy.
4. Discussion and conclusions
Energy has a demonstrable positive impact on almost every aspect of life - health, wealth, nutrition, clean water, transport, education, business, domesticity, and, most importantly, how long we may expect to live. Indeed, it is surprising that no-one has suggested that we should have a right to a basic amount of energy, such is the positive impact of energy on human life. The use of energy always has a positive effect, but there are diminishing returns after about 2000 kg of oil equivalent per capita. This thus represents the probable peak in the Kuznets environmental curve, where environmental degradation due to energy production slows and the resources needed for remediation become available.
While energy is a necessary component of human development, however, it is not sufficient. There are numerous examples where the benefits of energy have not been equitably spread. This has given rise to the concept of a 'resource curse' [13]. In fact, it is not the resource which is the curse, but the political system which has allowed the few to seize the benefits that should be shared among the many. The wealthiest nation in Africa is oil-rich Equatorial Guinea, with a GDP per capita of over USD 30 000, yet less than half the population has access to clean water, and two-thirds of the population live in slums [9].
The value of energy should not be doubted. It is rarely recognised that the cost of unserved energy can be as much as 100 times the cost of providing energy. In 2008, the immediate impact of the loss of reliable power in South Africa was about ZAR 75/kWh unserved; the price of power at that stage was about ZAR 0.40/kWh. The value lost in the North-East power failure in the USA in August 2003 was about USD 8/kWh [14], which is comparable to the South African cost. It appears, however, as if this should be viewed as an instantaneous cost; as people adapt to repeated power failures, so they take steps to minimise the impact by, for instance, installing generators. Thus the present-day cost of unserved power in South Africa is more of the order of ZAR 8/kWh [15], which is essentially the cost of running a standby generator at a low load factor.
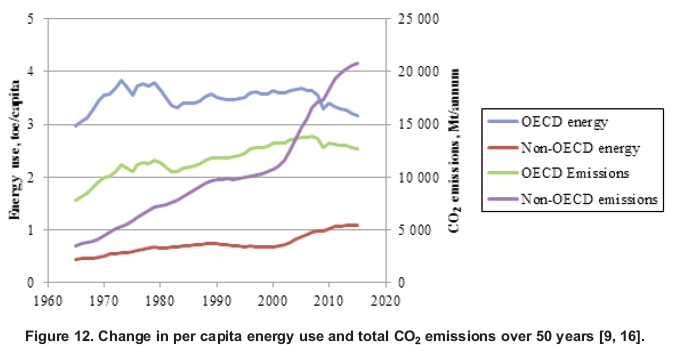
Where should the energy come from? At present, over 80% of the primary energy in the world is derived from fossil fuels, oil, coal and natural gas [16]. Fossil energy will probably remain the major source of energy for more than a generation. So the question underlying the Indian report to the Paris Conference of Parties in 2015 is, if developing nations are to develop to the point where the per capita energy consumption is of the order of 2000 kg oil equivalent, will it be possible for the developed world to curtail its emissions so that globally the Paris targets are achieved? At present, total CO2 emissions amount to about 33 500 million tonnes globally, of which the developed OECD nations contribute about 12 500 million tonnes [16]. The change in energy use and CO2 emissions since 1965 is shown in Figure 12. The OECD emissions appear to be following a downward curve since 2007. It seems entirely possible that they have passed the Kuznets peak and that their emissions will continue to fall for the foreseeable future. In contrast, the non-OECD emissions have surged in this millennium, and seem likely to continue to rise rapidly, particularly if every developing nation strives for per capita consumptions of the order of 2000 kg per annum, nearly double present levels. This would imply peak non-OECD emissions of the order of 40 000 Mt per annum and global emissions of the order of 55 000 Mt per annum.
Any consideration of Figure 12, in light of the fact that the Paris Agreement is binding only on developed countries, leads to the conclusion that, at best, the Parties to the Agreement are optimistic. A more rational assessment of their hopes for a longterm reduction in emissions can only be that they are mistaken.
Acknowledgements
A draft of this paper was presented as a keynote address at 6th International Association of Science and Technology for Development conference, Gaborone, Botswana, 5-7 September 2016. The organisers of the Conference are to be thanked for their kind invitation.
References
[1] Government of India. 2015. India's intended nationally determined contribution: Working towards climate justice. Available online at: http://www4.unfc-cc.int/submissions/INDC/Published%20Documents/India/1/INDIA%20INDC%20TO%20UNFCCC.pdf.Accessed August 2016. [ Links ]
[2] Peters, G.P, Weber, C.L., Guan, D. and Hubacek, K. 2007. China's growing CO2 emissions - A race between increasing consumption and efficiency gains. Environmental Science & Technology 41 (17): 5939-5944. DOI: 10.1021/es070108f. [ Links ]
[3] Minx, J.C., Baiocchi, G., Peters, G.P, Weber, C.L., Guan, D. and Hubacek, K. A. 2011. 'Carbonizing dragon': China's fast growing CO2 emissions revisited. Environmental Science & Technology 45 (21): 9144-9153. DOI: 10.1021/es201497m. [ Links ]
[4] Bosettia, V, Carrarob, C. and Tavoni, M. 2009 Climate change mitigation strategies in fast-growing countries: The benefits of early action. Energy Economics 31 (Supplement 2): S144-S151 http://dx.doi.org/10.1016/j.eneco.2009.06.011. [ Links ]
[5] World Summit on Sustainable Development. 2002. Declaration. WSSD Johannesburg. [ Links ]
[6] World Commission on Environmental Development. 1987. Report of the World Commission on Environment and Development: Our Common Future. WCED, New York. [ Links ]
[7] Stern, D.I., Common, M.S and Barbier, E.B. 1996. Economic Growth and Environmental Degradation: The environmental Kuznets curve and sustainable development. World Development 24 (7):1151-1160. [ Links ]
[8] Panayatou, T. 2016. Economic growth and the environment. In Haenn,N., Harnish, A. and Wilk, R. (eds). The environment in anthropology (Second Edition), NYU Press, 140-148. [ Links ]
[9] World Bank, 2016. World Development Indicators, June 2016. Excel spreadsheet, World Bank, Washington, D.C. Available online at http://data.worldbank.org/products/wdL Accessed July 2016. [ Links ]
[10] United Nations, 2010. Resolution 64/292. The human right to water and sanitation. UN General Assembly, New York, 108th Plenary Meeting, 28 July 2010. Available online at http://www.un.org/es/comun/docs/?symbol=A/RES/64/292&lang=E. Accessed September 2016. [ Links ]
[11] Wikipedia. 2016. List of countries by road network size. https://en.wikipedia.org/wiki/List_of_countries_by_road_network_size Accessed September 2016. [ Links ]
[12] The Guardian, 2016. Sweden leads the race to become a cashless society. Available online at https://www.theguardian.com/business/2016/jun/04/sweden-cashless-society-cards-phone-apps-leading-europe. Accessed September 2016. [ Links ]
[13] Sachs, J.D and Warner, A.M. 2001. The curse of natural resources. European Economic Review 45: 827-838. [ Links ]
[14] La Commare, K.H. and Eto, J.H. 2006. Cost of power interruptions to electricity consumers in the United States. Energy 31(12): 1845-1858. [ Links ]
[15] Personal communication, R Jeffrey, Econometrix, September 2016. [ Links ]
[16] BP 2016 Statistical Review of World Energy. BP Ltd https://www.bp.com/content/dam/bp/pdf/energy-economics/statistical-review-2016/bp-statistical-review-of-world-energy-2016-full-report.pdf. [ Links ]
* Tel: +27 (0)21 959 4323 Email: plloyd@mweb.co.za

