


Services on Demand
Article
 English (pdf)
 Article in xml format
 Article references
Indicators

Related links
-
 Cited by Google
 -
 Similars in Google
Share

 Permalink
Journal of Energy in Southern Africa
On-line version ISSN 2413-3051
Print version ISSN 1021-447X
J. energy South. Afr. vol.28 n.1 Cape Town Feb. 2017
http://dx.doi.org/10.17159/2413-3051/2017/v28i1a1635
ARTICLES
Driving forces for fuelwood use in households in the Thulamela municipality, South Africa
Solomon Eghosa Uhunamure*; Nthaduleni Samuel Nethengwe; Agnes Musyoki
Department of Geography and Geo-information Sciences, University of Venda, X5050, Thohoyandou 0950, South Africa
ABSTRACT
Energy is a fundamental requirement to sustain human life, but most people in rural areas do not have enough access to efficient and affordable energy resources. Socio-economic measures are increasingly used to determine household energy consumption patterns. The pattern of household energy consumption represents the status of welfare as well as the stage of a country's economic development. Household energy consumption is expected to increase in the future, along with growth in the economy and a rise in per capita incomes. This study was undertaken to understand the driving forces for energy preference in rural households, while reassessing the energy ladder and multiple fuel use. Two hundred questionnaires were administered to elicit information from respondents in Altein, Botsoleni, Makhovha and Thenzheni in the Thulamela municipality of South Africa. A non-parametric test (Chi-square) was used to determine the relationships amongst the factors influencing the use of fuelwood in the study area. Cramer's V was used to test the association of the variables, the strength and the direction of the relationship. The results indicate that household income, educational level and employment status, cultural norms and values, are among the key determinants of the energy preference scale.
Keywords: rural households; energy consumption; energy ladder; energy preference
1. Introduction
Tropical Africa depends on fuelwood for about 90% of its energy supply (Boahene, 2008), because it is still far cheaper than most alternative available forms of fuel. The extent and uses of fuelwood for energy and its consumption rates are influenced by a number of factors. These include climate, forest cover, attitude, energy demand and household size (Kituyi et al., 2001). Households preferentially invest their limited financial resources into fuelwood rather than electricity in order to meet their domestic energy needs (Davis, 1998; Thom, 2000). This preference is linked to various socio-economic factors such as prohibitive costs of monthly electricity tariffs (relative to household incomes) and the costs of purchasing electrical appliances that need to be maintained efficiently (Williams & Shackleton, 2002). The cost of electricity relative to the financial income earned by these households is a major factor preventing these households from switching exclusively to electricity (Williams & Shackleton, 2002).
In South Africa, rural households tend to incorporate electricity into their domestic energy mix, primarily using electricity for lighting (Madubansi and Shackleton 2006), even though subsidised electricity tariffs, provided as a free basic allowance, are granted to them by the national electricity provider (Davis, 1998; Thom, 2000). Rural areas in South Africa, like in many other developing countries, are less privileged in terms of social services and infrastructure (Masekoameng et al., 2005). Where services are available in rural areas, they are few and usually of low quality; energy comes mainly from the traditional sources such as fuelwood and cow dung.
Household patterns of energy consumption normally represent status and welfare as well as the stage of economic development. Generally, as the national economy develops, more energy is consumed. Household energy consumption is expected to increase in the future, in line with growth in the economy and a rise in per capita incomes, and it is projected that increases in household energy consumption will result from changes in lifestyles (Pachauri, 2004). The energy carriers are used for multiple purposes, such as cooking, water-heating and lighting. Many households use fuelwood for both cooking and water-heating, while others use paraffin (kerosene) and liquefied petroleum gas (LPG) for cooking. Water-heating is done with either fuelwood or electricity (Sepp, 2014).
Limpopo Province, with a fairly large proportion of its population living in the rural areas, has the highest consumption of fuelwood in South Africa, with 40% in 2014 relying on fuelwood for cooking - leading to problems of deforestation and soil erosion (Statistics South Africa, 2015). This article examines the socio-economic factors that drive fuelwood choice at household level in the Thulamela municipality in Limpopo.
2. Fuel choice by households: theoretical background
2.1 Energy ladder
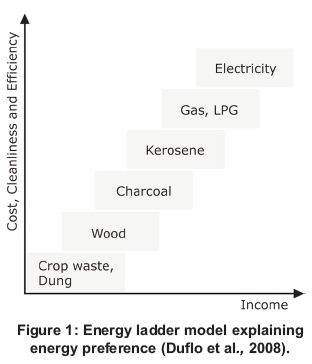
Fuel choice in households has, in the past, often been understood and analysed through the model of the energy ladder (Van der Kroon et al., 2013). Central to the idea of the energy ladder is that, as their income rises, households will shift to modern sources of energy like LPG and electricity. The total consumption of energy will not increase significantly, due to the use of more efficient devices. Many households, however, use a mixture of modern and traditional fuels, whereby each fuel is matched to a specific end-use, such as cooking with fuelwood while heating water with LPG. The total energy consumption in rural areas consists of biofuels, most of which are fuelwood, charcoal and agricultural waste, while in the urban areas paraffin, electricity and LPG are the major energy carriers (Sepp, 2014).
The form of substitution of one form of energy with another makes a clear pattern (see Figure 1). When there is an increase in income, solid fuels (charcoal and firewood) usually give way to a liquid fuel (paraffin), which in turn is displaced by LPG and electricity, which are the most desirable energy forms in high-income households. Households tend to move up the energy ladder (in terms of quality, convenience to use and cost), from biomass to paraffin and then to LPG or electricity with increasing disposable income and changes in lifestyles. Technological advances associated with end-use devices can be added to this, resulting in the tendency of efficiency of energy use to improve with an increase in income (Reddy, 2003).
There is a positive relationship between income per capita growth and demand for commercial fuel in households, and commercial demand for fuels has even grown faster than per capita incomes in many developing nations since 1970 (Reddy, 2004). The use of traditional fuels in many cities in developing countries nonetheless remains high, especially in the dwellings of low-income groups. A related trend is a decline in the share of energy used for basic requirements, such as cooking and lighting, as incomes increase, while energy consumption for space-heating, water-heating, refrigeration, audio/video appliances, air-conditioning and other modern uses grows (Reddy, 2003). Households headed by manual workers use more biofuels than those led by non-manual workers (lower-level employees), while executives and middle-level employees generally use modern forms of fuels. There is an association between occupation and energy use, with attaining higher employment status tending to lead to the use of modern energy carriers or forms (Reddy & Reddy, 1994). The energy ladder model, however, focused mainly on income to explain variables. On this basis, the model suggested that consumers move from one fuel to another in a linear trend upward, and this has been criticised in many studies. A study in Maun, Botswana, for example, indicated that the energy ladder model is not necessarily followed as most households used fuelwood for other reasons than income position (Hiemstra-van der Horst & Hovorka, 2008); regardless of income level, fuel-wood was burnt in almost every household. An increase in income could even lead to growth in the traditional fuel demand (Kebede et al., 2002). The assumption of the energy ladder, that income dictates the switch from one fuel to another, such that households abandon one completely when ascending the ladder, is not necessarily the case, as the multiple fuel use approach suggests.
2.2 Multiple fuel use
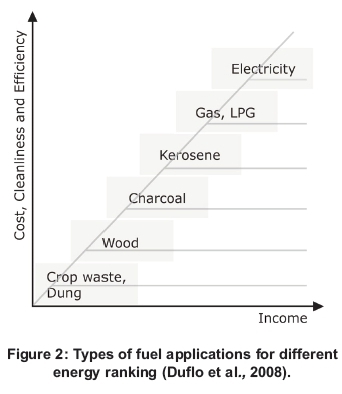
The theory expounded in this approach, as a correction and alternative to the energy ladder, suggests that, in most households, particularly in developing countries, fuel substitution and transition do not apply; rather, a variety of fuels is employed, potentially and together included at all levels of the energy ladder. Fuels are not totally switched in rural households, but a multiple fuel stacking is followed, whereby new fuels and technologies for cooking are added and even the most traditional systems are not entirely displaced or abandoned (Hoffman et al., 2015). Figure 2 shows how, when there is an increase in the level of income and households move up the ladder, lower-level fuels are still kept and used simultaneously, forming part of the energy mix. Choice on fuel used is specifically influenced by a particular cultural norm (Masera et al., 2000). Masera et al. observed that, in rural Mexican areas, gas is not preferred in the cooking of tortillas due to taste and inefficacy; instead, traditionally made stoves and fuelwood are used to cook five times more tortillas at once and with a better taste. Fuelwood therefore still plays a vital role in most cooking and heating, resulting in multiple fuel use, even in households that have been using LPG for many years. In a further example, in India's Haryana rural village, Joon et al. (2009) found households that had been using LPG for years still reliant on fuelwood and agricultural waste as the main energy source for cooking for cost reasons. Comparable studies were made by the programme for the promotion of household and alternative energy sources in the Sahel (2009). The practice of fuel stacking was interpreted mainly in the energy ladder tradition, with factors that focus on consumer constraints instead of concentrating on their preferences. Access and the availability of fuel have been observed as amongst the driving forces in Zimbabwe (Campbell et al. 2003).
Household choice of fuel is not determined by economic factors alone; rather, numerous socio-demographic factors also play significant roles, including gender and educational level of the household head (Farsi et al., 2007). Added to this are cultural and taste preferences considered by households in their choice of fuel, in most developing countries (Arthur et al., 2012). In place of a simple energy ladder, Treiber (2012) showed that the use of multiple fuels is practised by households that are moving up and down the ladder, depending on economic options. Socio-economic factors are not alone in determining fuel transitions. Households act rationally, and cultural and social aspects play a vital role (Nlom and Karimov, 2015). The more consumers move up the energy ladder, the more important the relationship between the fuel and its cost. The widespread practice of multiple fuel use is less about a straightforward transition to cleaner energy than choice, preference, accessibility and preference. There is a need to first understand the forces affecting households in their choice of a particular energy before fully understanding shifts in fuel use (Zaku et al., 2015).
3. Study area and methods
3.1 Study area
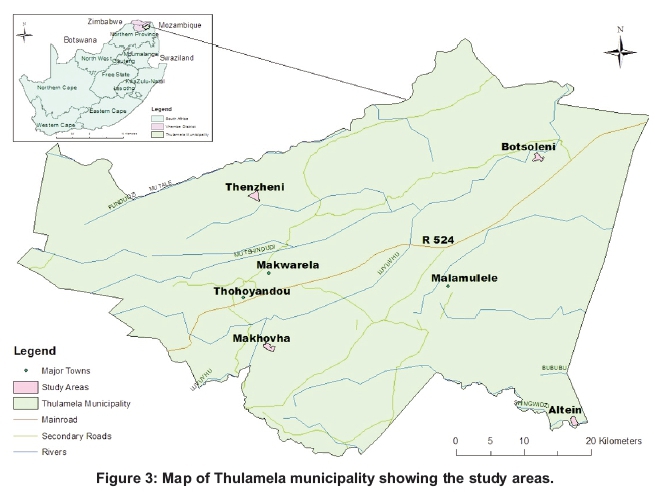
The Thulamela local municipality is located at the eastern tip of the Vhembe district, Limpopo province, South Africa, approximately between longitudes 22° 45' 24.24"S and latitudes 30° 35' 53.36"E. Figure 3 shows the study areas. Thulamela is home to about 47.7% of the population of the Vhembe district: and has a total population of about 618 462, 54.9% of them female and 45.1% male, almost all of them Venda and Tsonga (Statistics South Africa, 2011). Thulamela is labelled a 'category B' local municipality because it is characterised by few towns, with communal land tenure and a village system. The scattered dwelling groups are typical of the former 'homelands and have about 90% of its population living in tribal or rural areas (Statistics South Africa, 2011). The settlements have unequal access to basic amenities and unequal distribution of land resources; inadequate infrastructure; high unemployment rates; and few job opportunities. Low quality of life is associated with most households' dependence on pensions, government grants, and remittances from family members who migrate to urban centres to work. Household wealth is lower than in other municipalities in South Africa (Aaron and Muelbauer, 2006).
3.2 Methods
3.2.1 Research design and sampling
The study was designed to utilise both qualitative and quantitative methods of data collection and analysis and adopted a case study approach. A total of 200 questionnaires, with closed and open-ended questions, were used to gather information. They were administered systematically to every fifth household in the four study areas, namely, Altein, Thenzheni, Makovha and Botsoleni, and in instances where there were no respondents or households were unwilling to participate, another household was randomly selected for replacement.
The main targets were the household heads, and most of the respondents were females, because the males asked the female to answer the questions as being mostly and directly involved in domestic chores. The questionnaires elicited data on demographic fuelwood use, accessibility, and overall energy choice and mix. Villages were divided into two strata as units of analysis, using the total number of households in the villages. The first stratum was composed of villages of 1-500 households, and the second stratum had 500 and above house-holds. The two villages with the highest number of households were selected from the first stratum and two villages with the lowest number of households were selected from the second stratum. These four villages were evenly spread geographically across Thulamela. The following parameters were used: electrification, forest cover, and ecological environment under threat of fuelwood harvesting. Each parameter considered from the sample size was accurately represented in the unit of analysis.
4. Results and discussion
4.1 Educational level
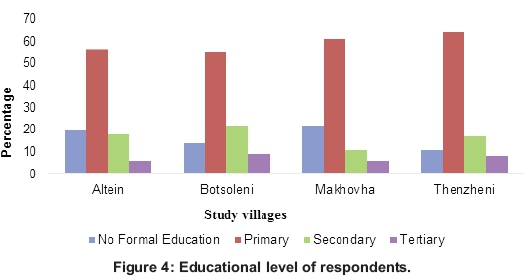
Figure 4 shows that the educational level of respondents in the four case study villages was generally low, with, for example, between 11% and 22% of respondents having no formal education. The survey found that the respondents were likely to have a different attitude towards the type of energy use based on their level of education. Those with a high level of education were likely to be associated with a positive attitude towards conserving the environment by using a cleaner form of energy. Even educated people in this study, however, harvested and purchased fuelwood to supplement electricity for domestic use. Statistical analysis from the study was used for determining any existing relationships between the level of education and the occupation of the respondents. The Chi square results indicate the value (X2 = 36.686, df = 6, p<0.000) and shows that there is a significant relationship between the level of education and occupation, while the Cramer's V symmetrical measure (0.303, p< 0.000) indicates a moderate association between the variables. From the results, it is clear that the use of fuel is highly influenced by the educational level and occupation of the respondents. (Detailed results are uploaded in the supplementary file under Table 1.)
4.2 Employment status
The employment status of a society is a critical measure of the economy, and also relevant to energy use. The employment status of the survey's respondents was crucial, showing the ease or difficulty with which households' could access resources. Figure 5 shows the percentage of the respondents' employment status.
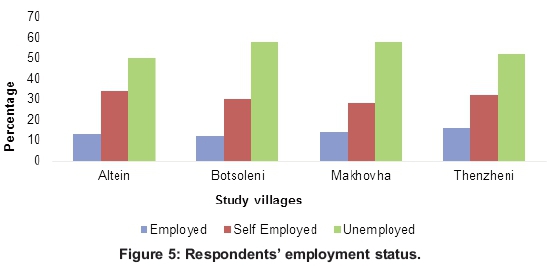
Overall, the level of unemployment exceeded the levels of the self-employed and employed. This high rate of unemployment within the community implied a threat to the environment in terms of fuel- wood reliance, with some of the employed respondents also reporting that they harvest fuelwood as part of their energy mix. This points to a tendency of environmental deterioration in such a society. Communal forests are open for everyone to use, so people will harvest resources without much hindrance. This study found that a high unemployment rate has an implicit effect on the environment, as most of the unemployed spend much of their time harvesting fuelwood. The Chi square value (X2 = 104.457, df = 8, p<0.000) indicates that there is a significant relationship between occupation and monthly income, while the Cramer's V symmetrical measure (0.511, p<0.000) indicates a moderate association between the variables. (Detailed results are uploaded in the supplementary file under Table 2.)
Unemployed respondents depend on income from pensions, government grants and remittance from family members working in urban centres. The self-employed women are engaged in selling vegetables, fruits and other types of food in the village. Self-employed males are artisans who depend on their handiwork to earn an income. The results correlate to energy use in their households. The employed and self-employed moderately rely on modern energy, while those in the unemployed category rely mainly on traditional sources of energy. One respondent said: 'Electricity coupons are expensive for me. Presently, I am not working. I depend on a government grant. It is, therefore, relatively better, cheaper and easier for me to cook my food and boil water using firewood.' Employment and the level of monthly income have an effect in determining the type of energy source that a household uses. The energy ladder model used in previous studies indicated that as the income of the household increases, a transition of energy use will occur and the energy required by households will change to more advanced energy sources, such as electricity (Pachauri, 2004).
4.3 Household income
Figure 6 shows the monthly incomes of households in the study areas. It shows that most respondents earn less than R3500, with the majority earning less than R1500.
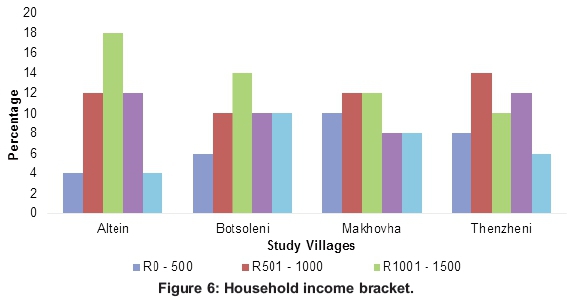
The survey revealed that people with low incomes spent much time harvesting fuelwood in order to meet their domestic energy needs. The sales of fuelwood were not found to be lucrative, as a bundle of dry wood sold at R15-R25. Low-income earners would continually harvest fuel-wood, reserving the little electricity they have for lighting. The Chi square value (X2 = 35.434, df = 12, p> 0.000), shows that income earned and energy type are significantly related, while the Cramer's V symmetrical measure (0.140, p> 0.000) indicates a weak association between income and energy. (Detailed results are uploaded in the supplementary file under Table 3.)
Those in the <R500 bracket rely mostly on traditional sources, and shifts to modern fuels go with rising incomes. Household patterns of energy consumption normally represent the status and welfare as well as the stage of economic development (Pachauri 2004). Generally, as the economy develops, more and cleaner energy is consumed. The household energy consumption pattern is expected to increase in the future in line with growth in the economy and a rise in per capita incomes. It is also projected that increases in household energy consumption result from changes in lifestyles. Household income influences energy consumption pattern in many ways. Firstly, a rise in income level raises energy consumption increases due to an increase in dishes prepared, such that supplementary items like vegetables, milk, meat and other food items are added to the food grains and more energy is required to cook the additional food. Secondly, with increasing incomes, the price of fuel will be less of a constraint for the households (Laitner, 2000). Employment, and associated income, help determine a household's energy preferences. This study found that unemployment pushed the community members towards the use of freely accessible energy sources such as fuelwood.
4.4 Energy mix of the communities
This section presents the available energy sources and its uses in the studied communities. The results show that all respondents had access to electricity, but many households that were poor did not have electrification. They mainly used electricity for lighting purposes since there was no benefit accrued to them from the subsidy for national energy poverty through the free basic electricity grant (DoE, 2014). Thus fuelwood played a major part of their energy mix, mainly for cooking and heating water.
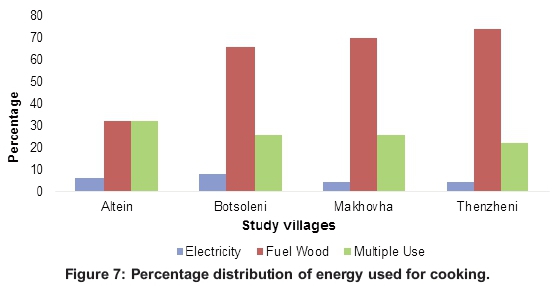
4.4.1 Cooking
Figure 7 shows the used of electricity and fuelwood in the studied villages, revealing that respondents used fuelwood as their main source of energy for cooking. This dependence, according to the respondents, is because cooking requires a lot energy and fuelwood is much cheaper than electricity. The Chi square value (X2 = 2.550, df =6, p> 0.863). It shows that villages and energy cooking source were not significantly related, while Cramer's V symmetrical measure (0.113, p> 0.863) indicated a weak association between income and the village. (Detailed results are uploaded in the supplementary file under Table 4.)
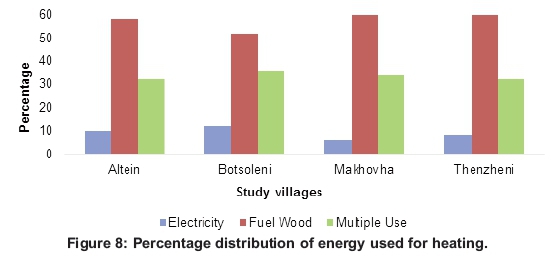
4.4.2 Water-heating
Water-heating also requires extensive use of energy. Figure 8 shows the extent to which the four case study villages heat their water using electricity and fuel wood.
4.5 Household size and energy sources
Household size is amongst the factors that influence household choice of energy. The findings show that the average household size was five and that larger households required more energy to meet their needs than smaller households and their predominant energy source was fuelwood. One respondent said: 'My family is relatively large and with the prevailing economic situation, it is far cheaper for me to use firewood instead of electricity for my domestic energy needs. We are eight in the house and when we need to cook or take a bath, a lot of energy is needed. So for us, firewood is the cheapest and preferable because we don't buy it. We harvest it from the forest. Also, food prepared with firewood tastes better than that cooked with electricity.'
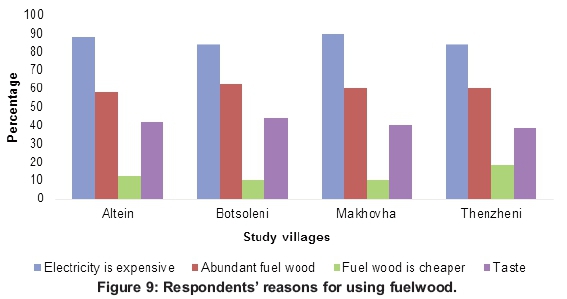
4.6 Energy use and perceptions
The preferences of the respondents for different energy sources were established, and are shown in Figure 9 (taste refers to the perception that food tastes better when cooked with fuelwood).
4.7 Acessibility and energy sources
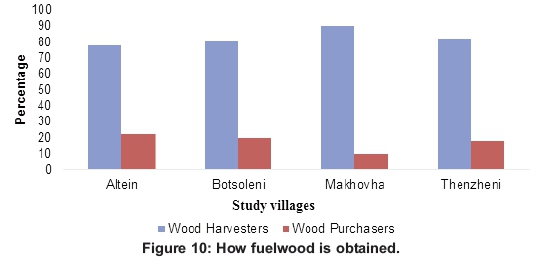
The communities have access to fuelwood in two ways: it must be either harvested or purchased. Figure 10 shows that the majority of the fuelwood consumers in the case study villages harvest fuel-wood, leaving very few respondents who purchase the resources. Most of the community members are unemployed and have access to the forest; the few that purchased fuelwood were those that were employed and, often, did not have time to go into the forests for harvesting.
Tropical Africa depends on fuelwood for about 90% of its total energy needs because it is still far cheaper than most alternative available fuels. However, even if the price of fuelwood were to increase, demand would not drastically reduce, due to the unavailability of substitutes (Boahene, 2008). From the survey and Census data for 2011, there is 100% electrification in the four communities of Altein, Botsoleni, Makovha and Thenzheni. Households in these communities have access to the national electricity grid. When electricity coupons are purchased, they will include free units granted to them. In spite of this, fuelwood is still a preferred energy source, given the expense of cooking and water-heating and their access to the forest to harvest fuelwood. The chiefs that were interviewed indicated that they issue permits for collecting fuelwood because some trees are regarded as endangered, but many respondents do not consult the chiefs before going into the forest, as they consider the forest a natural resource for all, entitling them to harvest fuel wood at will.
4.8 Energy preferences
There are various reasons why households choose a specific energy source, including the efficacy of the sources for them in relation to time, food-taste, availability and accessibility, and general preference - given that consumers have preferences or beliefs about a product that determine whether they will purchase it or not (Joon et al., 2009). Most rural people prefer cooking with fuelwood because they believe that food prepared on a fire is tastier than food cooked using electricity. Some households prefer fuelwood because they believe that it is faster, and therefore less time is spent on cooking than when using electricity. Most respond to the ready availability of fuelwood and the possibility of gathering it at no cost (Arthur et al., 2012).
5. Conclusions and recommendations
The study confirms that income earned by people plays a major role in determining the type of energy use. Among the types of energy available to the Altein, Botsoleni, Makovha and Thenzehni communities, electricity and fuelwood are paramount, but they mostly use fuelwood, despite having access to electricity. The use of fuelwood in relation to electricity is influenced by a number of socio-economic factors, including household income, level of education, occupation, household size, employment, accessibility, location and cooking preferences. Community members that are employed or self-employed use electricity more often in their households, though some also use fuelwood. Unemployed community members are the main users of fuelwood, given that it is freely available. Although grid electricity is available in Thulamela, there is a need to encourage the community to use alternative energy sources, especially renewable energy.
There are a few households in the study villages that rear domestic animals and they should be encouraged and trained to use the dung for energy production through biogas technology. Solar energy remains the best option, however, because the area lies at the lower latitudes within the tropics and has an average short wave radiation relatively higher than other parts of the country. Because of poverty, however, government assistance, to subsidise purchase, installation and maintenance of technologies, would be necessary to realise the advantages of harnessing solar power and biogas for cheaper and cleaner energy. Creating employment would empower the people, and a realistic subsidy option can be followed, which will not be more of a burden. The use of renewable energy will change people's lives, especially those of the women and children who must walk long distances in search of fuel wood. Saved time and money could be channelled into productive activities and education.
Acknowledgements
The author's acknowledges with thanks financial support from the research and publications committee of the University of Venda and the Eskom atmospheric emissions control project.
References
Aaron, J. and Muellbauer, J. 2006. Estimates of house hold sector wealth for South Africa, 1970-2003. Review of Income and Wealth 52 (2): 285-308. [ Links ]
Arthur, M., Bond, C.A. and Willson, B. 2012. Estimation of elasticities for domestic energy demand in Mozambique. Energy Economics 34 (2): 398-409. [ Links ]
Boahene, A. 2008. The challenge of deforestation in tropical Africa: Reflections on its principal causes, consequences and solutions. Land Degradation and Development, 9: 247-258. [ Links ]
Campbell, B.M., Vermeulen, S. J., Mangono, J.J. and Mabugu, R. 2003. The energy transition in action: urban domestic fuel choices in changing Zimbabwe. Energy Policy, 31 (6): 553-562. [ Links ]
Davis, M. 1998. Rural household energy consumption: The effects of access to electricity evidence from South Africa. Energy Policy, 26: 207-217. [ Links ]
Department of Energy (DoE). 2012. A survey of energy- related behaviour and perceptions in South Africa, The residential sector. Pretoria. Available at: http://www.energy.gov.za/files/media/Pub/Survey%20of%20Energy%20related% 20behaviour%20and%20perception%20in%20SA%20-%20Residential%20Sector%20-%202012.pdf (Accessed November 2015). [ Links ]
Duflo, E., Greenstone, M. and Hanna, R. 2008. Indoor air pollution, health and economic well-being. SAPIENS 1, 1-9. [ Links ]
Farsi, M., Filippini, M. and Pachauri, S. 2007. Fuel choices in urban Indian households. Environment and Development Economics, 12: 757-774. [ Links ]
Hiemstra-van der Horst G and Hovorka, A. 2008. Reassessing the 'energy ladder': Household energy use in Maun, Botswana. Energy Policy, 36 (9): 3333-3344. [ Links ]
Hoffman, H., Uckert, G., Reif, C., Muller, K. and Sieber, S. 2015. Traditional biomass energy consumption and the potential introduction of firewood efficient stoves: Insight from western Tanzania. Regional Environmental Change. 15 (7) 1191-1201. [ Links ]
Joon, V., Chandra, A. and Bhattacharya, M. 2009. Household energy consumption pattern and socio-cultural dimensions associated with it: A case study of rural Haryana, India. Biomass and Bioenergy 33 (11): 1509-1512. [ Links ]
Kebede, B., Bekele, A., Kedir, E. 2002. Can the urban poor afford modern energy? The case for Ethiopia. Energy Policy 30 (11/12): 1029-1045. [ Links ]
Kituyi, E., Marufu, L., Huber, B., Wandiga, S.O., Jumba, O.I., Andreae, M.O. and Helas, G. 2001. Biofuels consumption rates in Kenya. Biomass and Bioenergy, 20: 83-99. [ Links ]
Laitner, J.A. 2000. Energy efficiency: Rebounding to a sound perspective. Energy Policy, 28: 6-7. [ Links ]
Madubansi, M. and Shackleton, C.M. 2006. Changing energy profiles and consumption patterns following electrification in five rural villages, South Africa. Energy Policy 34: 4081-4092. [ Links ]
Masekoameng, K.E., Simalenga, T.E. and Saidi, T. 2005. Household energy needs and utilisation patterns in the Giyani rural communities of Limpopo Province, South Africa. Journal of Energy in Southern Africa, 16: 3. [ Links ]
Masera, O.R., Saatkamp, B.D. and Kammen, D. M. 2000. From linear fuel switching to multiple cooking strategies: A critique and alternative to the energy ladder model. World Development, 28 (12) 2083-2103. [ Links ]
Nlom, J.H. and Karimov, A. 2015. Modeling Fuel Choice among households in northern Cameroon. Sustainability 7: 9989-9999. [ Links ]
Pachauri, S. 2004. An analysis of cross sectional variations in total household energy requirements in India using micro survey data. Energy Policy 18: 256-266. [ Links ]
PREDAS [Programme for the promotion of household and alternative energy sources in the Sahel]. 2009. Women and household energy in Sahelian Countries, Boiling Point 56, 21-32. [ Links ]
Reddy, A. K. N. and Reddy, S. B. 1994. Substitution of energy carriers for cooking in Bangalore. The International Journal of Energy 19 (5) 561-572. [ Links ]
Reddy, B.S. 2004. Economic and social dimensions of household energy use: A case study of India. In Ortega, E. and Ulgiati, S. (Ed). Proceedings of IV biennial international workshop advances in energy studies. Unicamps, Campinas, SP Brazil, 469-477. [ Links ]
Reddy, B.S. 2003. Overcoming the energy efficiency gap in India's residential sector, Energy Policy 31 (11), 1117-1127. [ Links ]
Sepp, S. 2014. Multiple household fuel use: A balanced choice between firewood, charcoal and LPG. Frankfurt: GIZ. [ Links ]
Statistics South Africa, 2015. General household survey 2014. Report number P0318. [ Links ]
Statistics South Africa 2011.Census: Concepts and Definitions. Report number 03-02-26. [ Links ]
Thom, C. 2000. Use of grid electricity by rural house-holds in South Africa. Energy for Sustainable Development, 4 (4): 36-43. [ Links ]
Treiber, M. 2012. Fuel and stove diversification in the light of energy transition and technology adoption theory. Norwegian University of Life Sciences. Ás, Norway. [ Links ]
Van der Kroon, B. and Brouwer, R., Van Beukering, PJ. 2013. The energy ladder: Theoretical myth or empirical truth? Results from a meta-analysis. Renewable and Sustainable Energy Reviews 20, 504-513. [ Links ]
Williams, A. and Shackleton, C.M. 2002. Fuel wood use in South Africa: Where to in the 21st century? Southern Africa Forestry Journal, 196: 1-7. [ Links ]
Zaku, S. G., Abdallah, A., Olayande, J.S., Kabir, A. and Tukur, A. 2015. Comparative studies of household energy use in Nigeria: A case of Gwagwalada and Gwako in Gwagwalada Area Council of Abuja FCT. Swift Journal of Economics and International Finance, 1, 005-009. [ Links ]
* Corresponding author: Tel: +27 (0) 73 104 1522; Email: uhunamuresolomon@hotmail.com

