


Services on Demand
Article
 English (pdf)
 Article in xml format
 Article references
Indicators

Related links
-
 Cited by Google
 -
 Similars in Google
Share

 Permalink
Journal of Energy in Southern Africa
On-line version ISSN 2413-3051
Print version ISSN 1021-447X
J. energy South. Afr. vol.27 n.4 Cape Town Nov. 2016
http://dx.doi.org/10.17159/2413-3051/2016/v27i4a1497
ARTICLES
Investigation of an octagon-shaped chimney solar power plant
L.W. BenekeI, *; C.J.S. FourieII; Z. HuanI
IDepartment of Mechanical Engineering, Mechatronics and Industrial Design, Tshwane University of Technology, Private Bag X680, Pretoria, 0001, South Africa
IIPangagea Geophysics and Geodesy Working Group, Pretoria, 0001, South Africa
ABSTRACT
South Africa has limited reserve electricity resources and many parts of the country have limited access to electricity, while electricity production capacity is at maximum and almost every gigawatt is accounted for. The energy crisis has highlighted the need to increase electricity generation capacity and to search for alternative energy sources. This study focuses on the solar chimney concept, which harnesses both solar and wind energy to generate electricity, especially in the sunny Northern Cape Province and Karoo regions of South Africa. The concept is an alternative design focusing on very low wind power, where an effective cone solar frustum power plant is able to generate sufficient wind flow to turn a turbine and produce electricity. The study focused on different chimney designs (cylindrical and octagon shapes) to evaluate the best performance. Simulations were performed to find the optimum design configuration to focus the research. The simulations evaluated the shape of the tower, tower base, heat transfer surface areas and efficiencies of the system. The results showed that the octagonal chimney outperformed the normal cylindrical one, mainly due to an increased airflow and the turbine being positioned at the outlet of the chimney (whereas it is at the bottom of a cylindrical chimney). The addition of mirrors increased the performance due to solar radiation from all the directions around the chimney. The results were confirmed by a pilot plant that was operated continuously for 24 months.
Keywords: energy, electricity, solar chimney, cylindrical shape, octagon shape, numerical modelling
Symbols
ANSYS Analysis system
FG Indicator for occurrence of fog
Mt Million metric tonnes
P Pressure, Pa
Q Flow rate, m3/s
RA Indicator for occurrence of rain or drizzle
SLP Mean sea level air pressure, hPa
SN Indicator for occurrence of snow or ice pellets
T Temperature, K
TM Maximum temperature, °C
Tm Minimum temperature, °C
TS Indicator for occurrence of thunder
VE Mean wind speed, km/h
V Velocity, m/s
VG Maximum wind gust, km/h
VM Maximum sustained wind speed, km/h
VV Mean visibility, km
WS Steady flow energy, W
∆P Available pressure difference, Pa
Greek symbols
ρ Density, kg/m3
η Efficiency, %
y Specific heat ratio
1. Introduction
South Africa generates 93% of its electricity in coal-fired power stations, with the remaining 7% from the smaller hydropower and Koeberg nuclear stations (Eskom, 2012). The state-controlled utility Eskom is the main customer of the coal mined in the country, being supplied with about 111 Mt in 2007 (Ikaneng, 2008). Secure electricity supply continues to be a significant factor in the economic growth of South Africa. Eskom is under pressure to ensure that it fulfils its mandate to supply the country with adequate electricity, the situation exacerbated by the planned power outages from late 2008 until January 2009 and repeated in late 2014. This situation is compounded by incomplete electricity supply in the country. In an attempt to remedy the situation, Eskom is building the Medupi coal-fired power station, alongside its sister unit Matimba, in Limpopo province (Department of Environmental Affairs, State of the Environment, 2011). Eskom opted for the traditional coal-fired generation option rather than an alternative solution.
The use of wind power for generating electricity has been constantly and rapidly increasing over the last few decades, and according to all predictions and goals set by international authorities, this trend is likely to continue (Sawyer, 2016). Further increases of wind power exploitation require the production of larger wind turbines with higher unit power output (Jelavic et al., 2008; Tadzhiev et al., 2009).
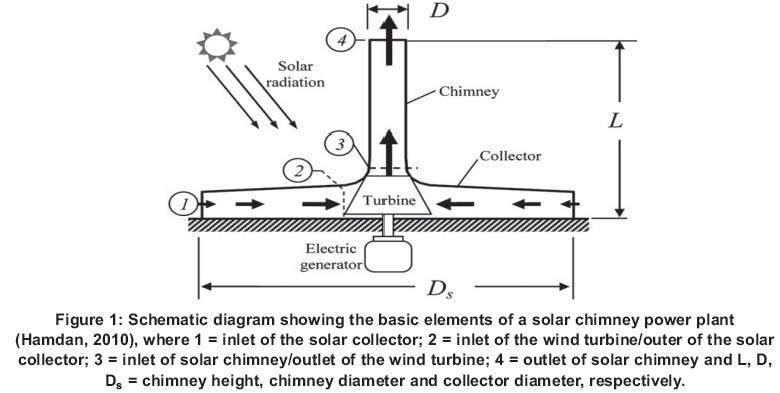
The concept of the first solar chimney power technology was based on the principle that, in the collector, solar radiation is used to heat an absorber (ordinarily soil or water bags) on the ground (Dhahri & Omri, 2013). This absorber heats a large body of air that rises up through the chimney due to the density difference of the air between the chimney base and chimney top; and creates a draft, or 'artificially created wind', through the chimney, which, in turn, drives turbines that generate electricity. A solar chimney power plant in Manzares, Spain (Lorenzo, 2002) was observed to produce an upward wind velocity inside the chimney of 15 m/s under no-load conditions. The largest power output reached by the plant was 50 kW from July to September in 1982 (Zhou et al., 2007). A schematic diagram of a solar chimney power plant is presented in Figure 1. It is a simplified model used to describe the power plant and includes the three major components: solar collector, chimney and wind turbine.
2. Numerical modelling and investigation of the octagonal solar chimney system
The investigation on the octagonal chimney was based on two different but complementary approaches:
(a) Numerical modelling was performed to evaluate the design and to investigate the different parameters that could influence the performance of the chimney power plant. Modelling was performed for summer and winter conditions in Pretoria, South Africa.
(b) An experimental pilot plant was constructed in Pretoria to evaluate the numerical simulations and to compare theory and practice over a period of 18 months.
2.1 Numerical modelling
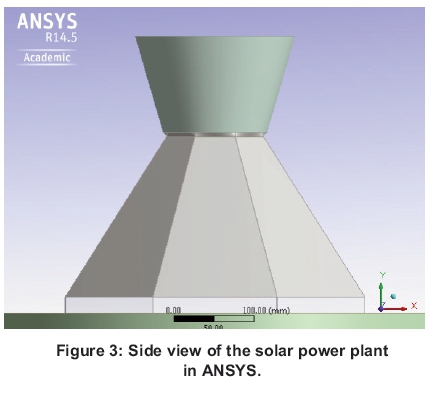
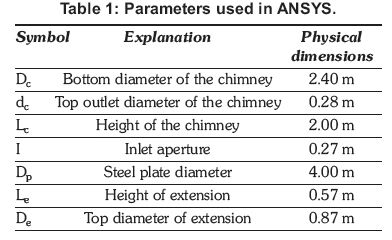
The numerical modelling of the performance of the solar chimney was performed in ANSYS Fluent software. The design of the solar chimney is transferred into the ANSYS software (Figure 2) to model the air flow, heat flow and thermodynamic properties of the system in three dimensions (Figure 3). The model parameters and dimensions used for the numerical modelling and for the construction of the pilot experimental plant are given in Table 1. The complete model was constructed from individual sections or parts.
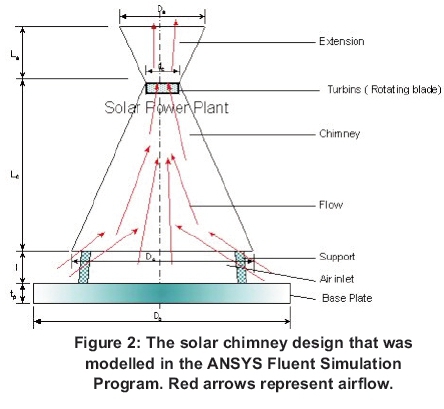
The base plate is placed under the chimney to give it a firm fixed base to stand on. It absorbs a little heat and radiation from the sun, and although it was not meant to act as a solar collector did collect a tiny amount of energy to drive the heat flow through the chimney. The material used to construct the base plate was 3 mm mild steel sheets, 5 m in diameter, with a matt black finish.
The inlet aperture plays an important role in sustaining the flow of air through the chimney and regulates the air flow into the solar plant. The chimney was constructed 270 mm above the base plate on eight small steel legs, which were welded onto the base plate and the bottom section of the solar chimney. The steel legs were 20 mm square steel tubing and their influence on the airflow and the inlet aperture surface area is assumed to be negligible. The surface area of the inlet aperture around the base of the solar chimney is 2.04 m2. The ratio between the top outlet chimney and the inlet aperture of the chimney is 1:8. The ratio between the area of the base plate and the area of the inlet aperture is 12:1.
The chimney is in the shape of an eight-sided cone and is manufactured from a 20 mm square steel tubing structure covered by 2 mm thick steel sheeting. The chimney is painted black to provide efficient solar radiation and heat absorption of the sun during the day. The height of the chimney in this design is 2 m, without the extension. Each section of the octagon that comprises the chimney is 0.86 m at the bottom and 0.11 m at the top. The slanted length of each section is 2.96 m. The total outside surface area of the chimney is 7.76 m2. The efficiency of the chimney (conversion of heat into kinetic energy) is practically independent of ΔΤ at the base plate. It depends solely on the difference between the ambient and air column temperature in the chimney. Higher chimneys are more efficient.
The turbine is mounted in the centre close to the outlet of the chimney. The rising hot incoming air through the inlet aperture turns the turbine. Since the solar chimney pilot plant is very small, a suitable turbine was chosen (2 W). The reason for this decision was that literature suggests that the overall efficiency of solar updraft plants varies from 1-2%. Since the maximum solar radiation energy on the chimney is only 992.22 W, 1% is only 10 W. However this efficiency is with a solar collector and in this case it is absent.
The chimney cone outlet extension covers the turbine. It is constructed of 1 mm mild steel sheeting with a matt black finish. The purpose of the extension is to reduce outlet turbulence of the air. The top outlet diameter of the extension is 870 mm and the height of the extension is 570 mm.
2.2 Equations used in the simulations
The pressure difference (ΔΡ) between the inside of the chimney and the outside is the driving force for the so-called 'stack effect', and it can be calculated with Equation 1. The symbol h is the height of the chimney and is the distance from the opening at the neutral pressure level of the chimney to the topmost opening.
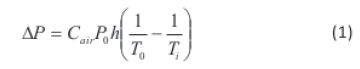
Where Δ Ρ is the available pressure difference, in Pa, is the heat capacity of air given as 0.0342, Po is the atmospheric pressure, in Pa, h is the height, in m, To is the absolute outside temperature, and Ti is the absolute inside temperature in Kelvin.
The draft flow rate induced by the stack effect can be calculated with Equation 2.
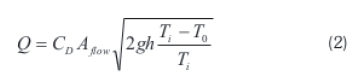
Where Q is the flow rate, in m3/s,CD is the discharge coefficient (usually taken to be from 0.65 to 0.70), Aflow,is the flow area, in m2 and g is the gravity acceleration given as 9.SI m/s2
The energy equation used is the compressible Euler equation (Equation 3), which represents conservation of mass, momentum and energy. Mass density, flow velocity and pressure are the so-called physical variables, while mass density, momentum density and total energy density are the so-called conserved variables.
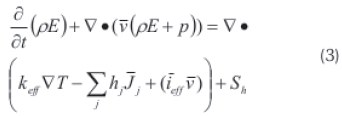
The first three terms on the right-hand side represent energy transfer due to conduction, species diffusion and viscous dissipation. The last term represents other volumetric beat sources that could be identified. The terms on the left-hand side represent pressure work, kinetic energy and radiations source terms. Where ∆ is the density of the medium, in kg'm-3 Ε is the energy, in J/kg ▽ is the 'del operator',  is the velocity vector, keff is the effective conductivity, Τ is thejemperature, in Κ h. is the incremental enthalpy,
  . is the incremental diffusion flux, icg is the effective stress tensor, and Sh is the other heat sources, in Kelvin.
The energy equation used in for solid regions and energy transport is given as Equation 4. The first term on the left-hand side deals with the enthalpy, while the second term deals with the corrective energy due to rotation and translation in solids. The velocity vector λ is computed from the motion specified for the solid zone.The terms on the right-hand side of Equation 4 represent the heat flux due to isotropic conduction and heat sources within the solid.
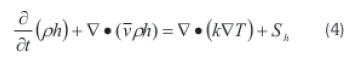
Where h is the enthalpy, in J/kg, and k is the isotropic conductivity.
The next equations that are an integral section of the numerical modelling of the solar chimney are the momentum conservation equations, which model the conservation of momentum in an inertial, non-accelerating reference frame according to Equation 5.
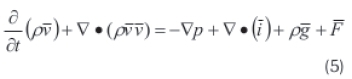
Where ρ is the pressure, in Pa,  is the stress tensor, in Pa, and
  is the other sources.
The flow of air in the chimney is turbulent. Reynolds-averaged Navier-Stokes equations (or RANS equations) are time-averaged equations of motion for fluid flow, whereby an instantaneous quantity is decomposed into its time-averaged and fluctuating quantities (ANSYS, 2009). These equations can be used with approximations based on knowledge of the properties of flow turbulence in the chimney to give approximate time-averaged mean ensemble -averaged or time averaged components. This is done for the different velocity and pressure components and is given by Equations 6 and 7.
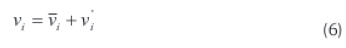
Where tne first term on the right-hand side is the average velocity and tbe second term is the variation form the average. Likewise for the pressure:
These equations for the flow variables are then substituted into the transport equations for the standard k-γ model.
Two turbulence models in tbe ANSYS software allow for the determination of a turbulent length and time by solving two separate transport equations. The standard k-y model used in ANSYS was proposed by Launder and Spalding in 1974, and is used as the major approach in solving turbulent flow characteristics.
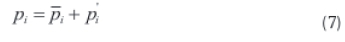
The turbulence kinetic energy k and the rate of dissipation γ are obtained from Equations 8 and 9:
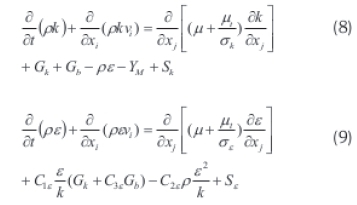
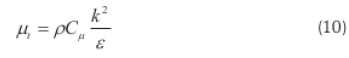
In these equations Gk represents the generation of turbulent kinetic energy due to the mean velocity gradients. The Gb is the generation of turbulent kinetic energy due to buoyancy. Tbe Ym represents tbe contribution of the fluctuating dilation in compressible turbulence of time. The following are the model constants witb tbe default values determined through experimentation: Ciy = 1.44, C2y = 1.92, Car = 0 09, Фk = 1.0 and Φy, = 1.3. The terms S* and Sf are user-defined. The term :: is called the turbulenter Eddy viscosity and is defined by Equation 10:
3. Results from the simulations
Modelling was performed for two different weather and temperature condition cases at Pretoria. The simulations were for the octagonal chimney design.
This is necessary because a full-scale solar updraft plant will operate through the year and different conditions will apply.
3.1 Case 1: Winter day in Pretoria
The first case presented is a typical winter day in Pretoria. The following parameters were used in ANSYS to simulate the following conditions:
• Ambient temperature: 17 °C
• Steel plate temperature: 30 °C
• Pressure (atmospheric): 101.325 kPa
• Wind speed: 0 m/s
• Materials: Steel and atmospheric air
• Air density at 17 °C: D = 1.216534 kg/m3
• Gravitational acceleration
- X axis 0 m/s2
- Y axis -9.81 m/s2
- Z axis 0 m/s2
The results for this simulation in ANSYS are given in Table 2. The simulations were performed by assigning simulation intervals that commenced from the inlet aperture, through the length (height) of the chimney to the top of the extension. The values summarised in Table 2 are the simulation results on the inside of the solar power plant at the centre vertical axis of the chimney. The intervals depicted in the first column focus on three sections within the chimney. Section 1 is from -0.2 m to 0.00 m, and shows the values for the inlet aperture of the power plant. The intervals 0.0 m to 2.0 m classify the chimney and intervals 2.0 m to 3.2 m are the extension. Static air pressure as indicated in the table is the pressure difference obtained against atmospheric pressure. Only the most important parameters will be discussed in detail.
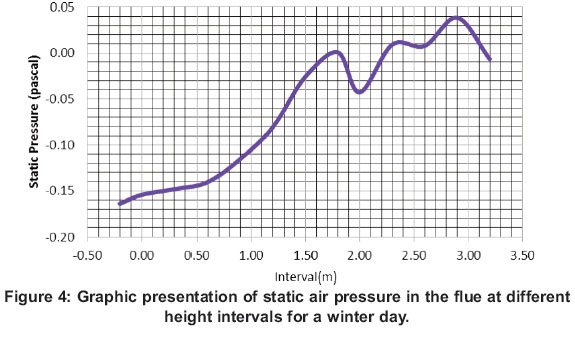
3.1.1 Static air pressure results
Static air pressure is investigated to evaluate the airflow path inside the chimney of the solar power plant. Differences in the static air pressure at height through the chimney create a positive static air pressure and create the updraft; resulting in the movement of air upwards through the chimney of solar power plant from the inlet aperture to turn the turbine mounted at the outlet of the chimney.
Figure 4 shows the actual data association between static air pressures at defined height intervals for a winter's day' within the chimney and indicates that the flue pressure increases with height in the chimney and approaches the ambient value in the extension, and reduces and oscillates close to ambient pressure after leaving the chimney. The graph indicates that the simulation results of static air pressure inside the flue supports the mechanism that controls the flow of air which is called the 'natural draught', 'natural ventilation', 'chimney effect', or 'stack effect'.
3.1.2 Velocity in Y direction (upwards)
The vertical velocity of the air flow inside the flue is created by the rate at which the air flows into the chimney through the inlet aperture at the bottom. The velocity inside the solar power plant is determined by the rate of change of the vertical movement of the air at a specific position inside the chimney. Figure 5 shows the association between vertical air velocities at defined height intervals within the chimney. It indicates that the velocities increases with height in the chimney and approaches a maximum value at the outlet into the extension and decreases very rapidly. It also indicates that the actual simulation result of air velocities inside the flue supports the mechanism that controls the air flow which is called the 'natural draught', 'natural ventilation', 'chimney effect', or 'stack effect'.
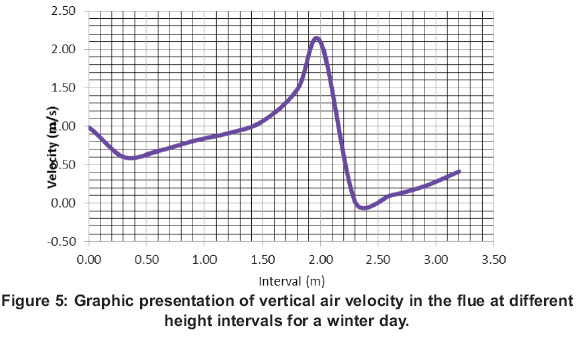
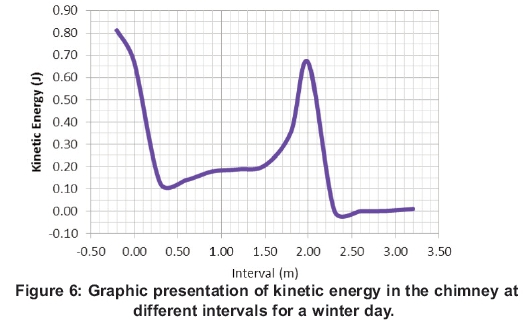
Figure 6 shows the actual steady increase of the kinetic energy of the air from the inlet at 0.3 m to .1.5 m of the chimney. The kinetic energy then increases sharply towards the outlet at 2 m, where the flow area is the smallest. It then sharply decreases as it enters into the atmosphere from the outlet of the chimney. As the air moves upward through the chimney, the pressure increases due to the smaller diameter of the outlet. The moment it passes through the outlet and the pressure decreases, the air accelerates.
3.2 Case 2: Summer day in Pretoria
The second simulation presented here is for a summer day in Pretoria. The following parameters were used in ANSYS to simulate the following conditions:
• Ambient temperature: 38 °C
• Steel plate temperature: 60 °C
• Pressure (atmospheric): 101.325 kPa
• Wind speed: 0 m/s
• Materials: Steel and atmospheric air
• Air density at 38 °C: Δ = 1.134428 kg/m3
• Gravitational acceleration
- X Axis 0 m/s2
- Y Axis - 9.81 m/s2
- Z Axis 0 m/s2
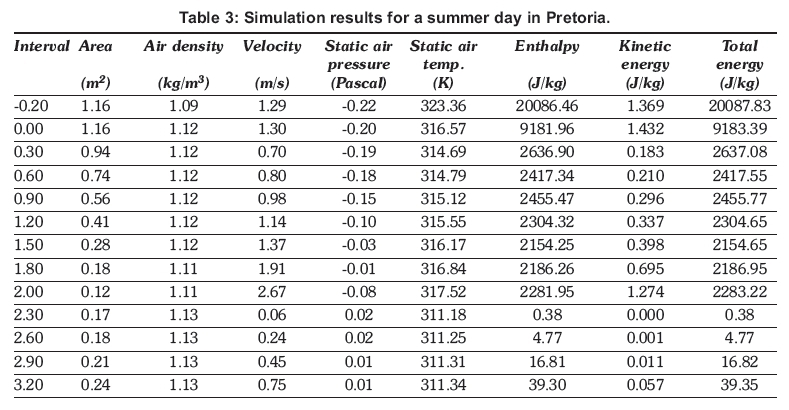
The results for this simulation in ANSYS are given in Table 3. The simulations were performed by assigning simulation intervals that commenced from the inlet aperture, through the length (height) of the chimney till the top of the extension. The values summarised in Table 3 are the simulation results on the inside of the solar power plant at the centre vertical axis of the chimney. The intervals depicted in the first column focus on three sections within the chimney. Section 1 is from -0.2 m to 0.00 m, and shows the values for the inlet aperture of the power plant. The intervals 0.0 m to 2.0 m classify the chimney and intervals 2.0 m to 3.2 m are the extension. The following sections will show the results for all the relevant physical entities which are important for the evaluation of the solar plant. Static air pressure as indicated in the table is the pressure difference obtained against atmospheric pressure.
3.2.1 Static air pressure results
Static air pressure is investigated to evaluate the airflow path inside the chimney of the solar power plant. Differences in the static air pressure at height through the chimney create a positive static pressure and create the updraft, resulting in the movement of air upwards through the chimney of solar power plant from the inlet aperture to turn the turbine mounted at the outlet of the chimney. Figure 7 shows the actual association between static air pressures at defined height intervals within the chimney for a summer day. The figure indicates that the flue pressure increases with height in the chimney and approaches the largest value at the outlet (2 m).
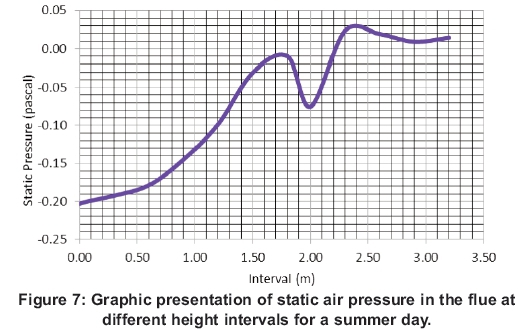
The pressure then lowers towards the ambient value in the extension, and reduces and oscillates close to ambient pressure. Figure 7 also indicates that the simulation result of the static air pressure inside the flue support the mechanism that controls the flow of air which is called the 'natural draught', 'chimney effect', or 'stack effect'.
3.2.2 Velocity in Y direction (upwards)
The vertical velocity of the air flow inside the flue is created by the rate at which the air flows into the chimney of the pilot plant through the inlet aperture at the bottom. The velocity inside the solar power plant is determined by the rate of change of the vertical movement of the air at a specific position inside the chimney. The actual association between vertical air velocities at defined height intervals within the chimney for a summer day is shown in Figure 8. The figure indicates that the air velocity increases with height in the chimney and reaches 2.8 ms-1 at the outlet into the chimney extension and the air velocity decreases very rapidly into the atmosphere. The simulation result of air velocity inside the flue supports the mechanism that controls the air flow, which is called the 'natural draught', 'chimney effect', or 'stack effect'.

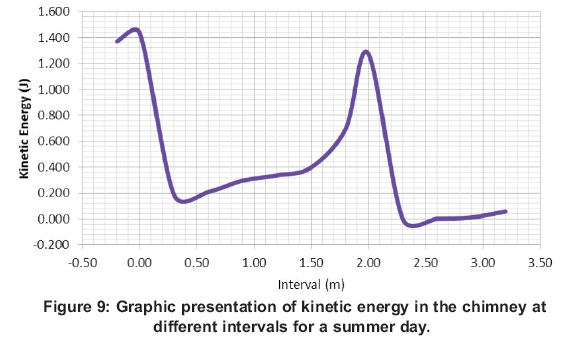
The graph in Figure 9 shows steady increase of the kinetic energy of the air at in the inlet of 0.3 m to 1 m of the chimney. The kinetic energy then increases sharply towards the outlet at 2 m, where the flow area is the smallest. It sharply decreases as it enters the extension and the atmosphere from the outlet of the chimney.
4. Construction and experimental investigation of the octagonal solar chimney system
4.1 Construction of the solar chimney
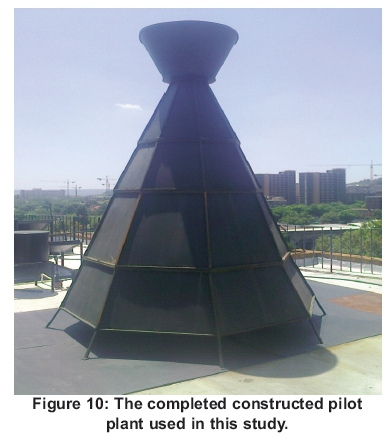
The chimney pilot plant was manufactured in the mechanical workshop at Faculty of Engineering according to the specifications in Table 1 and Figure 2. The material used to construct the pilot plant was mild steel tubing and 2 mm mild steel sheets. All external steel surfaces were painted matt black. The
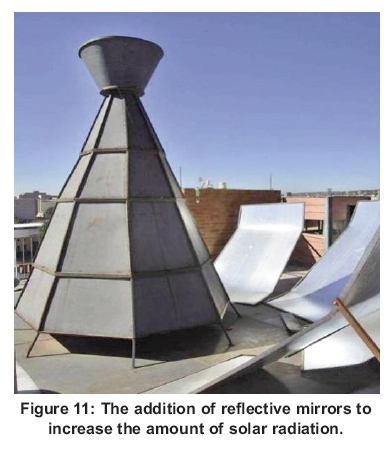
dimensions used for the construction of the pilot plant were identical to what was used in the ANSYS numerical simulation software, to allow direct comparisons between the numerical simulations and the performance of the pilot plant (Figure 10). A small turbine was mounted in the chimney outlet (top) and connected to a logger. In addition, measurements were taken with reflecting mirrors around the chimney to allow for solar radiation all around the chimney and to evaluate the increase in performance (Figure 11).
4.2 Measurement of the power output (performance) of the chimney
The performance of the solar pilot was measured using a data logger. The pilot plant was monitored continuously for one year (to evaluate the performance of the pilot plant through seasonal changes). The data logger took a measurement every 1 second. Every 15 samples (every 15 seconds) were averaged and reported as one value in Excel.
The next section discusses the conditions of some of the different months of the year in Pretoria, and the actual data measured from the pilot plant in Pretoria. The data measured by the data logger was the voltage (V) and the energy in watts (W). The results shown are for the pilot plant, firstly without, and with the reflective mirrors. Results are shown for a typical winter's day, and typical summer's day.
4.3 Pilot plant results without mirrors
4.3.1 Winter day in Pretoria
The mean climatic values for an average winter day (10 July) in Pretoria are given in Table 4. The highest voltages were between 10:00 and 11:00 because of temperature of nearly 23 °C and later between 21:00 and 24:00 because of nearly 11.5 km/h wind speed.
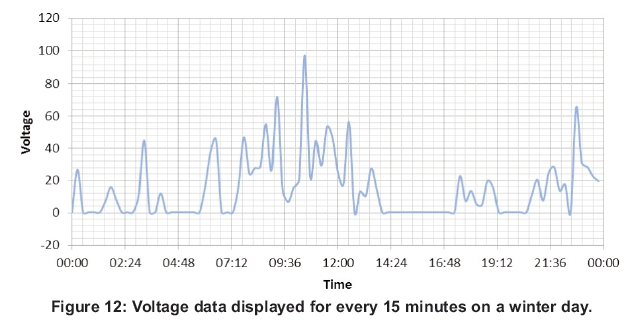
Figure 12 shows the original voltage data for the same winter day, every 15 minutes. The graph shows that the maximum voltage was recorded during the daytime between 06:00 and 14:00. Quiet times are also shown of which the longest was between 14:00 and 18:00, mainly because of overcast conditions. The larger active period between 20:00 and 24:00 was due to the wind associated with a thunderstorm.
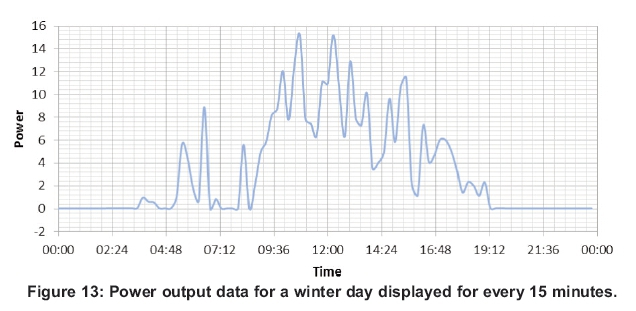
The next parameter that was recorded over time for the pilot plant was the power output (Figure 13). The mean climatic values for an average winter day (8 August) in Pretoria are given in Table 5. The largest power distributions were between 08:00 and 14:30 because of a temperature of nearly 19 °C and a wind speed of 0.0 km/h.
Figure 13 shows the original power data for the same winter day, every 15 minutes. The graph shows that the maximum power was recorded during the daytime between 11:00 and 13:00. Quiet times are also shown for the dark period between 19:00 and 06:00.
4.3.2. Summer day in Pretoria
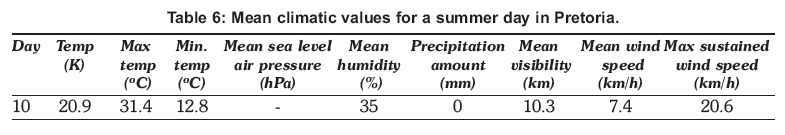
The mean climatic values for a summer day (10 April) in Pretoria are given in Table 6. The highest voltages were between 10:00 and 14:00, because of a temperature of nearly 31.4 °C, and between 21:00 and 00:00 because of a wind speed of nearly 11.5 km/h.
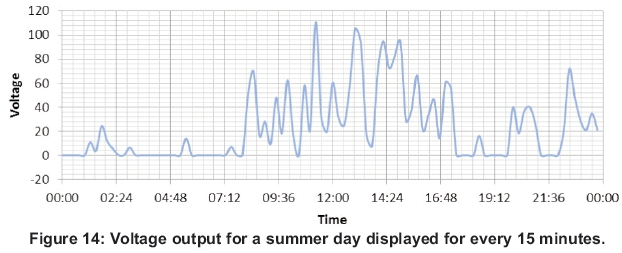
Figure 14 shows the original voltage data for the same summer day, for every 15 minutes. The graph shows that the maximum voltage was recorded between 06:00 and 14:00. Some quiet times are also shown, of which the longest was between 14:00 and 18:00, mainly because of overcast conditions. The larger active period between 20:00 and 24:00 was due to the wind associated with a thunderstorm, which carried on intermittently from 01:00 to 03:00 in the morning. The rest of the early morning was quiet. The average voltage output of a summer day is twice what it is for a winter day (Figure 12).
Figure 15 shows the original power data for a summer day (28 April), for every 15 minutes. The graph shows that the maximum power was recorded during the daytime between 11:00 and 14:00. A strong thunderstorm with associated wind was recorded between 0:00 and 06:00. The quiet times are also shown between 17:00 and midnight, which is to be expected as the sun was not shining. The power output for a summer day is about twice that of a winter day (Figure 13).
5. Pilot plant results with mirrors
Although simulation results were not obtained for the solar up draught chimney with mirrors (Figure 11), results were obtained during the measuring phase, to prove that the performance of the plant will increase if mirrors are added and heat the chimney from all sides.
5.1 Winter day in Pretoria
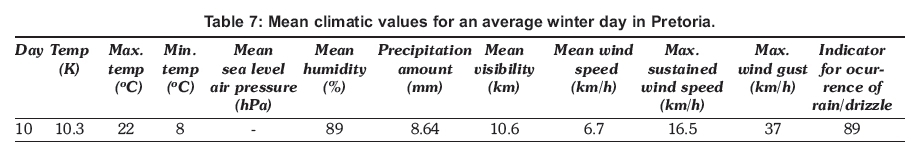
The mean climatic values for a winter day (20 July) in Pretoria are given in Table 7. The highest voltages were between 10:30 and 17:30, because of a temperature of nearly 22 °C, and later between 22:00 and 24:00, because of some wind.
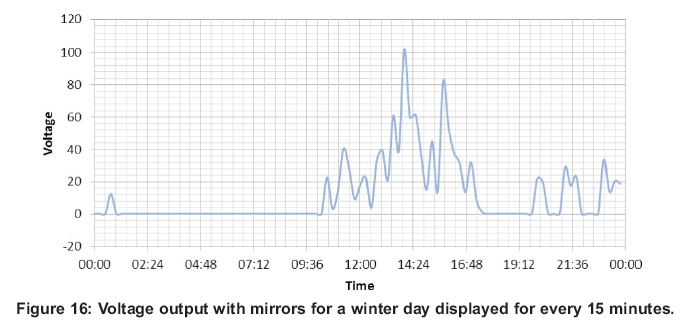
Figure 16 shows the original voltage data with mirrors for a winter day (20 July), for every 15 minutes. The graph shows that the maximum voltage was recorded during the daytime between 10:30 and 17:30. Some quiet times are also shown, of which the longest was between 18:00 and 20:00, mainly due to lack of sun and overcast conditions. The larger active period was during mid-day as expected. The average voltage output with mirrors on a winter day is almost the same as for a winter day without mirrors (Figure 16).
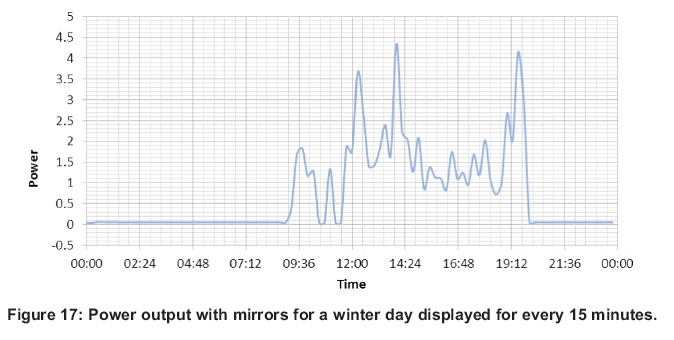
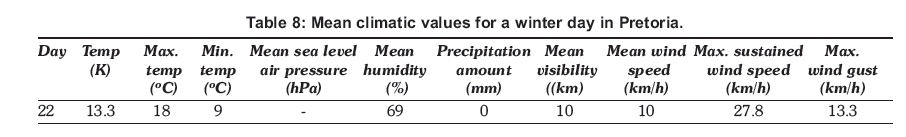
The next parameter that was recorded for the pilot plant with mirrors was the power output (Figure 17). The mean climatic values for an average winter's day (22 July) are given in Table 8. The largest power distributions were between 08:00 and 17:30 because of a temperature of nearly 18 °C and a wind speed of 10.0 km/h.
Figure 17 shows the original power data with mirrors for a winter day (22 July). The graph shows that the maximum power was recorded during the daytime between 11:00 and 16:00. The quiet times are also shown between 19:00 and 06:00, as expected for night-time.
The data displayed in Figure 17 is the power output with mirrors for a winter day at every 15 minutes, which is less than the power output without mirrors. This is mainly due to the lower power produced by the power plant between 15:00 and 19:00, due to overcast conditions. The peak between 18:00 and 19:00 was due to wind.
5.2 Summer day in Pretoria
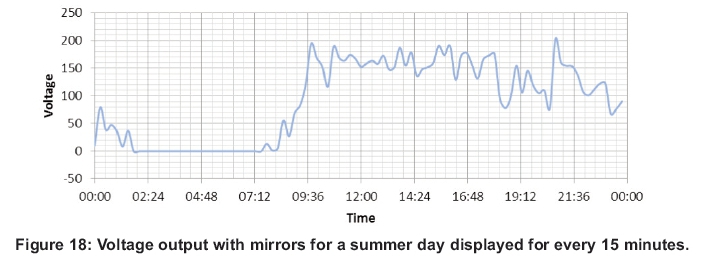
The mean climatic values for a summer day (10 April) in Pretoria are given in Table 9. The highest voltages were between 10:00 and 17:00 because of a temperature of nearly 26 °C and between 21:00 and 00:00 because of a wind speed of nearly 15.7 km/h.
Figure 18 shows the original voltage data for the same summer day, for every 15 minutes. The graph shows that the maximum voltage was recorded during the daytime between 12:00 and 16:00. Some quiet times are also shown between 02:00 and 08:30, as expected. The active period between 18:00 and 24:00 was due to the wind associated with a thunderstorm. The average voltage output of a summer day, with mirrors, is about five times what it is for a summer day without mirrors.
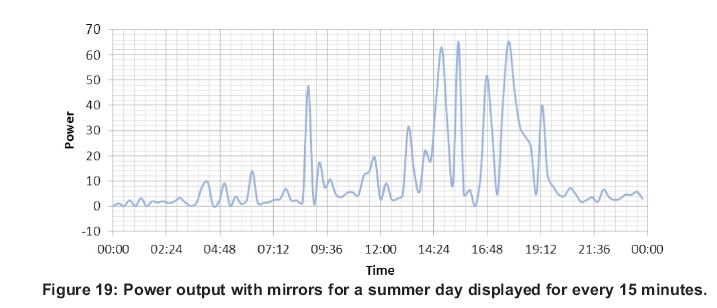
Figure 19 shows the original power data for a summer day (10 November). Climatic data is shown in Table 10.
The highest power was between 15:00 and 20:00, due to a temperature of nearly 33.9 °C and a wind of nearly 10.6 km/h. The power output data is displayed in Figure 19 for a summer day with mirrors every 15 minutes. The power output for a summer day with mirrors is larger than the power output of a summer day without mirrors.
6. Discussion of results
This performance of the solar power plant was evaluated by generating three different sets of data. These were:
• Theoretical and numerical simulations.
• The long-term measurement of the performance of the constructed pilot plant. The physical dimensions of the pilot plant were exactly the same as for the numerical simulations to directly compare the two data sets.
• Measurements of the constructed pilot plant with mirrors
The comparison of the simulation results with pilot plant results are at the top of chimney where turbine was placed. The turbine efficiency used was 80%.
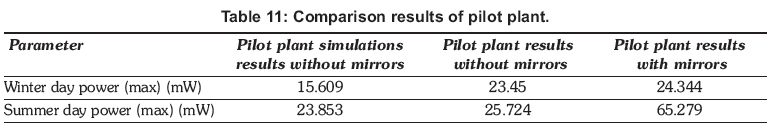
7. Comparison of the results
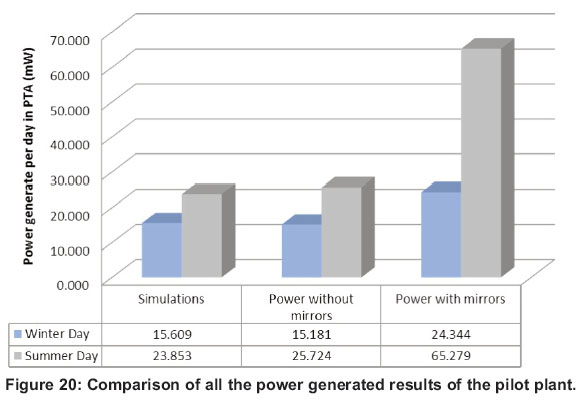
The comparison of the results is shown in Table 11 and Figure 20. It shows that the results of the simulated and measured pilot plant without mirrors are in agreement, when all the efficiencies are taken into account. As expected the results of the pilot plant with mirrors are much larger due to the increased radiation, heat flow and temperature.
8. Conclusions
The purpose of this study was to compare the normal cylindrical chimney with a different shape of chimney, mainly to provide increased airflow and performance. These results showed that an octagonal chimney provided the best performance.
The results showed an increased performance if the turbine was positioned close to the chimney outlet, compared to the normal position at the bottom. It also showed an increase in performance if mirrors are used to heat the chimney from all sides. This technology has the capability of generating large amounts of electricity, depending on the size of the plant. The system is also environmentally friendly towards birds and bats (turbine is enclosed by the chimney).
The solar chimney has a further advantage that the system can deliver energy for longer after sunset, due to excess energy that is captured and stored by the collector, if so designed.
Noisy wind farms that disturb local communities are currently a contentious issue. The noise level of this system is much lower since the turbine is enclosed within the chimney that shields the operational noise.
References
Dhahri, A. and Omri, A., 2013. A review of solar chimney power generation technology, International Journal of Engineering and Advanced Technology 2 (3): 1-17. [ Links ]
Department of Environmental Affairs, State of the Environment (SOER), 2011, Environmental Sustainability Indicator: Technical Report 2011 released 25 April 2013. [ Links ]
Eskom, 2012. Website: http://financialresults.co.za/2012/eskom_ar2012/fact-sheets/013.php [ Links ]
Hamdan, M.O., 2010. Analysis of a solar chimney power plant in the Arabian Gulf region. Renewable Energy 36 (10): 2593-2598. [ Links ]
Jelavic, M., Petrovic, V and Peric, N., 2008. Individual pitch control of wind turbine based on loads estimation. Industrial Electronics, 2008. IECON 2008. 34th Annual Conference of IEEE, 228-234, 10-13 November, 2008, Florida, U.S.A. [ Links ]
Lorenzo, E. 2002. Historical archives of solar energy: The solar chimney at Manzares from a Spanish proposal in 1903. Solar Energy Institute, University Politecnica de Madrid [ Links ]
Sawyer, S., 2016. Global wind report: Annual market update on 19 April 2016 in Brussels. Online at: www.gwec.net/wind-power-leads-all-new-power-generation/. [ Links ]
Zhou, X., Wang, F and Ochieng, R. M., 2010. A review of solar chimney power technology. Renewable and Sustainable Energy Reviews 14: 2315-2338. [ Links ]
Zhou, X., Yang, J., Xiao, B. and Hou, G., 2007. Experimental study of temperature field in a solar chimney power setup. Applied Thermal Engineering 27 (11-12): 2044-2050. [ Links ]
* Tel: +27 (0)123825736 Email: benekelw@tut.ac.za,

