


Services on Demand
Article
 English (pdf)
 Article in xml format
 Article references
Indicators

Related links
-
 Cited by Google
 -
 Similars in Google
Share

 Permalink
Journal of Energy in Southern Africa
On-line version ISSN 2413-3051
Print version ISSN 1021-447X
J. energy South. Afr. vol.27 n.4 Cape Town Nov. 2016
http://dx.doi.org/10.17159/2413-3051/2016/v27i4a1483
ARTICLES
The South African Renewable Energy Independent Power Producer Procurement Programme: A review and lessons learned
Anton Eberhard*; Raine Naude
University of Cape Town Graduate School of Business, 9 Portswood Road, Greenpoint, Cape Town 8001, South Africa
ABSTRACT
The South African Renewable Energy Independent Power Producer Procurement Programme (REIPPPP) is a competitive tender process that was launched to facilitate private sector investment into grid-connected renewable energy (RE) generation. It has been an undisputed success in terms of capacity, investment and price outcomes. Since 2011 a total of 6 328 Megawatts of wind, solar photovoltaic and other RE generation capacity has been procured, amounting to USD 20.5 billion in investment. Bid tariffs have fallen sharply over the course of the programme and the most recently awarded projects are amongst the lowest priced grid-connected RE projects in the world. Considering South Africa's success in achieving more investment via independent power producers in four years than in the rest of Sub-Saharan Africa over the past 25, the REIPPPP's design and management is likely to be of interest to policymakers in African (and other developing) countries. This paper provides a comprehensive review of the programme's tender documentation, implementation, and outcomes to date. Together with supporting research, this analysis has been used to develop a set of high-level lessons intended to facilitate the roll out of similar RE IPP competitive tender programmes in other emerging markets.
Keywords: South Africa; renewable energy; competitive tender; independent power producers
Highlights
• Provides a comprehensive review of South Africa's Renewable Energy IPP Procurement Programme and its outcomes.
• Focuses on the tender documentation in particular, to assess key design features.
• Combines this analysis with supporting research to identify the success factors.
• Lends support to growing international evidence that competitive tenders produce better outcomes than other renewable energy procurement policy instruments.
• Develops a set of lessons from the South African experience that may be transferable to other developing nations.
1. Introduction
High-level energy policy objectives generally do not differ much between countries. Most seek an adequate and reliable electricity supply that is competitively priced, progressively available to all, fosters socioeconomic development and is environmentally sustainable. The cost of renewable energy (RE) is falling and is increasingly able to meet these policy objectives. Globally, innovation and competition have driven down costs, and solar photovoltaic (PV) and wind energy are now amongst the cheapest electricity sources in many countries, including South Africa (Bischof-Niemz, 2015; Randall, 2015; Shah & Booream-Phelps, 2015).
The majority of RE projects in Africa have been procured through unsolicited, directly negotiated projects. However, in Africa and elsewhere there is compelling evidence that competitive tenders or auctions provide superior price outcomes. In contrast, directly negotiated projects have tended to be more expensive, and the other common alternative policy instrument, RE feed-in tariff (REFIT) schemes, have yielded very few African projects (Eberhard et al., 2016).Arguments against competitive tenders - that they are too complicated, have high transaction costs and take too long versus direct negotiations or REFITs - can mostly be countered by experience. Competitive tenders can deliver a pipeline of bankable projects within a reasonable time, especially when they incorporate standardised power purchase agreements (PPAs) and appropriate credit enhancement and security measures. Also, any resources devoted to designing and running these tenders are easily justified in the lower bid tariffs obtained (Eberhard et al., 2016).
South Africa provides a striking example of the success of a well designed RE competitive tender. The Renewable Energy Independent Power Producer Procurement Programme (REIPPPP) was launched to facilitate private sector investment into grid-connected RE generation in South Africa. IPPs were invited to submit bids for onshore wind, solar PV, concentrated solar power (CSP), small hydro, biomass, biogas or landfill gas projects. Between 2011 and 2015 four such rounds of competitive bidding, referred to as bid windows (BWs), have been completed. Competition has been fierce, with over 300 submissions1 from BWs 1 to 4 resulting in just under a third (92) of these - mostly wind and solar PV - being selected for the procurement of 6 328 megawatts (MW), amounting to a total investment of USD 20.5 billion. No other government-initiated programme in South Africa rivals the scale of investment achieved, or the degree of transparency (Eberhard, 2016). Submissions for an expedited bid window, designed primarily to provide bid projects that had been unsuccessful during prior rounds with a second opportunity to bid, were made in November 2015. Under this BW, 1 800 MW was made available for tender; however, projects will only be awarded later in 2016 and so it is excluded from this review.
As a result of fierce competition, prices have fallen sharply between BWs 1 and 4. Projects awarded under BW 4 indicate that both solar PV and wind energy are now cheaper than the national utility, Eskom's, average cost of supply2and about half the cost of its new power stations (Eberhard, 2016). In 2015, they were also amongst the lowest-priced grid-connected RE projects in the world, reaching as low as ZARc 77 (USDc 6.4) per kWh and ZARc 56 (USDc 4.7) per kWh, respectively.3 Indications are that the expedited BW in 2016 will deliver even lower prices.
By October 2015, 42 of the 92 contracted projects (equivalent to approximately one third of total contracted capacity to date) were fully operational,4 demonstrating both the ability of a competitive tender to expedite the delivery of numerous projects, as well as the shorter time frames associated with constructing RE generation plants versus conventional fossil fuels. In less than 4 years, South Africa achieved more investment in IPPs than in the rest of sub-Saharan Africa over the past 25 years (Eberhard et al, 2016), and Bloomberg New Energy Finance ranked South Africa amongst the top ten countries in the world in terms of RE investment. Given South Africa's global significance in the RE industry, this paper provides a comprehensive review of the REIPPPP and its outcomes. Existing literature on the programme has primarily addressed BWs 1 to 3. This paper provides an updated overview of the REIPPPP in Section 1, its bid documentation in Section 2 and the outcomes to date in Section 3. An in-depth analysis of the tender documentation was considered key to identifying design features that have underpinned the REIPPPP's success. It is therefore the focus of this review. Lastly, Section 4 extracts the lessons learned from the South African experience and discusses their policy implications. The authors arrived at these lessons in two ways: firstly through a literature review, which collated and refined lessons that had been identified in other reports and studies; and, secondly, through an inductive, ground-up process where emerging lessons were identified through interviews as well as the aforementioned detailed analysis of the REIPPPP documentation. The authors believe that these lessons are particularly important for sub-Saharan Africa, where the primary barrier to implementing RE remains institutional (Eberhard et al, 2016). Governments need to build on best international practices in running competitive tenders for new power generation capacity, including renewable energy technologies. There is currently a strong interest from international developers in Africa, and using insights from the REIPPPP could expedite the roll out of RE IPP competitive tenders in these, and other, developing countries.
2. Background
From 2011 to 2015 the number of countries with RE competitive tenders or auctions has increased substantially, from 36 to at least 60. In contrast, REFIT policy instruments have seen slowed growth from 70 to only 79 over the same period, indicating a shift towards tenders as the preferred policy instrument (REN21, 2015). This is not surprising when one looks at the price outcomes of some of the most recent RE competitive tenders across the globe. In respect of wind tariffs being achieved, front-runners include Morocco, Mexico, Peru, South Africa, Australia and Brazil. While the 2015 wind prices for South Africa, Brazil and Australia averaged USDc5.6 per kWh (ACT Government, 2016; Marais, 2015; Santos, 2015; Spattuza, 2015)5, the wind prices for 2016 tenders to date - Mexico, Peru and Morocco - bettered this byaveragingas little as USDc 5.5, USDc 3.7 and USDc 3.0 per kWh, respectively (Hristova, 2016; Spattuza, 2016; Yaneva, 2016).
Solar PV has seen an even greater number of competitive tenders or auctions in 2015 and 2016.6In May 2016, Dubai set a new world record for solar PV prices at USDc 3 per kWh (Tsanova, 2016). Mexico's inaugural power auction and the United States have also achieved solar PV bid tariffs at and below USDc 4 per kWh,7 respectively (Ayre, 2016; Dezem and Williams, 2016). On the African continent, the Scaling Solar auction in Zambia delivered a winning tariff of USDc 6 per kWh (Shumkov, 2016). While bid tariffs across countries will not be directly comparable (due to different economics, resource quality, concessional finance and incentives such as tax breaks), South Africa's most recent solar PV prices are still comfortably amongst the top ten in the world.
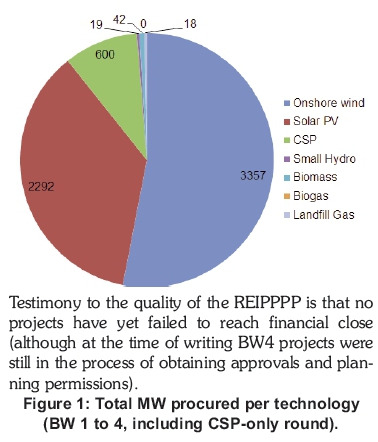
With so many countries showing strong progress in terms of RE IPP competitive tenders, why is the South African case significant? Firstly, because not only have its price outcomes been world class, but its clean record to date - of the 92 projects awarded, none have failed to date - indicates that valuable lessons may be learned. This is both in terms of the requirements imposed on bidders in the tender documentation and legal contracts, as well as the management of the procurement programme and bidders. In many ways, the REIPPPP was also a pioneer. Government was willing to assume the risk of trying new design options, rather than simply replicating international frameworks that may not necessarily have suited the country's unique requirements. For example, in international RE tenders governments had typically chosen the sites, borne the cost of connection and generally assumed more of the risk. This would have placed unacceptable pressure on the South African government and the decision was made to transfer some of these responsibilities to the bidders. Lastly, it is likely that socio-economic development is a key objective for any developing country. The South African programme included a wide range of non-price criteria and provides excellent insight into how a competitive tender can be designed to boost socio-economic development while still procuring generation capacity at a competitive price.
3. Results and discussion
3.1.An overview of the REIPPPP
The REIPPPP was designed as a series of single, closed-bid (also known as sealed) tenders, initiated by the issue of a combined request for qualification and proposal (RFP). Each bid window made available a total amount of MW in specific technology categories (Table 4). Unlike many international RE competitive tenders, the REIPPPP did not include a prequalification stage. Instead, it was structured as a one-stage tender, in which all compliant bid responses submitted by the prescribed deadline -typically only three months from the issue of the RFP - were accepted. Preferred bidder status was awarded to the highest ranked projects per RET category, within the technology-specific and total MW allocation. The lack of a prequalification stage was compensated for by incorporating stringent RFP requirements and non-negotiable contracts. This ensured that bidders were serious and adequately resourced to complete their projects as proposed. While this has been successful thus far, it imposed a significant transaction cost on bidders, many of whom absorbed these costs without being awarded any projects.
Once IPPs were appointed as preferred bidders they were required to sign standardised, non-negotiable, South African Rand (ZAR)-denominated, 20 year PPAs with the off-taker, Eskom. Prices were indexed to inflation, based on the South African Consumer Price Index. The PPA was supported by an implementation agreement (IA) between the IPP and government (represented by the Department of Energy), which, along with a government framework support agreement, effectively 'guarantees' Eskom's payments. There was also a standard direct agreement (DA) between the IPP Eskom, the Department of Energy (DOE) and lenders, which provides the latter with step-in rights in the event of default. Lastly, connection agreements were required, although the specific agreement depended on whether connection would be to the transmission or distribution system. In general, IPPs were responsible for the costs of shallow connections (i.e. to the nearest substation), but not for deep connection costs (i.e. those related to strengthening Eskom's transmission system).
Historically Eskom was responsible for IPP procurement efforts in South Africa but made little progress. When the DOE took over this role, it had little institutional capacity to run a programme of the size and complexity envisaged for the REIPPPP and approached the National Treasury's Public Private Partnership (PPP) Unit for assistance (Eberhard et al., 2014). A small number of technical staff from the Unit and the DOE established a combined team known as the DOE IPP office with full authority to run the programme. The DOEIPP office team leader, seconded from the PPP Unit, had extensive experience working with the private sector, managing consultants and working with PPP contracts (Eberhard et al., 2014). The largely ad hoc institutional status of this unit, acting at arm's length from government as a dedicated project office, allowed for a flexible operating approach that emphasised problem-solving to make the pro gramme successful, rather than automatically following governmental operational policies that emphasise enforcement of rules.
The DOE IPP unit was given only nine months to prepare all the bid documentation and associated legal contracts before the launch of the REIPPPP. This was a formidable task considering that South Africa had no experience in running RE competitive tenders. To achieve this, the Development Bank of Southern Africa (DBSA) provided a sizable ZAR 80million for the DOE IPP unit to hire transaction advisors, a project office and facilitate capacity building. National Treasury later offered ZAR 100million, which was used to repay the DBSA and saw the REIPPPP through BW 1 and into part of BW 2(Martin &Winkler, 2014). The DOEIPP office tendered for a large suite of financial, legal and technical transaction advisors, many of whom were from abroad and had international experience. In the initial design stages there were over 50 advisors around the table, whose expertise and knowledge of international best practices has been fundamental to the REIPPPP's success. Over time, the number of advisors to the DOE extended to over 100 representatives from 13 professional firms offering legal, financial, technical, socio-economic and environmental consultancy services. External professional firms were used to conduct bid evaluations so that the selection process would be strictly independent from government and offer objectivity. Bidders have widely acknowledged this as an important contributor to their participation in the programme.
3.2 General and qualification requirements
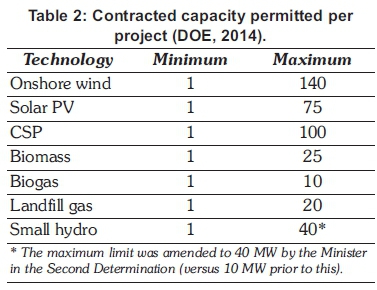
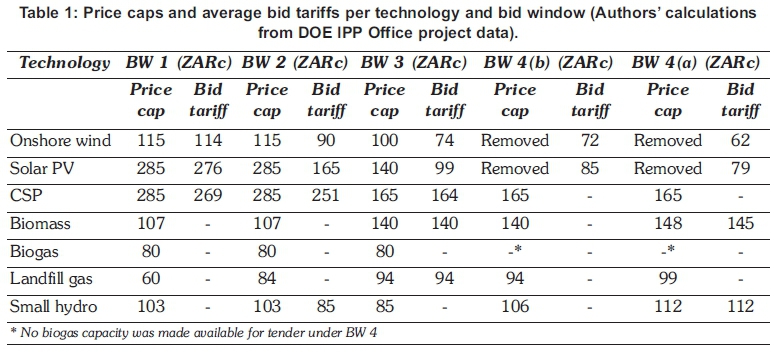
Bid evaluation took place in two stages. First, bid submissions were assessed to determine whether they were 'compliant bids', meaning that they met both general requirements and numerous prescribed thresholds to 'qualify' for the second stage. The latter stage was a comparative evaluation of all compliant bids based on price (constituting 70% of the final score) and a basket of economic development criteria (30%). The DOE prescribed price caps per technology, which fully indexed bid tariffs could not exceed. These caps were adjusted over time based on local and global influencing factors, and Table 1 compares them to changes in the average tariffs of preferred bidders. The DOE also placed maximum limits on the total capacity available for tender per technology (which differs each bid round); however it reserved the right to reallocate the total MW available amongst the various technologies at any stage. In BW 4 this was extended to permit the DOE to increase or decrease the total MW available per technology and/or for the bid round in total, with the latter increase being capped at double the total initial allocation. In addition, there were restrictions on bid capacity per project (Table 2), which allowed for a greater number of project awards within each RET's allocation and thereby stimulates competition.
Due to the significant strain that the REIPPPP imposed on already limited local advisory capacity, bidders could not be prohibited from consulting with the advisory firms (e.g. lawyers, auditors etc.) as well. However, to manage potential conflict of interests, both the bidder and advisory firm were required toput proper ring-fencing mechanisms in place and provide assurance to this effect in the bid response.
A recurring criticism of international RE IPP competitive tenders has been the award of contracts to inexperienced bidders, who subsequently struggle to finance and deliver on their project as proposed. The inclusion of high penalty costs reduces this risk by ensuring that bids are as fail-safe as possible (Papapetrou, 2014). In line with this, the REIPPPP required bidders to provide an unconditional, irrevocable Bid Guarantee of ZAR 100 000 per MW of contracted capacity for the proposed project. Once provisionally informed of its preferred bidder status, each IPP had to lodge a new 'preferred bidder' guarantee for double the amount (ZAR 200 000) per MW. Only thereafter would it officially be appointed as a preferred bidder, and this guarantee could be forfeited to the DOE if the preferred bidder failed to comply with various prescribed conditions. Upon signing the IA, preferred bidders were required to pay a development fee equal to 1% of their total project cost to the DOE's Project Development Fund. This proved valuable for the programme's sustainability, by securing funding for transaction advisors and running future tenders, thereby largely keeping the programme off government's budget.
All monetary amounts in the bid response had to be presented in South African rands. Adjustments were permitted to the prescribed spot rate used at bid submission - and corresponding adjustments to bid tariff - at financial close in respect of capital expenditures (capex), but not for operating costs. From BW 3 the foreign exchange exposure that the DOE would compensate for between bid submission and financial close was limited to 60% of capex, to align with the 40% local content requirement (which will be discussed in Section 3.3.2.). As per economic theory, operating cost foreign exchange movements should be compensated for via the inflation-linked tariff. Other important general requirements included the interface with the grid provider, obtaining information on grid capacity and potential constraints, and clearly defining which part of the shallow connection works would be undertaken, owned and operated by the IPP (rather than the grid provider).
In broad terms, projects that 'qualified' for comparative evaluation were those that were technically, financially and legally qualified, as well as having sufficient experience, commitment and resources to execute the project as submitted - to be discussed below.
3.2.1 Legal criteria and evaluation
As of BW 4, the legal qualification criterion consisted of only two sub-criteria. The first required that the Project Company's Constitutional Documents reflect that it is a special purpose vehicle whose sole purpose is to undertake the bidder's project, and that it is 'ring-fenced' in terms of the South African Companies Act. It was not necessary for this special purpose vehicle to be established by bid submission, but an undertaking was required that it would be. Secondly, various written confirmations of under-takings were required. Amongst others, all bidder companies, their members and lenders had to accept the terms of the PPA, IA, DA and connection agreements and adhere to the requirement that no mark-ups or amendments are permitted. Several other sub-criteria were removed over the course of the REIPPPP as the DOE acquired comfort with the programme and the bidders. This demonstrates the flexibility that a multiple bid window tender offers, as well as the importance of refining the design to reduce bidder burden as the programme progresses.
3.2.2. Land acquisition and land use criteria and evaluation
Bidders had to submit sufficient proof of land acquisition, which could include title deeds or notarial lease for the project site; an unconditional land option, lease or sale of land agreement; or a conveyancer's certificate (in instances where title deeds were unavailable at the time of submission). A key change to this criterion in BW 4 was that bidders were no longer required to submit proof in the bid response that all necessary applications (including those relating to land use change, subdivision and zoning applications, respectively) had been made to secure the right to lawfully use the project site for their intended purposes. They were now only required to provide this after being appointed as a preferred bidder, so that unsuccessful bidders avoided incurring this cost and time burden.
3.2.3. Environmental consent criteria and evaluation
Bidders had to pass both general and technology-specific sub-criteria under this criterion, and had to provide evidence that all requisite environmental consents had been obtained by bid submission. The primary requirement across all technologies was an environmental authorisation per project, as required by the South African National Environmental Management Act. This was either in the form of an Environmental Impact Assessment Report (EIAR) or a lesser Basic Assessment Report (BAR), dependent on the plant capacity or size of the site. It was a significant cost item for bidders (ZAR 2-6 million) and had the longest lead time of all the permissions required, taking up to 24 months (Mulcahy, 2014). Bidders also had to submit details of objections to the facility's development raised during any public participation process as well as appeals to any environmental consent required. The bidder could fail this criterion where the relevant appeal or review period had not expired by bid submission.
Water was another key consideration. South Africa is a water-scarce country and it was crucial that each bidder identified whether their project (including construction activities) would require an Integrated Water Use Licence under the National Water Act. This included providing copies of all studies done to determine the project's water needs and activities.8To reduce the burden on the Department of Water Affairs, the licence itself was only required before signing the PPA. However, upon bid submission any bidder requiring a water allocation had to provide written confirmation of this approved allocation from the local water services provider (usually the municipality) or, where this was insufficient and a water use licence would be required, provide a non-binding confirmation of water availability from the Department.
From BW 4, bidders were no longer required to provide proof in their bid response of all non-core environmental consents in respect of the proposed facility being lawfully developed, constructed, connected to a distribution/transmission system and operated in accordance with the PPA. They still, however, had to demonstrate that these other applications had been made upon being appointed as preferred bidders.
3.2.4. Financial criteria and evaluation
The financial qualification criteria broadly relate to the bid price and related financial proposal. Four key criteria, with numerous sub-criteria, were assessed. While they were stringent, they have been important drivers for ensuring that projects are implemented on schedule and as proposed. Firstly, bidders had to submit fully-indexed prices and partially-indexed prices per MWh. As stated, the fully-indexed prices had to be equal to or lower than the price caps in order to pass this criterion. From BW 3, concentrated solar power (CSP) was recognised as a technology with storage capabilities, and the REIPPPP began to price CSP projects differently. While other RE projects earn their flat bid tariff at all times, CSP bidders submitted a 'base price' which is then adjusted upwards or downwards according to the time of day that the project's energy is delivered. Premium payments, at 270% of the base price during designated peak times, were designed to incentivise CSP bidders to use their storage ability to help meet peak demand on the national grid.
Secondly, the project's financial standing was thoroughly analysed. The bidder had to propose the funding it intended to use, the identity of all providers or members, the value of the contribution from each and the source of finance. Where corporate or equity financing would be used, the bidder had to provide the audited financial statements for the latest three financial years of the ultimate provider entity. Additionally, the bidder had to demonstrate that the net assets of each ultimate provider over the past three years had been at least 100% of the finance they were proposing to put towards the bid project ('net asset test'), or that the provider had a proven track record in the past five years of raising finance to the equivalent of at least 100% of its proposal ('track record test'). From BW 2 equity members with 'free carry' or 'sweat equity' i.e. no equity investment in the project, such as black enterprises9 and local community trust entities, are exempt from these two tests. If this were not the case it could have adversely affected the achievement of some of the economic development objectives in respect of black and local community ownership.
The third sub-criterion considered the robustness and deliverability of the funding proposal. Bidders had to provide a breakdown of equity, corporate finance and external debt and their uses (capital expenditure and grid connection costs). A defining feature of the REIPPPP was the requirement that letters of support must be provided by the ultimate finance provider(s) of each funding source, substantially in the form prescribed in the RFP. This differed from most international competitive tenders at the time, which had not required finance to be locked in by bid submission. The letters of support required each financier to make a firm commitment, pledge that it had conducted a due diligence on the proposed project and confirmed the accuracy of the bidder's documentation. This essentially outsourced part of the due diligence to the banks and other funders, ensuring that bidders could not engage in 'low-balling' where they price unrealisti-cally low to win contracts and subsequently cannot deliver (Eberhard et al., 2014). It also reduced the DOE's due diligence load. In addition, funders had to acknowledge that they accepted the risk allocation as embedded in the PPA, IA and DA, which is a critical issue in PPPs.
Bidders also had to demonstrate a 'robust mitigation strategy' - an alternative plan to obtain funds if their proposed finance provider became unable to do so. A letter of indicative support from the alternative funders was required. The robustness of the financial models was also assessed. This criterion required, amongst others, sensitivity analyses on the bidders' financial models to indicate the impact of foreign exchange movements on the bid tariff; disclosures on tax and accounting treatments and assumptions applied; as well as an audit review opinion of the financial models by a suitable professional firm. Lastly, bidders had to submit a declaration in respect of success payments, which are the reimbursements of costs incurred in the development of the bid project which will be payable only on achievement of financial close. Examples included payments to developers, free carry for equity members and success payments for equity and nonequity members (DOE, 2014a).
3.2.5. Technical criteria and evaluation
Bidders had to complete a standardised technical evaluation matrix as part of their bid response. This criterion also contained numerous requirements around grid connection, such as a signed letter stating that the project was able to comply with the applicable grid codes prior to scheduled COD. Bidders also included a cost estimate letter (CEL), which provided an indicative timeline and cost of the required connection works from the grid provider. The onus was on bidders to apply in time to receive this CEL by submission date. Where the bidder intended to perform shallow connection works on an own- or self-build basis, they had to supply an itemised cost estimate for their part. Upon the appointment of preferred bidders, this CEL had to be replaced by obtaining a more up-to-date and accurate budget quote from the grid provider. Bidders had to clearly identify what their interface with the grid provider would be during operations.
There were also many technology-specific criteria. In broad categories, these covered:
• eligible technology requirements: prescribed standards and certifications that proved the technology's quality and performance;
• energy resource certainty (independently verified) for biomass and biogas projects which confirmed the availability of fuel to meet the facility's demand for at least the first two years of operation;
• forecast energy sales report (independently verified) based on the required production estimate, conducted by a suitable energy resource assessor;
• contracting company capability requirements; and
• project schedule disclosures and a deadline by which COD had tobe achieved.
The forecast energy sales report differed by technology and was an essential part of the technical criteria, as it involved the collection of resource data to estimate future energy sales. For wind projects, for example, this report had to supply at least 365 consecutive days of wind data (subject to additional criteria where there had been gaps in data collection) measured on the project site at specific heights and in accordance with international standards for wind testing. Solar PV projects required at least ten years of solar data extracted from a prescribed acceptable technology source.
3.2.6. Economic development criteria and evaluation
These economic development (ED) qualification criteria must not be confused with the ED evaluation criteria, the latter of which are only imposed in the comparative evaluation stage. There were two primary ED thresholds that had to be passed for a bid to be compliant. Firstly, there had to be a minimum of 40% 'South African entity participation' in the project company. This was initially defined as participation by those entities 'based and registered in the Republic of South Africa, which have legal and beneficial participation in the Project Company' (DOE, 2011). From BW 3, however, the definition was narrowed to participation by South African citizens specifically. Secondly, the bidder had to have a Broad-Based Black Economic Empowerment contributor status level of at least 5,10 although this was only in respect of South African bidder members. Lastly, bidders were required to meet or exceed any minimum thresholds indicated in the Economic Development Scorecard provided by the DOE, and to provide supporting documentation as proof. These thresholds are provided in Table 3 (Section 3.3.2.), and discussed in more detail, below.
3.2.7. Value for money
This concept was introduced from BW 2, and stated that the buyer could not enter into the PPA unless it represented 'value for money'. This meant that the project would deliver an acceptable outcome to both Eskom and the government (on behalf of South African electricity users). Numerous factors were taken into account, including the bidder's price proposal, ED commitments, the project's calculated IRR and foreign exchange risk borne by the government. Lastly, if the evaluators considered the success payments to developers to be unjustifiable relative to the total project cost, the bidder could fail this criterion.
Returning compliant bidders
While various amendments to the RFP documentation had been made as the rounds progress, the BW 4 RFP introduced some noteworthy concessions (some of which have already been highlighted above) in an attempt to reduce the noted time and cost burden for bidders (Papapetrou, 2014). Key to this was the introduction of the 'returning compliant bidder' concept, which addresses those bidders who are re-submitting bids that were compliant in earlier bid rounds, but unsuccessful in the second stage evaluation. From BW 4 they were exempt from adhering to certain qualification criteria (relating to land acquisition and use, as well as environmental consents), provided that the new bid project was located on the same site as previously.
3.3. Evaluation criteria
3.3.1. Price scoring
For each compliant bid, an equivalent annual tariff (EAT) was calculated in respect of the bid tariff provided. This was used to determine the compliant bidder's price score out of a maximum of 70 points, when compared to the lowest EAT offered for the same technology in this BW. It is important to note that this price score is a relative metric, hence the second stage being a 'comparative evaluation'.
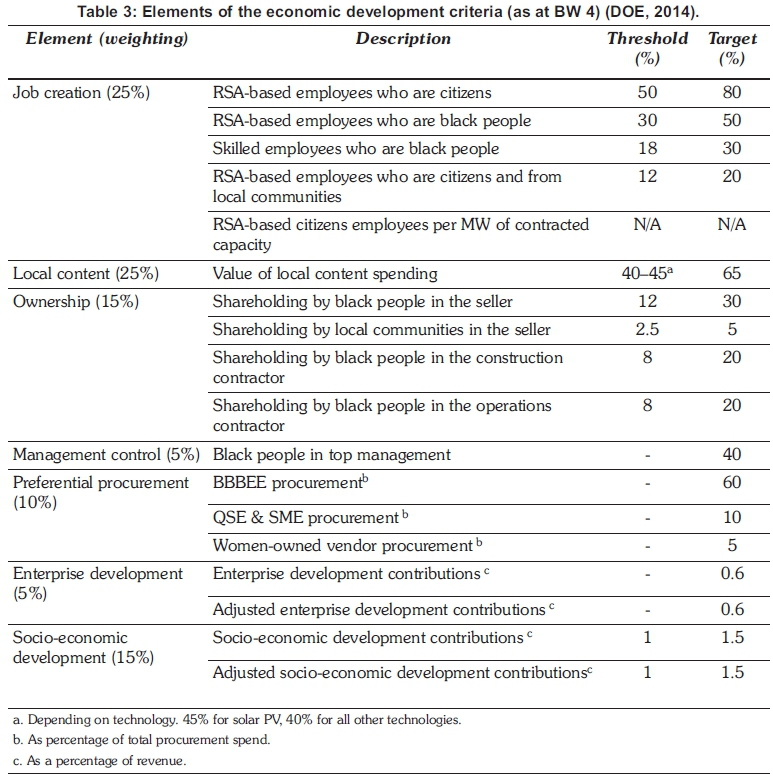
3.3.2. Economic development criteria and scoring
The ED criteria carried a maximum of 30 points. This 70:30 split between price and ED objectives represented a significant shift from government's usual 90:10 split (towards price) as stipulated by the Preferential Procurement Policy Framework Act (Eberhard et al., 2014), and was only made possible through an exemption. This significant emphasis on a wide range of non-price objectives in a RE IPP competitive tender was also uncommon globally and set the REIPPPP apart. There has been controversy over perceived trade-offs between lowering bid prices and meeting ED criteria, with some arguing that the latter adds complexity and cost. However, the underlying objective is to facilitate socioeconomic development, meaning that it garnered crucial political support for the REIPPPP (Eberhard et al., 2014). The ED criteria were grouped in seven non-price categories: job creation, local content, ownership, management control, preferential procurement, enterprise, and socio-economic development. Each category and its weighted contribution to the total ED score is shown in Table 3. From a policy perspective, the government attached greater weightings to priority objectives, such as job creation and local content (together accounting for 50% of the ED score). The element weightings remained unchanged from BW1 to 4.
The REIPPPP indicated 'thresholds' and 'targets' per element and RET. Target outcomes were provided for all categories to encourage bidder commitment, but minimum threshold requirements were only prescribed for job creation, local content, ownership, and socio-economic development. As discussed in Section 3.2.6., these thresholds had to be met for the bid to pass the qualification criteria. No thresholds were prescribed for management control, preferential procurement and enterprise development and they were therefore voluntary commitments.11 Bidders were required to complete and submit an 'economic development information sheet' in the bid response, which automatically generated an economic development scorecard. The pledged commitments in this scorecard were incorporated into the IA so that Preferred Bidders were contractually bound to meet these obligations.
The IA stipulated that IPPs were obliged to report on these obligations to the DOE quarterly and had to be able to provide proof. The first quarter of monitoring began at financial close. There were penalties and rewards based on quarterly performance, with underperformance drawing termination points which could accumulate to the point where the DOE is entitled to terminate the contract (Eberhard et al., 2014). By imposing these penalties, the DOE has ensured that bidders show an ongoing commitment to the ED objectives rather than falsifying pledges to win bids. It has been very effective - to date no awarded projects have accumulated enough ED penalty points to require contract termination.
3.3.3 Overall scoring
The bidder's scores in respect of its ED criteria and price were added together for a final combined score out of 100. All bid projects per RET were then ranked and those highest ranked were appointed as preferred bidders, giving consideration to the maximum MW available for this technology.
3.4 Outcomes of the REIPPPP (as at BW 4)
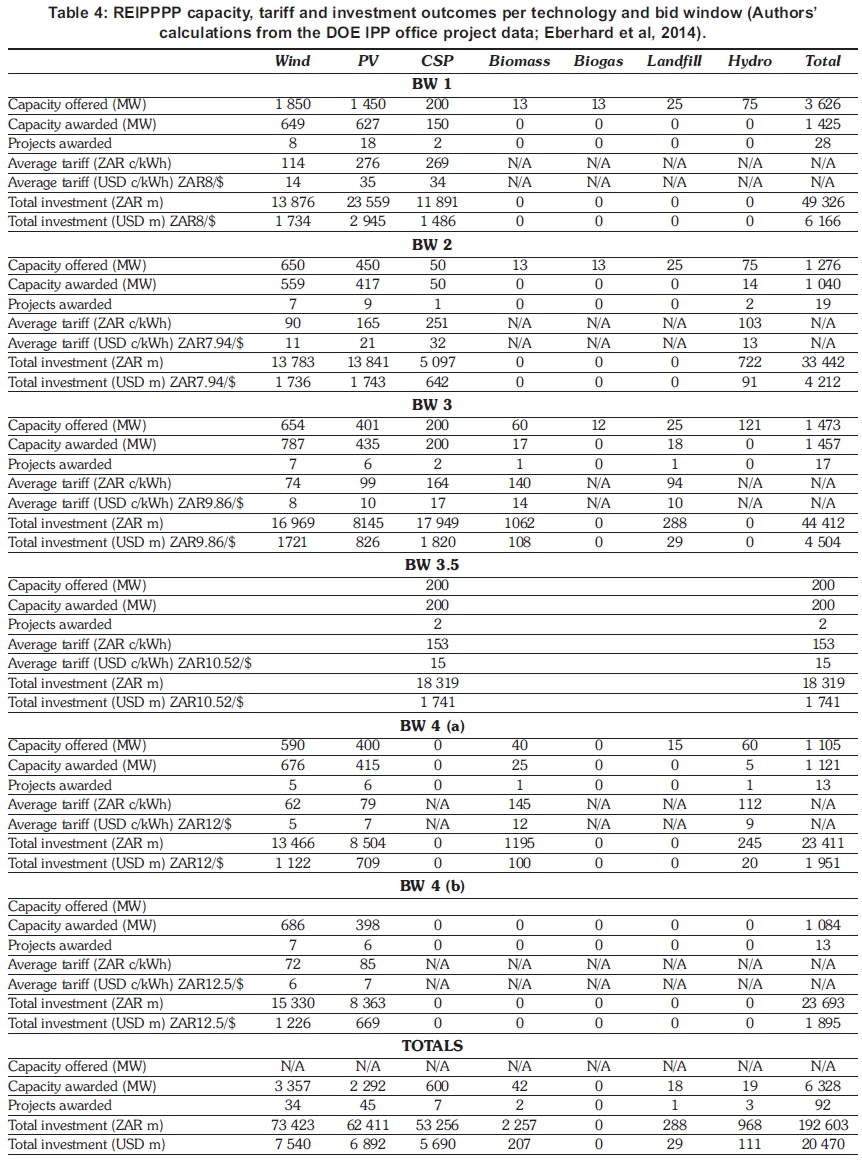
Table 4 summarises the general outcomes of the REIPPPP to date.
3.4.1. Capacity outcomes
The most capacity offered and bid under the REIPPPP was for the two lowest cost technologies, wind and solar PV. Figure 1 illustrates the RET composition of the 6 328 MW procured to date.
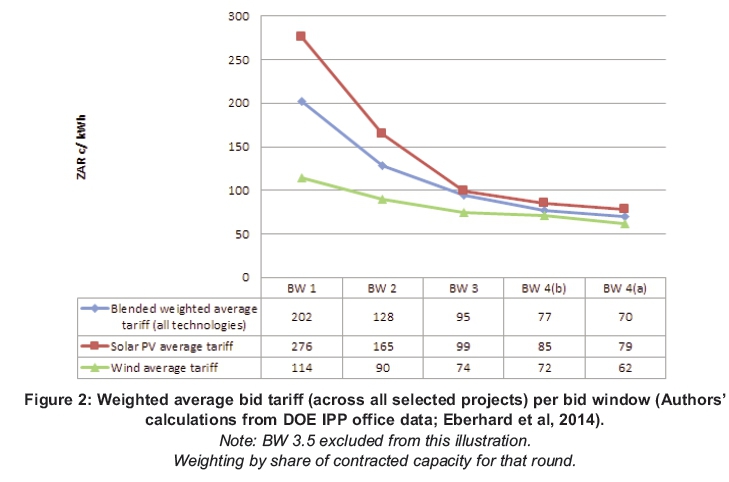
3.4.2. Energy price outcomes The most striking outcome has been the decline in average energy prices over time for all technologies except small hydro, as shown in Table 4. This has resulted in a declining weighted average energy tariff (Figure 2) and is an important step in achieving grid parity, whereby the prices of newer (renewable) energy sources are equivalent to conventional (fos sil fuel) sources.
In BW 1 the bid tariffs were fairly close to the prescribed caps and less capacity was bid for than was made available for tender. It is believed that bidders charged a premium because they knew that competition was likely to be limited as a result of tight deadlines (not all potential bidders would have located sites, undertaken resource measurements or obtained the necessary permits), and significant capacity was on offer. The sizable average tariff decline from BW 1 to 2, despite the price caps remaining unchanged, clearly illustrates the benefit of offering less capacity for tender and increasing competition. As the primary technology (wind and solar PV) caps were adjusted downwards in BW 3 the bid tariffs also declined significantly, and further reductions were seen in BW 4 when their price caps were removed entirely. Due to the success of the bids received in BW 4, two batches of preferred bidders were announced. BW 4(a) awarded the 13 highest-ranked bid responses received, while BW 4(b) selected bids that had ranked 14th to 26th. Because the BW 4(b) projects were lower-ranked bids with higher tariffs, BW 4(b) has been included before BW 4(a) in Figure 2 to best represent the downward trend in tariffs.
Onshore wind is the cost leader of the RETs and has consistently been the cheapest source across rounds. In BW 4(a), the most competitively priced round to date, the average tariff for awarded wind projects was ZARc 62/ kWh (USDc 5.2/ kWh), with the cheapest awarded wind project submitting a bid tariff of only ZARc 56/ kWh (USDc 4.7/ kWh).
However, the largest price drops over the course of the REIPPPP have been noted for solar PV, which decreased by approximately two-thirds from BW 1 to 3, and by 25% from BW 3 to 4. In BW 4(a) the lowest tariff for an awarded solar PV project was ZARc 77/ kWh (USDc 6.4/ kWh), with a similar average PV tariff at ZARc 79/ kWh (USDc 6.6/ kWh).
There have been several contributors to the downward trend in prices. Lower capacity allocations per round and investor confidence, amongst other factors, have stimulated competition. Input costs have also declined, mainly on the back of falling international prices for RE equipment (due to excess supply).12
3.4.3. Investment outcomes
Of the 92 preferred bidders to date, 79 opted to finance their projects using a combination of project finance and equity, while the remaining 13 used corporate finance only. As a result external debt (project financing) accounts for a significant ZAR 125.6 billion (65%) of the ZAR 193 billion total funding raised, while equity and corporate finance account for the remaining 23% and 12%, respectively. The average project financed project was highly geared. Most of the awarded projects indicated a 70-80% debt versus 20-30% equity split.
3.4.4. Key sponsors (equity providers)
The REIPPPP has succeeded in generating interest from local, regional and international project developers and sponsors. A large number of participants in different BWs made repeat contributions through equity, debt or both, highlighting investor confidence in the process and its outcomes. The large permitted foreign shareholding of up to 60% attracted sustained interest from international companies looking for diversification benefits and higher return potential than developed countries. Enel, the Italian utility, was particularly prominent, with equity holdings in 11 awarded projects since BW 3. A number of internationally backed IPPs also established local offices, such as Biotherm, Scatec Solar, Globeleq and Building Energy. Some South African IPPs complained that the presence of these internationally backed companies limited their ability to participate, with stringent RFP and lender requirements 'forcing' local developers to on-sell projects or partner with the multinationals. On the other hand, these partnerships seem to have been very successful and several recurring local-foreign equity partnerships emerged. South African companies and financial institutions were still successful in building a portfolio of projects. For example, Old Mutual, a South African financial services group, owns equity in17 projects. Local participation has been promoted by the ED thresholds: 40% project company ownership by South African citizens, 12% ownership by black individuals and 2.5% ownership by the local community.
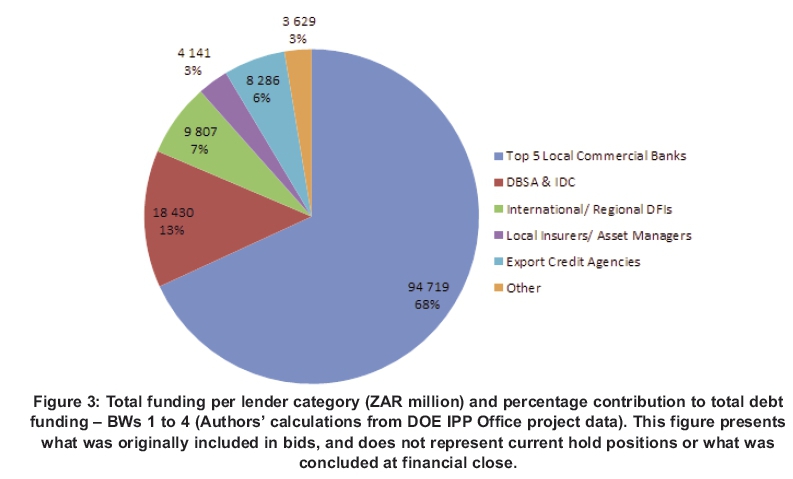
3.4.5. Key external debt providers
Over 20 different debt providers participated in financing projects awarded under the REIPPPP. In contrast to equity investment, which was a mixture of foreign and local sponsors, repeat debt was mainly provided by local entities (Figure 3).The five largest local banks (ABSA, Nedbank, RMB, Standard Bank and Investec) contributed 68% of the external debt to date. The DBSA and Industrial Development Corporation, both South African development finance institutions, were also instrumental in the REIPPPP's success, providing 13% of the debt. The remainder has been provided by other development finance institutions, export credit agencies and local insurance or asset management companies.
Several factors may have contributed to local dominance, such as low currency exposure (international lenders may be reluctant to lend to projects that earn revenue in ZAR) and an awareness of local issues. The South African banking sector is also one of the most sophisticated in the world, which was hugely beneficial to the REIPPPP. The five largest local banks (and the DBSA) have participated in every BW, including the CSP-only round, showing their commitment to the programme.
3.4.6. Economic development outcomes
In terms of the job creation criterion, it is projected that 109 444 jobs will be created for local citizens based on the bid data submitted over all BWs (including the dedicated CSP round), where a 'job' is defined as a job-year. Of this, a substantial 84 564 job-years will be awarded to black citizens and 57 690 job years to the local community surrounding the project site.
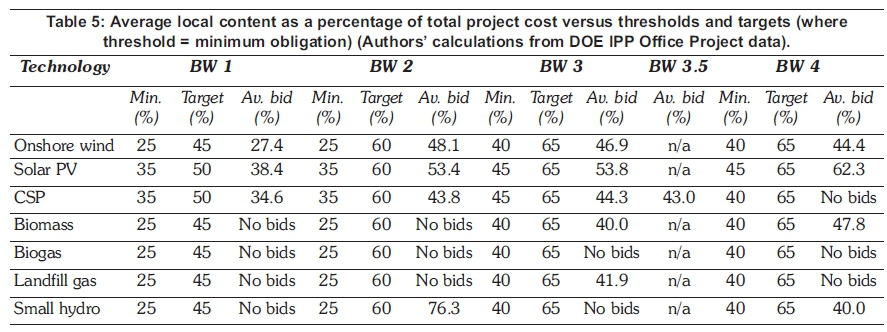
The local content criterion requires a certain percentage of total project value to be spent in South Africa (DOE, 2011). The definition of what constitutes local content has been refined, and required disclosures increased, over the BWs. Table 5 com-pares the average local content outcomes to their respective targets and thresholds per technology. With the notable exception of solar PV, the table suggests that most RETs experienced constraints in achieving higher local content expenditure, with the more recent average local content commitments sitting much closer to the threshold than target.
The socioeconomic development (SED) criterion aims to direct funding to ensure that IPP projects have a positive socio-economic impact (i.e. fund improvements in healthcare, infrastructure and education). There is particular emphasis on achieving this in the communities where the projects are located, defined as the 'recognition for localness', for evaluation. The project's total SED contributions were calculated as a percentage of project revenue and had to meet or exceed a threshold. Bidders seem to have embraced this requirement - in total the REIPPPP has dedicated a remarkable ZAR 19 billion to SED initiatives across South Africa.
4. Conclusion
When it comes to procuring renewable energy generation from IPPs, the South African REIPPPP supports growing international evidence that competitive tenders achieve superior results to other policy instruments. As per IRENA and CEM (2015), the success of a tender will depend on whether it has been well designed to achieve two key goals: increased competition amongst bidders to reduce price outcomes and secondly, participation only by bidders that have the capacity to implement their projects at the contracted bid tariff within the given timeframe. With these objectives in mind, the REIPPPP offers several key lessons for policymakers in other developing countries.
References
ACT Government, 2016. Outcomes of the ACT's second wind auction. Online at: www.environment. act.gov.au/energy/cleaner-energy/wind_power/outcomes-of-the-acts-second-wind-auction [accessed 2 August 2016]. [ Links ]
Ayre, J., 2016. Palo Alto, California, approves solar PPA with Hecate Energy At $36.76/MWh! (Record Low). CleanTechnica. Online at: https://cleantechnica.com/2016/02/23/palo-alto-california-approves-solar-ppa-hecate-energy-36-76mwh-record-low/ [accessed 15 April 2016]. [ Links ]
BEE Information, n.d. BEESA Group. Online at: www.bee.co.za/content/Information.aspx [accessed 14 April 2016]. [ Links ]
Bischof-Niemz, T., 2015. Stability in changing winds: How our thinking about renewables needs to change. Presentation at the USB Leader's Angle. University of Stellenbosch Business School. 30 January 2015. [ Links ]
Department of Energy, 2011. The RE IPP Procurement Programme Part A: General Requirements, Rules and Provisions 1-130. Republic of South Africa. [ Links ]
Department of Energy, 2014a. The REIPP Procurement Programme Part B : Qualification criteria. Republic of South Africa. [ Links ]
Department of Energy, 2014b. The REIPP Procurement Programme RFP Part A: General requirements, rules and provisions. Republic of South Africa. [ Links ]
Dezem, V. and Williams, A. 2016. Mexico first power auction awards 1,720 megawatts of wind, solar, Bloomberg. Online at: www.bloomberg.com/news/articles/2016-03-29/mexico-first-power-auction-awards-1-720-megawatts-of-wind-solar [accessed 15 April 2016]. [ Links ]
Eberhard, A., 2016. SA's power lies in breaking up Eskom's monopoly model. Business Day Live. Online at: www.businesslive.co.za/bd/opinion/2016-07-21-sas-power-lies-in-breaking-up-eskoms-monopoly-model/ [accessed 28 July 2016]. [ Links ]
Eberhard, A., Gratwick, K., Morella, E. and Antmann, PI 2016. Independent power projects in Sub-Saharan Africa: Lessons from five key countries. World Bank, Washington, D.C. doi:10.1596/978-1-4648-0800-5. [ Links ]
Eberhard, A., Kolker, J. and Leigland, J. 2014. South Africa's Renewable Energy IPP Procurement Program: Success factors and lessons. Public-Private Infrastructure Advisory Facility & The World Bank Group, Washington, D.C. [ Links ]
EnergyBlog, 2015. Project database. Online at: http://energy.org.za/knowledge-tools/project-database [accessed 2 November 2015]. [ Links ]
Eskom, 2016. Eskom integrated report 2016. Johannesburg. [ Links ]
Hristova, D. 2016. Peru shortlists 13 winners in renewables auction, SeeNews Renewables. Online at: http://renewables.seenews.com/news/peru-shortlists-3-winners-in-renewables-auction-513576 [,accessed 14 April 2016]. [ Links ]
International Renewable Energy Agency (IRENA) & Clean Energy Ministerial (CEM), 2015. Renewable energy auctions: A guide to design. Abu Dhabi. [ Links ]
Marais, L., 2015. Brazil's April 27 auction results in 479 MW of renewables deals. SeeNews Renewables. Online at: http://renewables.seenews.com/news/brazils-april-27-auction-results-in-479-mw-of-renew-ables-deals-474285 [accessed 14 April 2016]. [ Links ]
Martin, B. and Winkler, H. 2014. Procurement models applied to independent power producer programmes in South Africa. Energy Research Centre, University of Cape Town. Online at: www.erc.uct.ac.za/sites/default/files/image_tool/images/119/Papers -2014/14-Martin-WInkler-Procument_models_for_IPPs.pdf [accessed 5 May 2015]. [ Links ]
Mulcahy, M. 2014. Market intelligence report : Renewable energy - Draft 1-17. GreenCape. Online at: http://greencape.co.za/assets/Uploads/GreenCape-MIR-Renewable-Energy.pdf [accessed 25 May 2015]. [ Links ]
Papapetrou, P. 2014. Enabling renewable energy in South Africa: Assessing the Renewable Energy Independent Power Producer Procurement Programme. World Wildlife Fund Technical Report, Cape Town. [ Links ]
Randall, T. 2015. Solar and wind just passed another big turning point, Bloomberg. Online at: www.bloomberg.com/news/articles/2015-10-06/solar-wind-reach-a-big-renewables-turning-point-bnef [accessed 8 November 2016]. [ Links ]
Renewable Energy Policy Network for the 21st century (RE21). 2015. Renewables 2015 global status report. Paris. [ Links ]
SAInfo Reporter. 2013. Black economic empowerment, SouthAfrica.info. Online at: www.southafrica.info/business/trends/empowerment/bee.htm#.WCQ-Zy196M8 [accessed 19 April 2016]. [ Links ]
Santos, H. 2015. , Wind Power Monthly. Online at: www.windpowermonthly.com/article/1361757/brazil-a3-auction-hampers-profitability [accessed 15 April 2016]. [ Links ]
Shah, V. and Booream-Phelps, J. 2015. F.I.T.T. for investors: Crossing the chasm. Deutsche Bank Markets Research. Online at: www.db.com/news-room_news/Markets_Research_Solar_Industry.pdf [, accessed 19 April 2016]. [ Links ]
Shumkov, I. 2016. Zambia's IDC unveils solar auction winners, 73 MW to be added. SeeNews Renewables. Online at: http://renewables.seenews.com/news/zam-bias-idc-unveils-solar-auction-winners-73-mw-to-be-added-528720 [accessed 1 August 2016]. [ Links ]
Spattuza, A. 2016. Mexico's lessons for the renewable energy industry, RechargeNewsOnline at: www.rechargenews.com/solar/867252/in-depth-mexicos-lessons-for-the-renewables-industry [accessed 20 April 2016]. [ Links ]
Spattuza, A. 2015. Brazil contracts 548MW of wind power in last 2015 auction. RechargeNews. Online at: www.rechargenews.com/wind/868426/brazil-contracts-548mw-of-wind-power-in-last-2015-auction [, accessed 20 April 2016]. [ Links ]
Tsanova, T., 2016. Bid for 800-MW solar project in Dubai falls below USD 30/MWh. SeeNews Renewables. Online at: http://renewables.seenews.com/news/bid-for-800-mw-solar-project-in-dubai-falls-below-usd-30-mwh-523252 [accessed 1 August 2016]. [ Links ]
Yaneva, M., 2016. Morocco's wind power price goes as low as USD 30/MWh. SeeNews Renewables. Online at: http://renewables.seenews.com/news/moroccos-wind-power-price-goes-as-low-as-usd-30-mwh-509642 [accessed 14 April 2016]. [ Links ]
* Corresponding author: Tel: +27 (0) 21 406 1361; Email: anton.eberhard@uct.gsb.ac.za
1 Excluding those under the Expedited Bid Window.
2 Eskom's electricity revenue per kWh is given as ZARc 76 for 2015/16 in the Eskom Integrated Report 2016 (Eskom, 2016).
3 Based on a ZAR:USD exchange rate of 12:1, as supplied by the Department of Energy IPP Office.
4 Based on the EnergyBlog Project Database: http://energy.org.za/knowledge-tools/project-data-base.
5 The South African bid tariff calculations were based on project data from the DOE IPP Office. Where necessary, to convert bid tariffs to USD, an AUD:USD exchange rate of 1.33:1 and BRL:USD of 3.33:1 was used.
6 17 completed auctions in 2015; 14 completed auctions so far in 2016.
7 These were boosted by in-country incentives.
8 'Water use' includes numerous water-related activities, such as disposing of waste water and storing water to serve the facility.
9 A black enterprise is a legal entity with 50.1% or more of its equity owned by black people and which is controlled by black people, who are defined as African, Indian and Coloured South African citizens (Department of Energy, 2014b). The REIPPPP included requirements around black ownership in line with the South African government's emphasis on redressing the inequalities of the previous apartheid government and bringing the glack majority into the economic mainstream (SAInfo Reporter, 2013).
10 This again relates to government efforts to redress the inequalities that arose under apartheid. South African entities are awarded BEE certificates, from Level 1 (highest rank) to 8 (lowest), depending on their contribution towards the integration of black people into the economy (BEESA Group, 2016). The REIPPPP would therefore only consider entities that show a strong commitment to BEE principles.
11 It is important to state clearly that the voluntary nature of these commitments does not mean that they did not count towards the evaluation score; they were not, however, seen as qualifying criteria.
12 This would have been partly offset by the significant rand depreciation over the past few years, increasing equipment import costs.

