


Services on Demand
Article
 English (pdf)
 Article in xml format
 Article references
Indicators

Related links
-
 Cited by Google
 -
 Similars in Google
Share

 Permalink
Journal of Energy in Southern Africa
On-line version ISSN 2413-3051
Print version ISSN 1021-447X
J. energy South. Afr. vol.27 n.3 Cape Town Aug. 2016
RESEARCH ARTICLE
Ranking South African provinces on the basis of MERRA 2D surface incident shortwave flux
Jyotsna Singh*
South African Weather Service, 442 Rigel Avenue South, Erasmusrand, Pretoria, 0181, South Africa
ABSTRACT
The main objective of the present study is to rank South African provinces on the basis of incoming solar radiation. The surface incident shortwave flux (SWFlux, Wm-2) of NASA Modern-Era Retrospective Analysis for Research and Applications (MERRA 2D) reanalysis data for the period 1980-2009 over South Africa was analysed on annual, seasonal and monthly scales. The monthly mean ± standard deviation values of SWFlux for the period revealed that, Northern Cape received the most (267.38 ± 4.32 Wm-2) incoming solar radiation throughout the year, followed by North West (263.37 ± 7.13 Wm-2) and Free State (259.20 ± 7.66 Wm-2). The northern region of Limpopo also showed a good amount of incoming solar radiation (257.95 ± 6.16 Wm-2) at the surface. KwaZulu-Natal received least (232.99 ± 7.02 Wm-2) amount of mean monthly solar radiation in comparison with other provinces. On an annual scale, the Northern Cape ranked first, and on seasonal and monthly scales North West ranked first. Limpopo and Free State also performed well in the present study.
Keywords: solar radiation, solar energy, reanalysis data
1. Introduction
Solar radiation mainly reaches the earth's surface in the form of shortwave radiation. With a changing climate, the amount of solar radiation reaching the earth's surface is also changing. In this regard, the monitoring and analysis of solar radiation over a region is important. Satellite data is good for the analysis of solar radiation because of its better spatial coverage compared to the ground measurements.
The sun is also the source of solar energy. Efficient use of solar energy not only decreases reliance on fossil fuels, but will also reduce environmental degradation associated with fossil fuels (Atilgan and Azapagic, 2015; Singh et al., 2011). Its availability over the earth's surface varies from place to place due to factors including latitude, elevation and cloud cover. The geographic location of South Africa is highly favorable for solar energy-based applications. Previous studies (Schulze and McGee, 1976; Drummond and Vowinckel, 1957) indicate that over South Africa daily insolation may reach up to 29 MJm-2. The population of South Africa is over 50 million and to satisfy energy demand sustainably renewable energy is necessary. Development of any country's renewable energy potential is important for sustainable development. Solar energy is considered as the most reliable renewable energy resources (Kleissl, 2013). It is freely available, but collecting and transforming it is not very much cost-effective (Kougias et al., 2016). Means of collecting solar energy include photovoltaic systems (PV), solar thermals (solar water heaters, solar hot water panel, solar hot water collector), and solar thermal and PV working together. Before installing any solar energy collecting device at any site it is advisable to perform a detailed analysis of the site, as any wrong information may lead to sub-optimal performance and unexpectedly poor economic returns. For example, the size and design of PV systems to be installed at any site should be decided after proper solar resource assessment (Munzhebdi and Sebitosi, 2009). To assess a site's solar energy potential, long-term solar radiation data is needed. Typical meteorological year (TMY) data have been also used in many solar resource assessment studies (Kleissl, 2013) - that is, a longterm average of solar irradiance. TMY data, which represent the typical conditions, might be less useful where substantial variability and extremes in weather are observed.
While information related to incoming solar radiation is valuable, observational solar radiation data is sparse. Radiometric stations provide data for single locations and sometime for a relatively short duration. In this case, satellite data are reliably sourced. There is no doubt that in situ observations are valuable but satellite data are arguably a better option due to their better spatial coverage. It is necessary to understand the characteristics of data carefully in order to use them for solar resource assessment, as requirements for different projects vary. The focus of solar radiation project on a PV installation requires mainly global horizontal irradi-ance (GHI) dataset, while concentrating solar power needs a direct normal irradiance (DNI) dataset. For some solar projects, exceedance probabilities (P10, P50, P90, P95 and P99) of GHI and DNI are also calculated. The present study aims to study SWFlux, from MERRA 2D reanalysis data (1980-2009) over the nine provinces (see details in Section 2). SWFlux data were analysed in all the provinces separately to understand its variation on provincial scale. The provinces were also ranked on the basis of available SWFlux. Studies based on rank are useful to convert large information into digestible information and it is easier to remember and present rank than actual values. In many renewable energy studies ranking method has been used (Şengül et al, 2015; Mohamadabadi et al. 2009; Goumas and Lygerou, 2000). Solar energy studies that focus on provinces can help governmental decision-making on a provincial scale. This study can also assist small-to-large solar energy investors, construction engineers, tourism industries and architects to plan activities and make decisions in their respective areas. It can also serve as a baseline for further studies related to solar energy potential using MERRA 2D data.
2. Study area and datasets
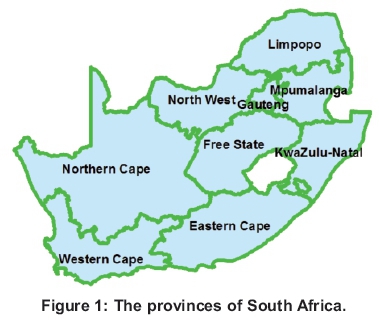
South Africa lies between 22°-34° S latitude and 16°-32° E longitude. On the west it is bounded by the Atlantic Ocean; on the south and east by the Indian Ocean; on the North by Namibia, Botswana and Zimbabwe; and by Mozambique and Swaziland on the north-east. There are nine provinces: Free State, Northern Cape, Western Cape, Gau-teng, Mpumalanga, North West, Limpopo, Kwa-Zulu-Natal and Eastern Cape (Figure 1). There are four primary climatic zones: desert (Northern Cape, North-Eastern parts of Western Cape); arid (Limpopo, Mpumalanga, North-West, Free State, the western parts of KwaZulu-Natal and the Eastern Cape); sub-tropical wet (coastal strip of KwaZulu-Natal and the Eastern Cape); and Mediterranean winter rainfall (south-western coastal strip of Western Cape) (JWAF 1999).
Monthly MERRA 2D datasets going back to 1979 were released in 2010 by the NASA, with data generated using Version 5 of the Goddard earth observing system atmospheric model and data assimilation system (Rienecker et al., 2011). These datasets are widely used in the scientific community (Chand et al., 2016; Bosilovich et al., 2011; Robertson et al., 2011; Schubert et al., 2011). The spatial resolution of the datasets is 2/3o (longitude) x 1/2o (latitude). More details on MERRA 2D data can be found at http://giovanni.sci.gsfc.nasa.gov/giovanni/. The present analysis used MERRA 2D monthly SWFlux.
3. Methodology
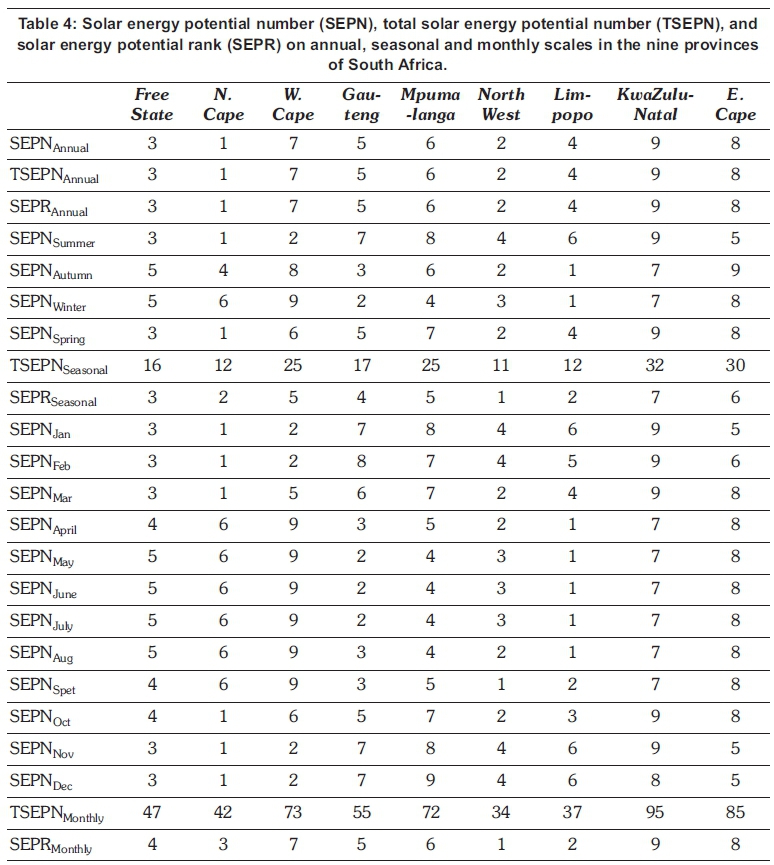
SWFlux data (1980-2009) were used to calculate long-term annual, seasonal and monthly means along with standard deviation (SD). These data were separated into three decades 1980s (19801989), 1990s (1990-1999) and 2000s (2000-2009) and analysed for annual, monthly and seasonal averages. Three metrics were calculated in order to compare the solar energy potential (based on the mean values) of provinces: solar energy potential number (SEPN), total solar energy potential number (TSEPN), and solar energy potential rank (SEPR). SEPN was calculated first by determining the mean values of SWFlux for each province, and those with maximum (minimum) SWFluxwere given a SEPN value of 1 (9), respectively. The same procedure was applied for annual, seasonal and monthly time scales. TSEPN was calculated as the sum of all the SEPNs. The smallest TSEPN was given the first rank and the largest TSEPN was given the last rank. The provinces where the values of SWFlux were equal were given equal rank.
4. 4. Results and discussions
4.1 Spatial variation of SWFlux from 1980 to 2009
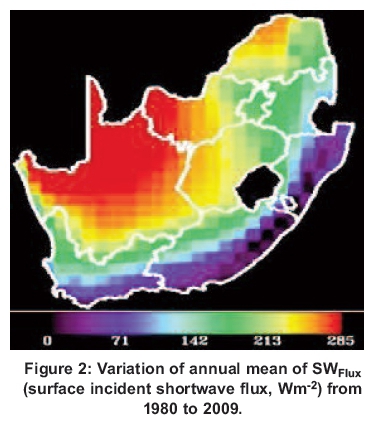
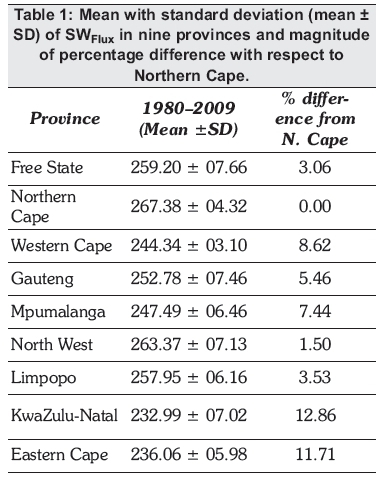
Solar radiation at any location depends upon the land elevation, sunshine duration, cloud cover, moisture and dust content (Singh et al., 2013; Drummond and Vowinckel, 1957). Figure 2 shows spatial variation of the annual mean SWFluxin South Africa from 1980 to 2009, where it can be clearly observed that the north and north-west regions of South Africa receives more solar radiation than the south and south-east. Annual, monthly and seasonal means are presented as mean ± SD. The monthly mean values of SWFlux (19802009) show that Northern Cape received the highest (267.38 ± 4.32 Wm-2) incoming solar radiation throughout the year, followed by the North West (263.37 ± 7.13 Wm-2) and Free State (259.20 ± 7.66 Wm-2); Limpopo also received a good amount of SWFlux (257.95 ± 6.16 Wm-2), while KwaZulu-Natal received the least (232.99 ± 7.02 Wm-2). The mean magnitude of percentage difference with respect to Northern Cape was also calculated (Table 1). The maximum was recorded by KwaZulu-Natal at 12.86% and the minimum by North West at 1.50%.
4.2 Variation of SWFlux in different seasons
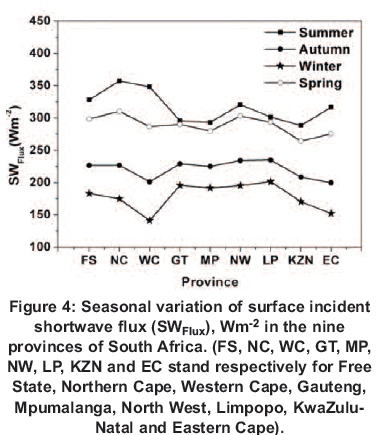
Figures 3 and 4 show that, SWFlux varied from season to season for the nine provinces. Northern Cape showed more SWFlux in summer than any other provinces, while Limpopo had more SWFlux in autumn (235 ± 4.61 Wnv2) and winter (201.60 ± 4.7 Wm-2). During summer, autumn, winter and spring the maximum (minimum) SWFluxwas in Northern Cape, 357.57 ± 7.51 Wm-2 (KwaZulu-Natal, 288.714 ± 10.02 Wm-2), Limpopo, 235 ± 4.61 Wm-2 (Eastern Cape, 199.74 ± 11.36 Wm-2), Limpopo, 201.60 ± 4.39 Wm-2 (Western Cape, 141.31 ± 8.57 Wm-2), and Northern Cape, 310.40 ± 6.9 Wm-2 (KwaZulu-Natal, 264.41 ± 10.76 Wm-2), respectively, as shown in Figure 4. Most areas in the Northern Cape during the winter showed less amount of SWFlux .The monthly mean of SWFlux with SD for 1980-2009 in the nine provinces is presented in Table 2, which shows that during the winter and autumn months Limpopo had higher SWFlux than other provinces. Present studies of SWFlux results on annual and seasonal scale show similarity to the maps generated using the United States National Renewable Energy Laboratory database (Fluri, 2009). These maps show that the solar radiation was higher in Northern Cape during summer and spring and lower in winter. The monthly mean values of SWFlux (1980-2009) with SD are presented in Table 2. In almost all the provinces the SWFlux was higher in December and lower in June.
4.3 Spatial variation of SWFlux over three decades
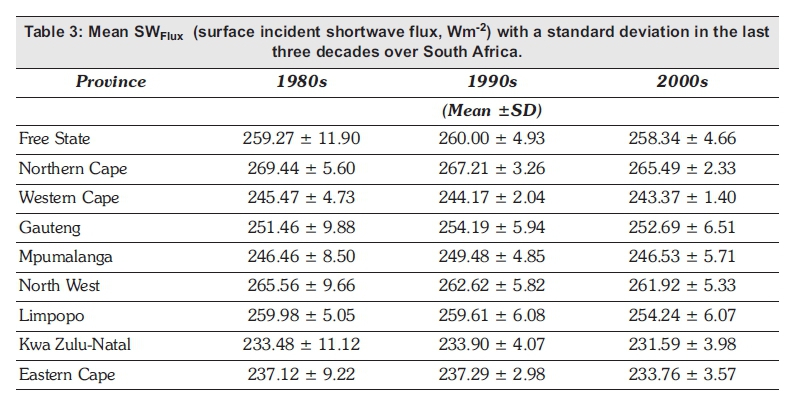
SWFlux was analysed spatially over the three decades of the datasets - the 1980s, 1990s and 2000s (Figure 5). SWFlux in Northern Cape was higher than in any other province in all three decades, the 1980s (269.44 ± 5.60 Wm-2), the 1990s (267.21 ± 3.26 Wm-2) and the 2000s (265.49 ± 2.33 Wm-2) (Table 3). The spatial variation of SWFlux show that the amount of solar radiation decreased each decade, a trend shared by other five provinces (North West, Limpopo, KwaZulu-Natal and Eastern Cape) (Figure 5). This could be attributed to increasing air pollution, which reduces the amount of solar radiation reaching the earth's surface (Gan et al., 2014, Singh et al., 2012).
4.4 SEPR for the nine provinces of South Africa
SEPR was calculated on annual, seasonal and monthly scales. Annually, the Northern Cape ranked first, followed by North West (Table 4). Seasonally the North West ranked first, followed by Northern Cape and Limpopo. The monthly scale showed that North West again ranked first, followed by Limpopo. KwaZulu-Natal did not performed well on annual, seasonal and monthly. The good solar energy potential of Northern Cape was reported previously (Fluri, 2009). The present study found that North West and Limpopo also showed good solar energy potential (Table 4). Concentrating solar power and PV are important for harvesting solar radiation from the recognised high solar energy potential areas.
5. Conclusions
In order to contribute to better understanding the solar energy potential of different provinces of South Africa, annual, seasonal, and monthly variability in SWFluxwas studied using MERRA 2D data (1980-2009). On an annual scale, SWFlux was found to be the highest for Northern Cape (267.4 ± 4.32 Wm-2), followed by North West (263.3 ± 7.13 Wm-2) and Free State (259.2 ± 7.66 Wm-2).
Seasonal scale SWFlux was highest in Northern Cape only during summer (357.57 ± 7.51 Wm-2) and spring (310.40 ± 6.9 Wm-2). Limpopo had the highest value of SWFlux in winter and spring; and some of its areas also received a good amount of solar radiation that could serve as good sites for solar energy based applications. SEPR analysis showed that the Northern Cape ranked first on an annual basis, while North West ranked first in seasonal and monthly analyses. The amount of SWFlux over Northern Cape was high. However, North West, Limpopo and Free State also received good amount of solar radiation.
Acknowledgements
I acknowledge South African Weather Service, Pretoria for support during the entire work. Analyses used in this study were produced with the Giovanni on-line data system, developed and maintained by the NASA GES DISC.
References
Atilgan, B. and Adisa A. 2015. Life cycle environmental impacts of electricity from fossil fuels in Turkey. Journal of Cleaner Production 106: 555-564. [ Links ]
Bosilovich M., Chen J., Robertson FR. and Adler R.F 2008. Evaluation of global precipitation in reanalyses. Journal of Applied Meteorology and Climatology 47(9): 2279-2299. [ Links ]
Chand, P, Sharma M. P., and Prasad R. N. 2016. Heterogeneity in fluctuations of glacier with clean ice-covered, debris-covered and proglacial lake in the Upper Ravi Basin, Himachal Himalaya (India), during the past four decades (1971-2013). In Singh, R, Schickhoff, U and Mal, S (eds) Climate change, glacier response, and vegetation dynamics in the Himalaya: 155-179. Springer. [ Links ]
Drummond, A.J. and Vowinckel, E. 1957. The distribution of solar radiation throughout Southern Africa. Journal of Meteorology 14(4): 343-353. [ Links ]
Earth data, Giovanni. http://giovanni.sci.gsfc.nasa.gov/giovanni/ (Retrieved on June, 2015). [ Links ]
Fluri, T.P The potential of concentrating solar power in South Africa. 2009. Energy Policy 37(12): 5075-5080. [ Links ]
Gan, C.M., Pleim, J., Mathur, R., Hogrefe, C., Long, C.N., Xing, J., Roselle, S. and Wei, C. 2014 Assessment of the effect of air pollution controls on trends in shortwave radiation over the United States from 1995 through 2010 from multiple observation networks. Atmospheric Chemistry and Physics 14(3): 1701-1715. [ Links ]
Goumas, M., and V. Lygerou. 2000. An extension of the PROMETHEE method for decision making in fuzzy environment: Ranking of alternative energy exploitation projects. European Journal of Operational Research 123(3): 606-613. [ Links ]
JAWF (Joint Agricultural Weather Facility), 1999. Major world crop areas and climate profiles. www.usda.gov/oce/waob/jawf/profiles/mwcacp2.htm (Retrieved on May, 2015). [ Links ]
Kleissl, J. 2013. Solar energy forecasting and resource assessment. Academic Press. [ Links ]
Kougias, I., Szabó, S., Monforti-Ferrario, F, Huld, T. and Bódis, K. 2016. Methodology for optimization of the complementarity between small-hydropower plants and solar PV systems. Renewable Energy 87: 1023 1030. [ Links ]
Mohamadabadi, H. Safaei, G. Tichkowsky, and A. Kumar. 2009. Development of a multi-criteria assessment model for ranking of renewable and non-renewable transportation fuel vehicles. Energy 34(1): 112-125. [ Links ]
Munzhedzi, R. and Sebitosi, A.B. 2009. Redrawing the solar map of South Africa for photovoltaic applications. Renewable Energy 34(1):165-169. [ Links ]
Rienecker, M.M., Suarez, M.J., Gelaro, R., Todling, R., Bacmeister, J., Liu, E., Bosilovich, M.G., Schubert, S.D., Takacs, L., Kim, G.K. and Bloom, S. 2011. MERRA: NASA's modern-era retrospective analysis for research and applications. Journal of Climate 24(14): 3624-3648. [ Links ]
Robertson, FR., Bosilovich, M.G., Chen, J. and Miller, T.L. 2011. The effect of satellite observing system changes on MERRA water and energy fluxes. Journal of Climate 24(20): 5197-5217. [ Links ]
Schulze, R. E., and O. S. McGee. 1976. Winter and summer insolation patterns for Southern Africa. South African Journal of Science, 72:182 183. [ Links ]
Schubert, S., Wang, H. and Suarez, M. 2011. Warm season subseasonal variability and climate extremes in the northern hemisphere: The role of stationary Rossby waves. Journal of Climate 24(18): 47734792. [ Links ]
Şengül, Ü., Eren, M., Shiraz, S.E., Gezder, V. and Sengül, A.B. 2015. Fuzzy TOPSIS method for ranking renewable energy supply systems in Turkey. Renewable Energy 75: 617-625. [ Links ]
Singh, J., Kumar, M. and Bhattacharya, B.K. 2011. Solar energy potential of two metropolitan cities of India. In Pradhan, R.P (ed). Infrastructure - the key to development. Proceedings of International Conference on Infrastructure Finance (ICIF 2010) held jointly by Vinod Gupta School of Management and RCG School of Infrastructure Design and Management, Indian Institute of Technology Kharagpur on June 03-05, 2010. Macmillan India. [ Links ]
.Singh, J., Bhattacharya, B.K., Kumar, M. and Mallick, K. 2013. Modelling monthly diffuse solar radiation fraction and its validity over the Indian sub-tropics. International Journal of Climatology 33(1):77-86. [ Links ]
Singh, J., Bhattacharya, B. K., Kumar, M. 2012. Solar Radiation and Evaporation Trend over India. Journal of Earth Science and Engineering, 2(3): 160-165. [ Links ]
* Corresponding author: Tel: +2712 367 6049. Email: jsinghenv@gmail.com

