


Services on Demand
Article
 English (pdf)
 Article in xml format
 Article references
Indicators

Related links
-
 Cited by Google
 -
 Similars in Google
Share

 Permalink
Journal of Energy in Southern Africa
On-line version ISSN 2413-3051
Print version ISSN 1021-447X
J. energy South. Afr. vol.27 n.3 Cape Town Aug. 2016
RESEARCH ARTICLE
Varying percentages of full uniform shading of a PV module in a controlled environment yields linear power reduction
Arthur James Swart; Pierre E. Hertzog*
Department of Electrical, Electronics and Computer Engineering, Central University of Technology, Private Bag X20539, Bloemfontein, 9300
ABSTRACT
Partial shading of a PV module has received much attention over the past few years, as it results in uneven cell power generation, compromising a PV system performance. Full uniform shading of a PV module has not received as much attention. This article correlates the percentage of full uniform shading of a given PV module within a controlled environment to its output power. The percentage of full uniform shading provided by shade nets was firstly determined. These shade nets are then used to cover a specific PV module (experimental system), while an identical PV module remains totally unshaded (control system). Increasing percentages of full uniform shading negatively affected the direct beam component in a linear way. Decreasing the light intensity falling on the PV model exhibited a linear increase in the percentage of output power reduction of the PV module. This is observed in that a shade net providing 36% of full uniform shading resulted in a 56% output power reduction, while a 63% full uniform shading net yielded 82% power reduction. These results hold a strong promise to improve current simulation modules that focus on determining the output power of a given PV array under specific environmental conditions or for specialised geographical locations.
Highlights
1. Six different shade nets were quantified using the shading experiment.
2. A 36% shade net resulted in a 56% output power reduction.
3. A 63% shade net yielded 82% power reduction.
Keywords: partial shading, PV simulation, shade net
1. Introduction
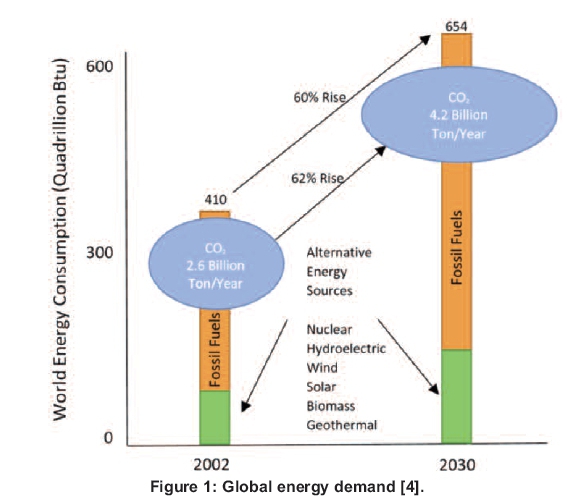
'Almost every way we make electricity today, except for the emerging renewables and nuclear, puts out carbon dioxide. And so, what we're going to have to do at a global scale is create a new system. And so, we need energy miracles' [1]. Energy miracles, as referred to by Bill Gates, require on-going research into developing and understanding new energy systems, including renewable energy systems in the form of photovoltaic (PV) systems [2]. The PV systems still require much research and development in order to improve efficiency and reduce manufacturing costs. In fact literature states that an ever-increasing need to improve the efficiency of energy production still exists today [3], especially in view of the ever increasing global demand, as shown in Figure 1. This demand has a potential to not only necessitate the production of more energy (an increase of 60% by 2030), but also the increase of carbon dioxide by an even greater percentage (an increase of 62% by 2030).
The efficiency of PV cells varies depending on the technology, light spectrum, atmospheric conditions, temperature, design and material used, and can be up to 46% efficient [5]. The conventional solar PV panels have a conversion efficiency of only 5-17% [6]. Interrupting direct beam radiation lowers the output voltage of a PV module significantly, influencing the amount of output power available for driving an alternative energy system, which may lead to system downtime or even component failure over a period of time [7]. This interruption is usually due to cloud movement or shading of the PV module by natural or man-made causes. Partial shading of a PV module has received much attention over the past few years, as it results in uneven cell power generation that my compromise total power production [8]. Numerous simulation models were proposed to study the effect of partial shading, including the model by Tian et al. [9]. A Google Scholar Search of the terms 'partial shading' and 'photovoltaic' revealed some 3510 hits in December 2014, while the words 'uniform shading' and 'photovoltaic' revealed only 95 hits in that same month.
It must therefore be noted that research relating to the exact effect that varying percentages of full uniform shading exert on the output power of a PV module is lacking. For example, Giaffreda et al. [10] contrasted full uniform shading to partial shading of a PV cell and proved that its cell temperatures increased when shaded. No percentages of varying shade were, however, reported, nor the effect on the output power. Results given by Christy regarding shading suggested that the reduction in current was not proportional to the amount of shading on the PV panel [11]. Again, no varying percentages of full uniform shading were reported. Gummeson et al. [12] reported that a fully-shaded 11.4 cm2 PV module produced 29 times less power than the same PV module under bright indoor lighting conditions. Again, no percentages of full shade were mentioned, although a significant power reduction was given. Johnson [13] used Blue Hawk 4 mm thick, heavy-duty plastic sheeting to cover the top of PV modules to provide varying levels of insolation, which included unshaded, partially shaded and fully shaded modules. Power reduction was found to be around 33% for full uniform shading. Again, no varying percentages of shading were used.
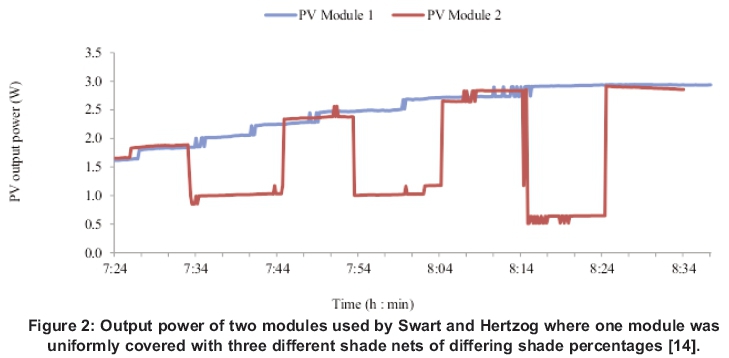
In 2014, Swart and Hertzog [13] contributed towards quantifying the percentage of uniform shading of a PV module, correlating it to the PV module's output power. This study was, however, based on using only three shade nets to uniformly cover a specific PV module around 8 a.m., when maximum solar radiation is not present (see Figure 2). Furthermore, this study featured only two samples of data that were recorded using a PICOLOG data recorder. It can, therefore, be asked whether increasing the number of samples would not indicate a linear relationship between incoming light intensity and output power reduction of the PV module, as opposed to a non-linear relationship expressed by Swart and Hertzog [13].
This article correlates the effect exerted by six different percentages of full uniform shading on the output power of a PV module in a controlled environment. Ten different samples were recorded with an Arduino device connected via LABVIEW over a four-month period at noon, when radiation is at its maximum value. Reasons for using the Arduino device along with the LABVIEW software are given. The percentage of full uniform shading equates to the percentage of light intensity of the direct beam component that has a direct effect on power production. Included is the literature pertaining to the importance of direct beam radiation, with varying percentages of full uniform shading being equated to diffuse radiation. Next the methodology and the two practical setups are described. Results are presented in sketches, tables and photographs, followed by conclusions.
2. Direct and diffused beam radiation
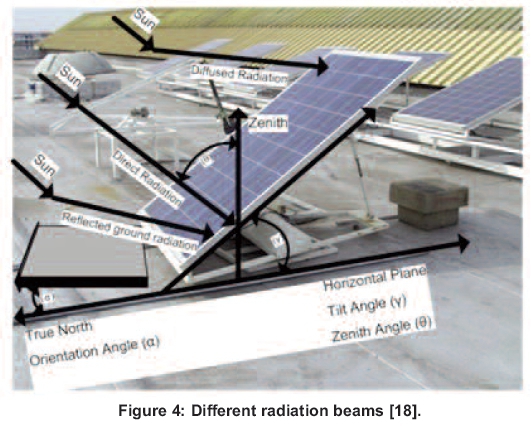
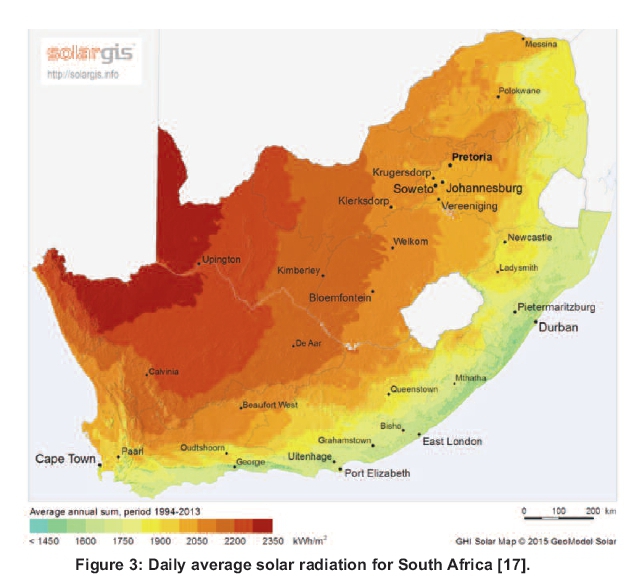
The PV modules receive direct (beam), diffused and reflected ground radiation during varying atmospheric conditions [15]. Direct radiation is the part which travels unimpeded through space and the atmosphere to the surface of the earth, while diffused radiation is the part scattered by atmospheric constituents such as molecules, aerosols and clouds [16]. Figure 3 illustrates the annual sum of global horizontal radiation for South Africa and Figure 4 shows the difference between reflected, direct and diffused radiation. The annual aggregate for Bloemfontein, South Africa, borders around 2050 kWh/m2. The highest recorded values are around Upington, while the coastal regions around Durban have the lowest values. It is essential that as much as possible of this global horizontal irradiation reaches the surface of a PV module by means of direct radiation.
Wenham et al. [19] reported that, on a cloudy day, all the incoming radiation is assumed to be diffused, with intensity approximately equal to 20% of the direct beam component. Cloudy conditions, as well as air pollution, therefore inhibit direct radiation, giving rise to diffuse radiation, which is not conducive to optimum PV performance [18]. Diffuse radiation on a PV module could take many forms, including shading from:
• a tree in summer (all leaves present),
• a tree in winter (no leaves present),
• condensation trails,
• thin clouds, and
• thick clouds.
These forms of diffused radiation do not all exhibit the same percentage of shading. For example, evergreen trees provide a higher percentage of shading than deciduous trees [20]. Furthermore, research has shown that appropriate positioning of large trees near buildings could save approximately 4.7% in cooling demand and 3.3% of electricity [21]. These varying types and sizes of trees all exhibit different percentages of shading that could impact differently on the output power of a PV module installed within its reach.
Condensation trails (also called contrails or vapor trails) are aircraft-generated cirrus clouds that often form in the absence of other cirrus clouds in ice-supersaturated conditions at temperatures less than -39 °C [22]. Since such conditions are relatively common in the upper troposphere, contrails can develop into relatively long-lived cirrus cloud [23]. They can add to naturally occurring cloud cover and may be important for the earth's radiative balance [24]. Persistent contrails are an important climate impact of aviation that could potentially be reduced by re-routing aircraft. This, however, generally increases both the flight length and its corresponding CO emissions [25]. Contrails are visible for several minutes, or even longer when the relative humidity is slightly below saturation, in particular at low temperatures [26]. A national flight operator in South Africa has a number of scheduled flights between Johannesburg and Port Elizabeth, with the flight path often being directly over Bloemfontein [27]. This results in a number of contrails that are visible on the ground, especially during the colder winter months. However, these contrails may be considered to be cirrus-clouds that are usually optically thin in the sub millimeter [28], as shown in Figure 5.
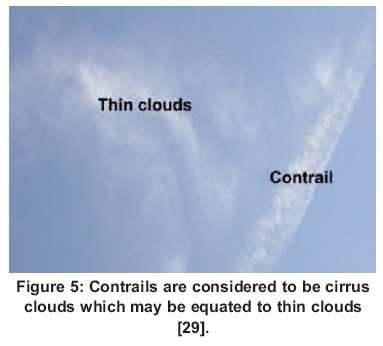
Figure 5 shows that thin clouds are relatively transparent to sunlight [30], thereby providing a lower percentage of shading on the earth's surface when compared to thick clouds. These thin clouds are hard to identify on satellite images because they either reflect too little solar radiation or block too little terrestrial emission [31], while thick clouds are easier to detect [32]. Thick clouds are easy to distinguish because they are obviously brighter, and usually gathered together, forming a large block [33], resulting in a larger percentage of shading on the earth's surface. PV modules, being exposed to both thin and thick clouds, are subjected to varying percentages of shading [34].
These varying percentages of shading have the potential to negatively influence PV-based systems, such as PV/hydro hybrid renewable energy systems or innovative solar vehicles. In turn, these hybrid generators could be used as a standby power source for remote sites [35] where an important requirement would be the availability of direct beam radiation. In terms of solar vehicles, the size of the PV system is usually determined according to the power and voltage requirements of the electrical motor [36]. Direct beam radiation, as opposed to diffuse beam radiation, makes up the majority of total solar radiation and is required for the optimal operation of these types of energy generator systems and vehicles [37]. Quantifying the percentage of full uniform shading of a given PV module to its output power may assist in optimising the design and development of these types of hybrid generators and solar vehicles for varying percentages of direct beam radiation.
3. The PV technology
A typical PV cell generates around 0.6 V, depending on the type of semiconductor used and the manufacturing technology employed [38]. To increase the voltage and current requires several cells to be connected in series and/or parallel to form a PV module. The working principle of a PV cell is based on the 'photovoltaic effect' in that when sunlight falls on a cell that consists of a normal p-n junction, photons are absorbed, resulting in electron-hole pairs being generated [39]. Essentially, circuits that contain semiconductor devices are non-linear, most obviously for devices such as diodes and silicon-controlled rectifiers where the IV characteristics change abruptly [40]. The characteristics of PV cells are therefore non-linear, depending to a large degree on environmental parameters like temperature, solar irradiation, shading, humidity and pressure [41]. It may, therefore, be hypothesised that the relationship between the incoming light intensity and the output power of a PV module is non-linear. One aim of this research is to either support or reject this hypothesis.
4. Research methodology
The first objective of this study is to quantify the percentage of the direct beam radiation that passes through the six different shade nets that will be used in the full uniform shading of the PV modules. This was done using two methods. In the first method, a constant light source, light sensor and two black cylinders (see Section 5 for setup) were used. Multiple tests done on the same day results in a higher reliability coefficient than does a test-retest on separate days [42]. A number of tests were, therefore, done on the same day, using both an analogue light intensity meter (PHYWE) and a digital light intensity meter (ISO-TECH). This was done to verify the percentages of light reduction that were stated by the manufacturers of the shade nets. A second method involved placing the shade nets directly over the sensor (placed at the same tilt angle as are the PV modules) of the light intensity meter, using the sun as the light source.
The second study objective is to correlate the different percentages of full uniform shading to the output power of a PV module (termed PV Module 2). Each shade net was used to cover PV Module 2 for one minute (experimental system), with one-minute intervals where no shading was used. This enabled PV Module 2 to return to normal operation in line with PV module 1, which remained completely unshaded (control system) for the duration of the tests. Multiple samples were acquired on different days of the months (May-August 2014) around 11:30 am, as maximum solar radiation occurred around noon. The reasons for using this time period was the low rainfall during these months at the research site.
The multiple samples within a natural setting ensured reliability and validity of the results. The reliability of a study begins to decrease when it becomes more difficult to replicate the results [43], and would therefore be increased if the same results were obtained over a period of time.
5. Practical setup 1: Determining shading percentages
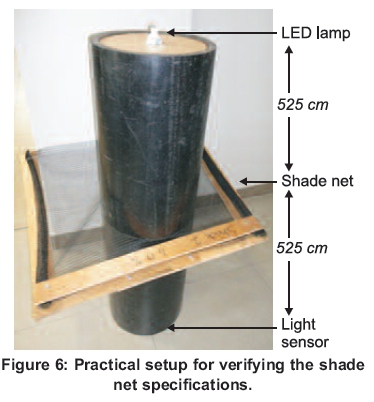
A constant light source, light sensor and cylinders were used in order to establish an environment with minimum influence from external light. Two black cylinders (each 525 cm long and 27 cm in diameter) were staked upon each other (see Figure 6). The top cylinder was sealed from external light and a 12 V, 3 W (230 lm) light-emitting diode (LED) lamp was securely mounted in the centre of the top cylinder as a light source. In the control system, the LED lamp was switched on and the light intensity measured using an analogue PHYWE light intensity meter (light sensor mounted at the bottom of the bottom cylinder) and a digital ISO-TECH light intensity meter. Six different percentages of shade net were placed between the top and bottom cylinders (525 cm from the light source and light sensor) in the first method. In this instance, light from the light source would have to travel through the shade net to reach the light sensor. This light intensity was measured to enable the exact calculations of the shading percentages. These shade nets were then used in the practical setup of the PV system. In the second method, the sensors of the light meters were placed at the same tilt angle of the PV modules. The shade nets were then placed directly over the sensors, just as the shade nets would be placed directly over the surface of the PV modules. Three different samples were obtained from which the averages values were used.
6. Practical setup 2: Identical PV systems
No batteries were included in the practical setup of the two identical PV systems because of uncertain variations that might exist between batteries from the same manufacturer and with the same model number. In fact, battery-to-battery variations in electromotive force at a given state of charge could be in the order of 50 mV due to variations in the manufacturing process, ageing and charge-discharge cycling of a single 2.25 V cell [44]. A 60 LED lamp (12 V, 3 W) was, therefore, chosen as the load resistance that was connected directly to the PV module via a 22 Ω resistor. The purpose of the series resistor was to raise the threshold operating voltage and ensure that the voltage across the LED never exceeded 12 V, as the stated output voltage of the PV module used was 16.5 V at standard test conditions. The threshold operating voltage is the point at which the LED starts emitting light, despite being very faint. A data logging interface was included between the PV module and the LED lamp, which served to condition the voltage and current from the PV module to enable logging via an ARDUINO board to a PC. This circuit was based on Swart [45] and Asowata [46, 47].
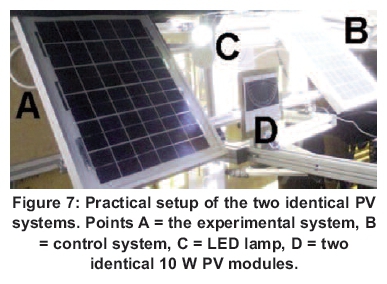
The ARDUINO board is an electronic platform designed to simplify the process of studying digital electronics, and comprises a microcontroller, a programming language and an integrated development environment [48]. The ARDUINO was established to teach interaction design, a design discipline that puts prototyping at the centre of its methodology [49]. The hardware is relatively cheap and the development software can be downloaded for free from the internet. There are also a growing number of freely-available software examples that make the implementation of ideas on these boards easier to achieve. Academics from different fields make extensive use of these ARDUINO boards [5052]. These boards are used in conjunction with the National Instruments LabVIEW software, a graphical programming language that has its roots in automation control and data acquisition [53]. The LabVIEW has several key features that make it a good choice in an automation environment and includes simple network communication, turnkey implementation of common communication protocols, powerful toolsets for process control and data fitting, fast and easy user interface construction, and an efficient code execution environment [54]. The practical setup is shown in Figure 7. Six different shade nets (with exact measured and calculated shading percentages) were placed over PV Module 2 (becoming the experimental system - Point A in Figure 7), while PV Module 1 remained completely unshaded (becoming the reference or control system - Point B in Figure 7). An aluminum frame, with a protractor placed 90° due North, was constructed to securely mount the two identical 10 W PV modules (Point D in Figure 7). This protractor was used to verify the direct alignment of the sun to the PV modules at 12:00. The modules were mounted at the same tilt angle of 39°, equating to the latitude value of 29° plus 10° for the Central University of Technology, Bloemfontein. Values of latitude plus 10° for PV module tilt angles in South Africa were suggested by Chinnery [55] and substantiated by Asowata [56]. The practical setup was done inside an air-conditioned room where the temperature was kept constant at 24 . This was in order to prevent excess temperature degradation that has a significant effect on the output voltage of a PV module [57]. Due to the low output power of these PV modules as well as the short period of time (one minute) in which the shading nets were applied, no significant temperature differences between the two modules were observed. The current through the LED lamp (Point C in Figure 7 indicating that Module 1 is completely unshaded) as well as the voltage across it was logged for both the control and the experimental system.
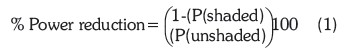
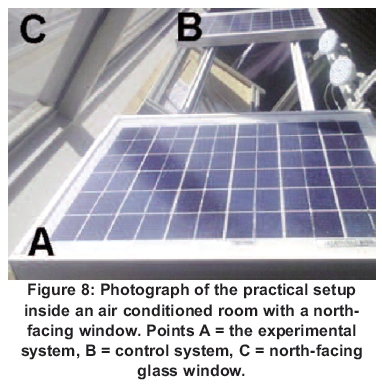
These voltage and current values (for both the experimental and control system) were then used to calculate the output power of the PV module, with the percentage of power reduction being calculated using Equation 1. The aluminum frame was placed against a north-facing large glass window (Point C in Figure 8). Point A represents Module 2 (experimental system) and Point B represents Module 1 (control system) in Figure 8.
7. Results and discussion
The results of the shading experiment are shown in Figure 9. Using both the noon SUN and two different LEDs (3 W and 4 W) revealed similar results using the different shade nets that were sandwiched between two black pipes, according to Figure 6. The 22% shade net (Net 1) allowed 80% of light to pass, while a 42% shade net (Net 3) allowed 60% of light to pass. A 92% shade net (Net 6) only allowed 10% of light to pass. This, consequently, yielded a negative linear relationship (R2 = 0.9807) between shade net percentage increase and light intensity decrease. The results for the 3 W LED, 4 W LED and the SUN-2Pipes were recorded using the first method described in Section 5 in relation to Figure 6. The second method, using only the sun and shade nets placed directly over the tilted sensor of the light meters (thereby replicating the setup of the shade nets and PV modules), provided the results given for the SUN experimental setup shown in Figure 9.
Figure 10 shows the power reduction for a PV module (PV Module 2 represented by the yellow line), which was exposed to six shade nets with different shading percentages. This sketch is obtained from the LabVIEW interface that was developed for this investigation. The sampling interval was set at one second and the different shade nets were used in one-minute intervals in order to give the system an opportunity to stabilise after each given event. The PV Module 1 (red line) exhibited a continuous output power and served as a control experiment. Figure 10 shows evidence of power reduction for each increase in shade net percentage. This trend was reversed as smaller percentages of uniform shade net were, subsequently, used from 11:09 to 11:22. Large overshoots occurred when the shade net was placed over the PV module and when it was removed, as the boundary around the shade net is composed of solid wood.
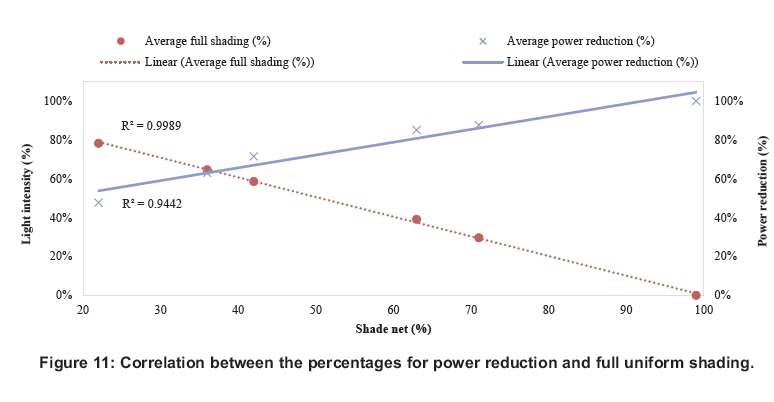
Figure 11 illustrates a correlation of output power with the percentage of full uniform shading of a given PV module within a controlled environment. These results were averaged from four samples taken on four days within the same week of August 2014. The percentage of full uniform shading equated to the percentage of light intensity of the direct beam component, which was not proportional to the output power of the PV module (e.g. 22% shading allows 78% of light to pass which results in a 48% reduction in output power). A negative linear relationship occurred (R2 = 0.9989) between the average full shading percentage and the percentage of light intensity, as shown in Figure 11. A positive linear relationship (R2 = 0.9442), however, occurred between the percentage of light intensity and the reduction in output power of a PV module. This indicates that there was a linear relationship between the percentages of full uniform shading and the output power reduction of a PV module under controlled environmental conditions.
8. Conclusions
The purpose of this investigation was to quantify the percentages of full uniform shading of a given PV module within a relatively pollution-free environment, correlating it to the output power of the module. Several load alternatives were investigated and a 60 LED lamp with a 22 ohm series resistor were chosen, based on previous research done by Swart and Hertzog [2]. Six different shade nets were quantified using the shading experiment encompassing two different methods (outlined in Section 4). Two identical PV systems were used, where PV Module 1 was the control system and PV Module 2 was the experimental system. Results show a negative linear relationship between the average percentage of full shading and the percentage of light intensity, which was allowed to pass through the shade nets. Results further show a positive linear relationship between the average percentage of full shading and the reduction in output power of a PV module. This was caused by a 36% shade net that provided a 63% output power reduction, while a 63% shade net provided 85% power reduction. The hypothesis stating that a non-linear relationship existed between the incoming light intensity and the output power of a PV module, is therefore rejected. These results may be used in future investigations to classify the amount of power reduction given by thick and thin clouds, including contrails left by commercial airplanes. These values may also assist in improving current simulation modules that focus on determining the output power of a given PV array under specific environmental conditions or for specialised geographical locations.
References
[1] Gates, B. (2016, 20 August). Bill Gates Quotes at Brainyquote.Com. Available: www.brainyquote.com/quotes/quotes/b/billgates412407.html [ Links ]
[2] Hertzog, P and Swart, A. Quantifying the Effect of Varying Percentages of Full Uniform Shading on the Output Power of a Pv Module in a Controlled Environment, presented at the SATNEC 2014, 2014. [ Links ]
[3] Karim, G. A. Fuels, Energy, and the Environment. Boca Raton: CRC Press, 2012. [ Links ]
[4] Bose, B. K. Global Warming: Energy, Environmental Pollution, and the Impact of Power Electronics. Industrial Electronics Magazine, IEEE, 4, 6-17, 2010. [ Links ]
[5] Taguchi, M., Yano, A., Tohoda, S., Matsuyama, K., Nakamura, Y., Nishiwaki, T., et al. 24.7% Record Efficiency Hit Solar Cell on Thin Silicon Wafer. IEEE Journal of Photovoltaics, 4, 96-99, 2014. [ Links ]
[6] Raval, H. D., Maiti, S. and Mittal, A. Computational Fluid Dynamics Analysis and Experimental Validation of Improvement in Overall Energy Efficiency of a Solar Photovoltaic Panel by Thermal Energy Recovery. Journal of Renewable and Sustainable Energy, 6, 033138, 2014. [ Links ]
[7] Swart, A. J., Schoeman, R. M. and Pienaar, H. C. Ensuring Sustainability of Pv Systems for a Given Climate Region in South Africa, presented at the AFRICON 2013, Mauritius, 2013. [ Links ]
[8] Kim, K. A. Voltage-Offset Resistive Control for Photovoltaics. 2012. [ Links ]
[9] Tian, Y, Xia, B., Sun, W., Xu, Z. and Zheng, W. Modeling and Global Maximum Power Point Tracking for Photovoltaic System under Partial Shading Conditions Using Modified Particle Swarm Optimization Algorithm. Journal of Renewable and Sustainable Energy, 6, 1-16, 2014. [ Links ]
[10] Giaffreda, D., Omana, M., Rossi, D. and Metra, C. Model for Thermal Behavior of Shaded Photovoltaic Cells under Hot-Spot Condition, Defect and Fault Tolerance in VLSI and Nanotechnology Systems (DFT), 2011 IEEE International Symposium on, 2011, 252-258. [ Links ]
[11] Christy, D. W., An Experimental Evaluation of the Performance of the Amorphous Silicon Pv Array on the Ncsu Afv Garage, Masters of Science, Mechanical Engineering, North Carolina State University, Raleigh, 2007. [ Links ]
[12] Gummeson, J., Clark, S. S., Fu, K. and Ganesan, D. On the Limits of Effective Hybrid Micro-Energy Harvesting on Mobile Crfid Sensors, Proceedings of the 8th international conference on Mobile systems, applications, and services, 2010, 195-208. [ Links ]
[13] Johnson, Z. S., Module-Level Power Converters for Parallel Connected Photovoltaic Arrays, Master of Science, Missouri University of Science and Technology, Missouri, 2012. [ Links ]
[14] Swart, A. J. and Hertzog, P E. Quantifying the Effect of Varying Percentages of Full Uniform Shading on the Output Power of a Pv Module in a Controlled Environment, presented at the SATNAC 2014, Boardwalk Conference Centre, Nelson Mandela Bay, South Africa, 2014. [ Links ]
[15] El-Sebaii, A. A., Al-Hazmi, F S., Al-Ghamdi, A. A. and Yaghmour, S. J. Global, Direct and Diffuse Solar Radiation on Horizontal and Tilted Surfaces in Jeddah, Saudi Arabia. Applied Energy, 87, 568-576, 2010. [ Links ]
[16] Ramachandra, T. V. and Shruthi, B. V. Spatial Mapping of Renewable Energy Potential. Renewable and Sustainable Energy Reviews, 11, 1460-1480, 2007. [ Links ]
[17] New Solar Resource Maps for South Africa [Online]. Available: http://energy.org.za/news/158-new-solar-resource-maps-for-south-africa [ Links ]
[18] Swart, A. J., Pienaar, H. C. and Schoeman, R. M. Assessing the Effect of Variable Atmospheric Conditions on the Performance of Photovoltaic Panels: A Case Study from the Vaal Triangle, presented at the SAEEC 2011, Emperor's Palace Convention Centre, Johannesburg, 2011. [ Links ]
[19] Wenham, S. R., Green, M. A., Watt, M. E. and Corkish, R. Applied Photovoltaics, 2nd ed. Cornwall: TJ International Ltd, 2007. [ Links ]
[20] Gardner, D. S. and Goss, R. M. Management of Turfgrass in Shade. Turfgrass: Biology, Use, and Management, 219-247, 2013. [ Links ]
[21] Shultz, J., Witmer, L., Rey, J. E. and Brownson, S., Impact of Shade on Hvac Energy Consumption in Buildings: A Residential Case Study, The Pennsylvania State University, 2011. [ Links ]
[22] Minnis, P, Duda, D. P, Palikonda, R., Bedka, S. T., Boeke, R., Khlopenkov, K., et al. Estimating Contrail Climate Effects from Satellite Data. American Institute of Aeronautics and Astronautics, 1-12, 2011. [ Links ]
[23] Bock, L. and Burkhardt, U. The Temporal Evolution of a Long-Lived Contrail Cirrus Cluster: Simulations with a Global Climate Model. Journal of Geophysical Research: Atmospheres, 121, 3548-3565, 2016. [ Links ]
[24] Duda, D. P, Minnis, P, Khlopenkov, K., Chee, T. L. and Boeke, R. Estimation of 2006 Northern Hemisphere Contrail Coverage Using Modis Data. Geophysical Research Letters, 40, 612-617, 2013. [ Links ]
[25] Irvine, E., Hoskins, B. and Shine, K. A Simple Framework for Assessing the Trade-Off between the Climate Impact of Aviation Carbon Dioxide Emissions and Contrails for a Single Flight. Environmental Research Letters, 9, 064021, 2014. [ Links ]
[26] Schumann, U. and Graf, K. On the Life Time of Contrail Cirrus, EGU General Assembly Conference Abstracts, 2012, 3768. [ Links ]
[27] Flight Schedule Timetables South African Airways [Online]. Available: www.flysaa.com/za/en/plan-mytrip/schedulesroutes/flight_schedules.html [ Links ]
[28] Evans, K. F, Walter, S. J., Heymsfield, A. J. and Deeter, M. N. Modeling of Submillimeter Passive Remote Sensing of Cirrus Clouds. Journal of Applied Meteorology, 37, 184-205, 1998. [ Links ]
[29] Grissom, R. A. Clouds Create Dramatic Skies | Unc Charlotte Urban Institute, ed, 2016. [ Links ]
[30] Groisman, P Y., Karl, T. R. and Knight, R. W. Observed Impact of Snow Cover on the Heat Balance and the Rise of Continental Spring Temperatures. Science, 263, 198-200, 1994. [ Links ]
[31] Sun, W., Videen, G., Kato, S., Lin, B., Lukashin, C. and Hu, Y. A Study of Subvisual Clouds and Their Radiation Effect with a Synergy of Ceres, Modis, Calipso, and Airs Data. Journal of Geophysical Research: Atmospheres (1984-2012), 116, 2011. [ Links ]
[32] Ahmad, A., Aboobaider, B. M., Ghani, M., Abdul, K., Razali, S., Isa, S. M., et al. A Localised Cloud Detection and Masking Method Using Spectral Analysis. Australian Journal of Basic & Applied Sciences, 7, 2013. [ Links ]
[33] Yu, Y. D., Yang, X. B., Xiao, S. J. and Lin, J. L. Automated Ship Detection from Optical Remote Sensing Images. Key Engineering Materials, 500, 785-791, 2012. [ Links ]
[34] Chowdhury, S. R. and Saha, H. Maximum Power Point Tracking of Partially Shaded Solar Photovoltaic Arrays. Solar energy materials and solar cells, 94, 1441-1447, 2010. [ Links ]
[35] Meshram, S., Agnihotri, G. and Gupta, S. Advanced Photovoltaic/Hydro Hybrid Renewable Energy System for Remote Areas. Journal of Renewable and Sustainable Energy, 6, 13140, 2014. [ Links ]
[36] Dayem, A. M. A. Set-up and Performance Investigation of an Innovative Solar Vehicle. Journal of Renewable and Sustainable Energy, 4, 033109, 2012. [ Links ]
[37] Robinson, J. and Raichle, B. Performance Comparison of Fixed, 1-, and 2-Axis Tracking Systems for Small Photovoltaic Systems with Measured Direct Beam Fraction, Appalachian State University. Proceedings of the World Renewable Energy Forum, WREF2012, 2012, 1317. [ Links ]
[38] Mori, I., Kubota, M. and Mita, Y. A Test Structure of Bypass Diodes for on-Chip High-Voltage Silicon Photovoltaic Cell Array, Microelectronic Test Structures (ICMTS), 2014 International Conference on, 2014, 157-160. [ Links ]
[39] Salmi, T., Bouzguenda, M., Gastli, A. and Masmoudi, A. Matlab/Simulink Based Modelling of Solar Photovoltaic Cell. International Journal Of Renewable Energy Research, 2, 1-8, 2012. [ Links ]
[40] Xia, L., Farooq, M. U., Bell, I. M., Hussin, F A. and Malik, A. S. Survey and Evaluation of Automated Model Generation Techniques for High Level Modeling and High Level Fault Modeling. Journal of Electronic Testing, 29, 861877, 2013. [ Links ]
[41] Hemalatha, J., Hariprasad, S. and Anitha, G. Performance Evaluation of Single Ended Primary Inductance Converter for Photo Voltaic Applications, Emerging Research Areas: Magnetics, Machines and Drives (AICERA/iCMMD), 2014 Annual International Conference on, 2014, 1-8. [ Links ]
[42] Thomas, J. R., Nelson, J. K. and Silverman, S. J. Research Methods in Physical Activity, 6th ed. Champaign: Human Kinetics, 2010. [ Links ]
[43] Hesse-Biber, S. N. Mixed Methods Research: Merging Theory with Practice. New York: Guilford Publications, 2010. [ Links ]
[44] Gopikanth, M. L. and Sathyanarayana, S. Impedance Parameters and the State-of-Charge. Ii. Lead-Acid Battery. Journal of Applied Electrochemistry, 9, 369-379, 1979/05/01 1979. [ Links ]
[45] Swart, A. J., Pienaar, H. C. and Schoeman, R. M. Cost-Effective Energy Monitoring of Domestic Off-Grid Pv Systems, presented at the APPEEC 2013, Beijing Yanshan Hotel, Beijing, China, 2013. [ Links ]
[46] Asowata, O., Swart, A. J. and Pienaar, H. C. Evaluating the Effect of a Stationary Pv Panel on the Charging Rate of Deep-Cycle Valve-Regulated Lead-Acid Batteries, presented at the AFRICON 2013, Mauritius, 2013. [ Links ]
[47] Asowata, O., Swart, J. and Pienaar, C. Evaluating the Effect of Orientation Angles on the Output Power of a Stationary Photovoltaic Panel. JRSE, Journal of Renewable and Sustainable Energy, 6, 1-9, 2014. [ Links ]
[48] Martins, A., Lourengo, J., Patricio, T. and de Alexandria, A. Sensor Kinect in a Telepresence Application. Computational Vision and Medical Image Processing IV: VIPIMAGE 2013, 151, 2013. [ Links ]
[49] Banzi, M. Getting Started with Arduino: O'Reilly Media, Inc., 2009. [ Links ]
[50] Rao, A. S., Marshall, S., Gubbi, J., Palaniswami, M., Sinnott, R. and Pettigrovet, V. Design of Low-Cost Autonomous Water Quality Monitoring System, Advances in Computing, Communications and Informatics (ICACCI), 2013 International Conference on, 2013, 14-19. [ Links ]
[51] Gongalves, P J., Torres, P and Lopes, P Robiho-a Robot Companion for Elderly People's Homes. Applied Mechanics and Materials, 282, 158-161, 2013. [ Links ]
[52] Zeebaree, S. R. and Yasin, H. M. Arduino Based Remote Controlling for Home: Power Saving, Security and Protection. International Journal of Scientific & Engineering Research, 5, 266-272, 2014. [ Links ]
[53] Kumar, S. V., Hudson III, D. G., Kodosky, J. L., Rogers, S. W. and Petersen, N. G. Type Generic Graphical Programming, ed: Google Patents, 2015. [ Links ]
[54] Elliott, C., Vijayakumar, V, Zink, W. and Hansen, R. National Instruments Labview: A Programming Environment for Laboratory Automation and Measurement. Journal of the Association for Laboratory Automation, 12, 17-24, 2007. [ Links ]
[55] Chinnery, D. N. W., Solar Heating in South Africa, Pretoria CSIR-Research Report 248, 1981. [ Links ]
[56] Asowata, O., Swart, A. J., Pienaar, H. C. and Schoeman, R. M. Optimizing the Output Power of a Stationary Pv Panel, presented at the SATNAC 2013, Stellenbosch, South Africa, 2013. [ Links ]
[57] Ozemoya, A., Swart, J. and Pienaar, C. Controlling the Ambient Temperature of a Pv Panel to Maintain High Conversion Efficiency, Telecommunication Networks and Applications Conference (SATNAC), 2012. [ Links ]
* Corresponding author: Tel.: +27 (0)51 507 3682. Email: phertzog@cut.ac.za

