


Services on Demand
Article
 English (pdf)
 Article in xml format
 Article references
Indicators

Related links
-
 Cited by Google
 -
 Similars in Google
Share

 Permalink
Journal of Energy in Southern Africa
On-line version ISSN 2413-3051
Print version ISSN 1021-447X
J. energy South. Afr. vol.27 n.2 Cape Town Mar./May. 2016
A life cycle assessment of e-books and printed books in South Africa
Vinesh Naicker; Brett Cohen*
Energy Research Centre, University of Cape Town, Private Bag X3, Rondebosch 7701, South Africa
ABSTRACT
This paper presents the results of a study comparing the life cycle environmental impacts and cumulative energy demands of reading printed books (print system) with those of reading e-books from an Apple Air iPad (digital system), with a specific focus on production of books and use of both options in South Africa. The two systems were compared using the ReCiPe midpoint and cumulative energy demand methods. The findings, which are consistent with international findings, demonstrate that the print system has lower impacts than the digital system in the impact categories of freshwater eutrophication, freshwater ecotoxicity, marine ecotoxicity and metal depletion, whilst the digital system has lower impacts in the categories of climate change, ozone depletion, terrestrial acidification, marine eutrophication, human toxicity, photochemical oxidant formation, particulate matter formation, terrestrial ecotoxicity, ionising radiation, agricultural land occupation, urban land occupation, natural land transformation, water depletion and fossil depletion. The major processes contributing to energy demand and environmental impacts of the print system were paper production and printing. For the digital system the major contributing processes were the production of the iPad and e-book reading. Coal-based electricity and coal-mining-related activities featured prominently in both systems, affecting environmental impacts and energy demand of products and services in South Africa. A change in the electricity mix to be less coal-intensive reduced the impacts of both systems. Finally, the products demonstrate that relatively few additional readers result in printed books becoming preferable to e-books in almost all impact categories, suggesting the need to consider housing print books in libraries to reduce their relative environmental impacts.
Keywords: cumulative energy demand, digital books, print books, life cycle assessment.
1. Introduction
A number of studies around the world have compared the environmental impacts of print media systems with those of digital media systems offering the same services, including those by Kozak (2003), Gard and Keoleian (2003), Enroth (2009), Moberg et al. (2011) and Achachlouei et al. (2013). No similar analyses have, however, been made in South Africa. This paper presents the results of a study that was conducted to determine whether international results are also relevant in the South African context. The work sought to answer three key questions, being:
1. Is it environmentally preferable to read e-books from an iPad or printed books?
2. What is the impact of the future South African electricity mix on both systems, in terms of environmental impacts and cumulative energy demand?
3. What is the effect of multiple users on the environmental impact and cumulative energy demand on both systems?
The remainder of the paper presents details of the approach and key findings, following the ISO 14040 LCA Principles and framework structure (ISO, 2006). The results are compared to the findings of previous studies throughout the paper.
2. Scope
2.1 Introduction
The print and digital systems were compared to each other using life cycle assessment (LCA). LCA is defined as 'an objective process to evaluate the environmental burdens associated with a product, process, or activity by identifying energy and materials used and wastes released to the environment, and to evaluate and implement opportunities to effect environmental improvements' (ISO, 2006).
2.2 LCA methodology
The LCA methodology is built around four major components (Wolf et al., 2012): goal definition and scope; inventory analysis; impact assessment; and interpretation. The methodology is illustrated in Figure 1, which shows the iterative process as indicated by the bi-directional arrows.
2.3 Goal definition
2.3.1 Base case
The purpose of this study is to compare the environmental impacts and cumulative energy demand of 21 university textbooks read as e-books on a digital system with those associated with the same books read in print in South Africa. This figure represents the total number of books required for a four-year commerce degree at a local university. The initial hypothesis was that reading 21 e-books from an iPad has a smaller environmental impact and cumulative energy demand than reading 21 printed books.
2.3.2. Changing the electricity supply mix
This study also serves to investigate the effect that
changing the energy mix and increasing the number of users per book has on the results. It was hypothesised that changing the electricity mix to one that includes more nuclear and renewable energy will reduce the differential between the print system and digital system in all of the impact categories considered. The Integrated Resource Plan (IRP) developed in 2010 by the Department of Energy (DOE) forms the planning framework for the installed power production plant capacity in South Africa (DOE, 2011). Several scenarios were developed in the IRP for the period between 2010 and 2030 which assess the impact of installing renewable and non-renewable energy technologies on the price of electricity and the associated greenhouse gas emissions. The 'policy-adjusted IRP' scenario was used to determine how the digital and print systems are impacted by a change in the electricity grid mix.
2.3.3 Impact of multiple readers If the number of readers per product increases, impacts could either increase or decrease as a multiple of the number of users. The change in impacts may apply to either stages of the life cycle or the entire life cycle, depending on the exchange between users. The print system impacts will decrease with each additional user. The digital system impacts will decrease with each additional user for all stages, except in the reading stage, where additional energy is expended per user to charge the iPad for reading e-books. The third set of analyses was run to determine the impact of multiple readers on the results.
2.4 System boundary and inventory data
2.4.1 Print system
The life cycle of the paper book consists of the following stages:
• pulp wood production;
• pulp wood transportation;
• pulp and paper production;
• paper transportation;
• printing;
• personal transportation;
• printed paper book use; and
• waste management.
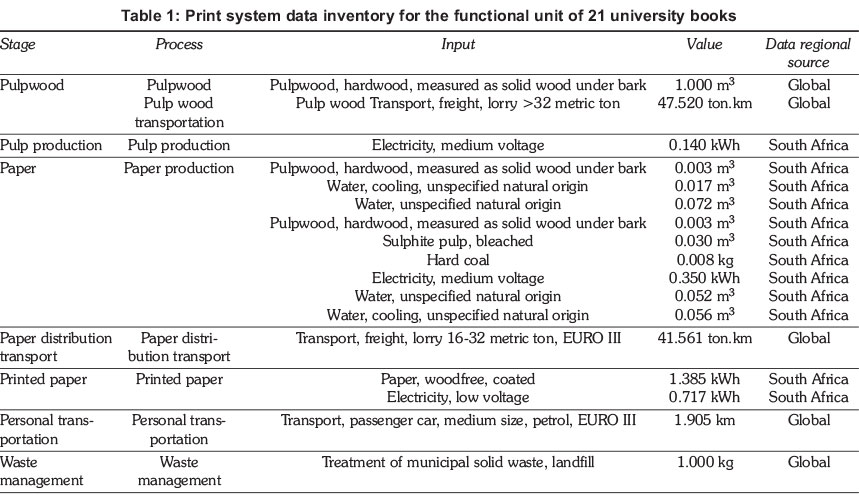
The system boundary is illustrated in Figure 2. The associated inventory data is shown in Table 1, with the assumptions that underpin this data being presented in the sections that follow.
Pulp wood production
Hardwood is the main feedstock used for writing and printing paper grade in South Africa (Sappi, 2012). It is assumed that the processes used in the production of hardwood in South Africa are equivalent to those used internationally, and hence international data is used in the study.
Pulp wood transportation
Once the wood is harvested it is assumed to be transported a nominal 110 km (Chamberlain et al., 2005) to the pulp and paper mill.
Pulp and paper production
It is assumed that all printed books are made using paper made entirely from sulphite pulp at an integrated paper and pulp mill (The Timber Watch Coalition, 2009). All paper in the book is assumed to be made from wood-free uncoated paper. Wood-free refers to paper that is made from pulp which is free of lignin. This assumption includes the book covers. The weight of the book includes the cover of the book and weight of the paper within.
Paper transportation
Five of the six major book printing houses in South Africa are located in Cape Town. The paper is therefore assumed to be transported 1 600 km (Google Maps, 2014), from Durban to printing houses in Cape Town (Chamberlain et al., 2005).
Printing
The publishing and printing process is assumed to be similar to international procedures, so international data was used for this process stage. Only the electricity mix was changed to represent the South African electricity mix. Distribution transport was excluded.
Personal transportation
The personal transportation stage accounts for the consumer travelling in a personal vehicle to a bookshop to purchase books. For modelling the impacts of personal transportation, the data on emissions from EURO III vehicles was used, as South Africa's vehicle parc is a mixture of EURO III and IV vehicles (National Association of Automobile Manufacturers of South Africa, 2012). It was assumed that four two-way trips of 10 km each (Prinsloo, 2010) are made over the four-year period.
Printed paper book use
No impacts have been assumed with the reading of books.
Waste management
Although paper recovery rates in South Africa are high, the recycling of paper or use of recovered paper is not considered in this study as South Africa uses only virgin fibres in the production of writing paper grades and recycled paper is used to manufacture other grades of paper (Sappi, 2003). Hence the benefits of more than one life cycle for recycled paper have been omitted from this study.
2.4.2 Digital system
The life cycle of the iPad consists of the following stages:
• iPad production;
• e-book formatting;
• e-book downloading;
• distribution transportation of the iPad;
• personal transportation;
• use of e-books and the iPad; and
• waste management.
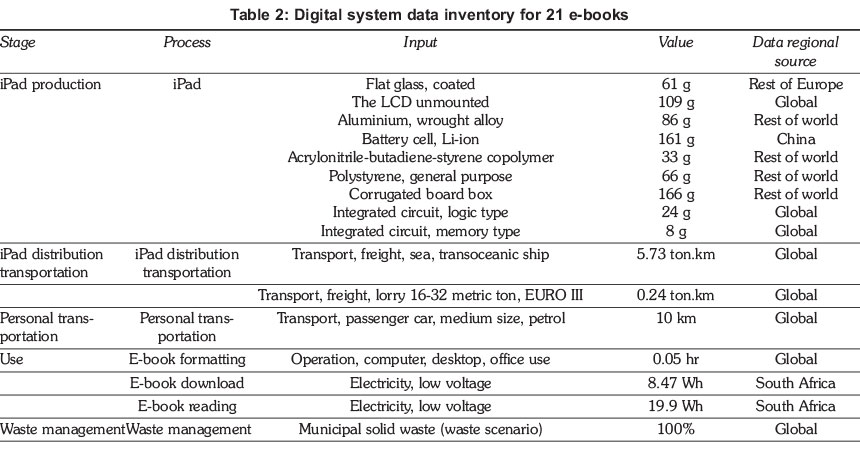
The system boundary is illustrated in Figure 3. The associated inventory data is shown in Table 2, with the assumptions that underpin this data being presented below.
Production of the iPad
The iPad is assembled in Foxconn's Chinese factories, so the Chinese mixes from the Ecoinvent v3.01 database were used for all materials where available. Where Chinese data is not available an average global mix was used. The mass of the iPad was entered as per the iPad Environmental Report (Apple, 2013). The energy and materials associated with the assembly of the iPad were not included as processes in this stage.
Distribution of the i-Pad
The distribution stage only included transportation of the iPad. The iPad is first shipped 32 500 km from China to South Africa via the regional distribution centre in the United Kingdom, and then transported from Durban harbour (Maharaj, 2013) to Cape Town via truck, a distance of 1 630 km (Google Maps, 2014).
E-book formatting
It is assumed that each e-book is formatted for 50 hours using a computer as per Achachlouei et al. (2013). A further assumption is that one e-book is formatted for a 1 000 readers, i.e. 250 students per year for four years. It is assumed that the e-book will be used over the four-year period and will not undergo subsequent revisions.
E-book downloading
The e-book downloading impact is based on energy use to download the book by the user modem and router, access network DSLAM, internet, data centre, cables and operational activities as per Malmodin et al. (2011). It is also recognised that internet operations and connections are faster and more advanced in Europe than in South Africa, but this consideration is not addressed further in this study, which assumes users to be in middle- and high-income households which can afford high internet bandwidth speed connections. Only the energy usage is modelled for this lifecycle stage. No telecommunications infrastructure associated with the downloading is included.
Personal transportation
The personal transportation stage is the same as that for the purchasing of the books except that only one trip is made for purchasing the iPad.
E-book reading
The impact of charging an i-Pad for reading an e-book is included in the study, based on the battery life of an i-Pad and the time spent reading. This is described in further detail below.
Waste management
After use, most iPad components avoid landfill. It is assumed that only the battery and packaging of the iPad is sent to landfill (DEA, 2012). Whilst previous studies indicate that up to 80% of electronic devices can be recovered and recycled (Achachlouei et al., 2013), this study does not account for these benefits. The recovery stage is excluded because recovered materials will not be shipped back to China but will rather be used in making other products with different applications; as this study deals only with the iPad it would not make sense to include the lifecycle of another product.
2.5 Function, functional unit and reference flows
The study was based on the University of Cape Town Commerce degree booklist that prescribes 21 books over a four-year period. The functional unit can be described as 'the reading of 21 books by a single user two hours per day over a four-year period'.
The reference flow for the print system is 25.4 kg of paper required for the 21 books, and for the digital system it is the energy required to download and read 21 e-books, which is 13 733 Wh, based on Taylor and Koomey (2012).
2.6 Allocation procedure
Whilst there is no allocation required for the printed system, the digital system does have an applied allocation based on use. The iPad is a multifunctional device and this study assumes that it is used for reading for 2 out of 3.1 hours per day, or 64.5% of the time that the iPad is in use. The allocation percentage was applied to the production, distribution and retail transportation associated with the iPad to reflect the potential impacts due to just reading.
2.7 Impact assessment
SimaPro v 8.1 was used for this study. Since this study is concerned with just the environmental impacts and the energy demands of the print and digital system, two methods have been selected, namely the ReCiPe 1.09 midpoint hierarchist method for the environmental impacts and the cumulative energy demand (CED) method for the energy demand. The ReCiPe 1.09 method is one of the many different methods used in LCA, and has the advantage of being able to provide the user with both midpoint and endpoint indicators. The midpoint characterisation method can be described as 'a parameter in the cause-effect chain that or network (environmental mechanism) that is between the inventory data and the category endpoints', while endpoint characterisations factors are computed to indicate 'differences between the stressors at an end-point at a cause effect-chain and may be of direct relevance to society's understanding of the final effect' (Bare et. al, 2000). An example of a midpoint category indicator would be global warming potential in terms of CO2 equivalents for the impact category for climate change, whilst for the same impact category the endpoint is damage to human health and ecosystems. In this study, however, only midpoint impact category indicators are being used to characterise environmental impacts.
Cumulative energy demand is described as 'the entire demand, valued as primary energy, which arises in connection with the production, use and disposal of economic goods (product or service) or which may be attributed to it respectively in a casual relation' (Frischknecht et al., 2003). It thus focuses on a single parameter in the product's life cycle, represented in a commonly understood metric.
3. Results and discussion
3.1 Base case assessment
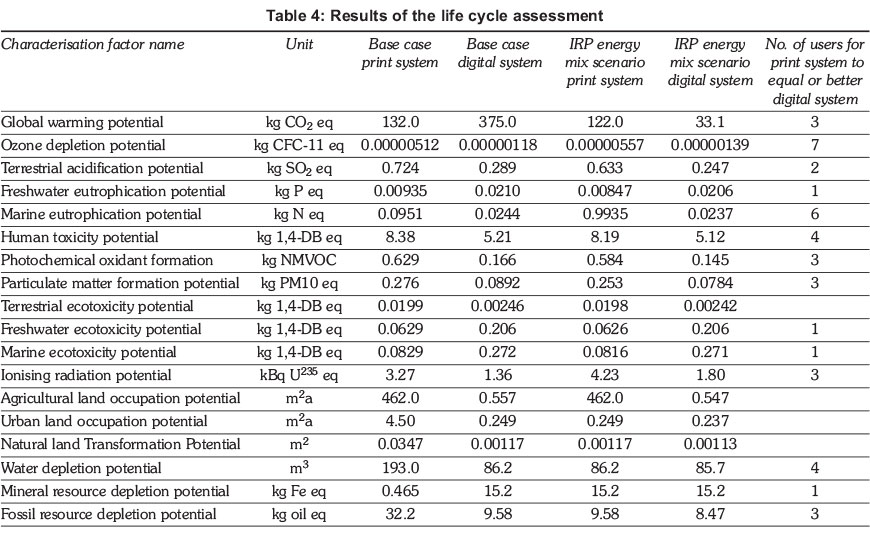
The results for the life cycle impact assessments using the ReCiPe midpoint method are shown in Table 4. Print can be seen to have lower impacts than the digital system in the categories of freshwater eutrophication, freshwater ecotoxicity, marine ecotoxicity, and metal depletion, whilst the digital system has lower impacts in the categories of climate change, ozone depletion, terrestrial acidification, marine eutrophication, human toxicity, photochemical oxidant formation, particulate matter formation, terrestrial ecotoxicity, ionising radiation, agricultural land occupation, urban land occupation, natural land transformation, water depletion and fossil fuel depletion.
The findings regarding global warming potential of the digital system as compared to the print system are contrary to those of Enroth (2009). The results of this study indicate that the print system's global warming potential is approximately 251% greater than the digital system's, whilst Enroth's results suggest that the global warming potential of the digital system is 10 times that of the print system. An increase in the amount of paper per book would decrease this gap. This study used an average book weight of 1.2 kg whilst Enroth used an average book weight of 0.8kg; this is taken to be the main cause of the different results. Another contributing factor is the difference in the energy mix between the two systems. South Africa's energy mix is more dependent on fossil fuel than that of Sweden, where Enroth's study was conducted. The findings of this study are also aligned with those of Moberg et al. (2011) who indicated that the digital e-book system with a lifetime of two years was preferred to the print system in terms of energy, abiotic depletion potential, global warming potential, terrestrial ecotoxicity potential, human toxicity potential and terrestrial toxicity potential.
The land use impacts for the print system are also noted to be much larger than those of the digital system. The print system impact is approximately 827 times greater for agricultural land occupation, 17 times greater for urban land occupation and 29 times greater for natural land transformation. This would be expected, given the large land areas required for forestry.
The main observations regarding the print system can be summarised as follows:
• Paper production featured as a prominent stage in all categories except in agricultural land occupation and urban land occupation.
• Printing is also prominent, featuring in all categories except in agricultural and urban land occupation, and natural land transformation.
• Pulpwood is the major contributing stage in the impact categories concerning land use such as agricultural land occupation and urban land occupation.
• Personal transportation is a major contributor in ozone depletion, marine ecotoxicity, ionising radiation and fossil depletion.
• Waste management is the biggest contributor in marine eutrophication and global warming contributing to 46% and 15% of the total potential, respectively.
The following notes relate to contributions of the different life cycle stages to each impact category as shown in Table 4.
• The production of the iPad features as the major contributor in most impact categories. Impact categories almost entirely attributed to the production stage are metal depletion potential, freshwater eutrophication potential, marine ecotoxicity, freshwater ecotoxicity and agricultural land occupation.
• The e-book reading stage was the second-greatest contributor of impact potential. It has a large impact in global warming potential, terrestrial acidification potential, photochemical oxidation formation potential, particulate matter formation potential and fossil resource depletion potential.
• Personal transportation has a notable impact in global warming potential, ozone depletion, terrestrial ecotoxicity, ionising radiation, and fossil depletion.
• In comparison to the above stages, e-book formatting and downloading contribute little or nothing to any of the impact potentials.
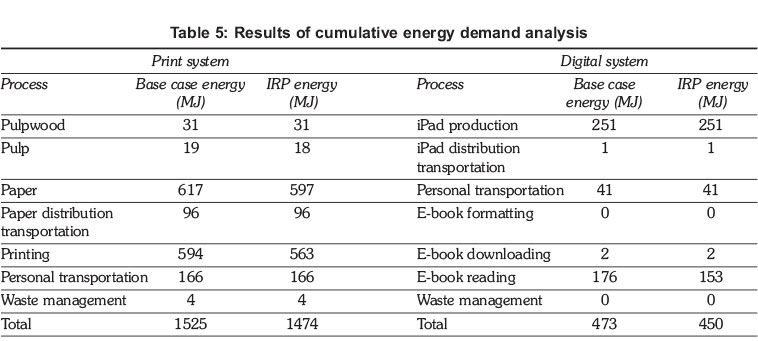
3.2 Base case cumulative energy demand
The results from the CED analyses are shown in Table 5, which shows that the print system requires approximately three times more energy (1 525 MJ) to offer the same service as the digital system (473 MJ). This result is similar to the findings of Moberg et al. (2011) who report a difference of approximately 3.5 times.
The paper and printing processes are responsible for the greatest energy demand contribution to the life cycle of the paper system, contributing 41% and 39% respectively to the total life cycle energy demand (Figure 4). These results are in line with Enroth (2009) who suggests that half the energy demand for printed textbooks is within the paper and pulp production stage and a further 35% is consumed in printing.
In the digital system, the production of the iPad is the most prominent process, contributing 53% of the total CED. This is followed by e-book reading, which contributes 37% (Figure 5). These results seem to agree with the findings of Moberg et al. (2011) who also indicate that the production stage of the electronic device is the most prominent in energy consumption. According to the CED calculations, 94% of the print system energy is provided by fossil fuels and approximately 6% is from nuclear energy, whilst in the digital system 87% of the CED is obtained from fossil fuel and 13% from nuclear fuel. This observation is as a result of the print system being largely dependent on the South African electricity mix, while the digital system is dependent on a global, and to some extent a Chinese, electricity mix (which are both less coal-dependent than the South African mix).
3.3 The IRP energy mix scenario
The introduction of a new energy mix as proposed in the 'policy-adjusted IRP' scenario for 2030 reduces the relative difference of the impacts between the digital and print systems, in most impact categories, as seen in Table 4. The 2030 IRP mix assumes a greater reliance on nuclear energy and renewable energy and a reduced reliance on coal energy. Coal processes feature in most of the impact categories as a significant contributor to the impact potentials. The CED (Table 5) for renewable energy sources is less than that of fossil fuels because of the less energy-intensive processes upstream. By changing the electricity mix, the way in which the demand is met also changes, and hence the cumulative energy demand changes.
The print system improves relative to the digital system when compared to the base case for certain of the impact categories, being ozone depletion and
agricultural land occupation. There is little or no change to terrestrial acidification, metal depletion, water depletion, marine ecotoxicity, freshwater ecotoxicity and ionising radiation. The impact categories that see relative increases between the print and the digital system are global warming potential, fossil depletion, urban land occupation, photochemical oxidation formation, freshwater eutrophication and terrestrial acidification. The changes in the results can be attributed to the increase in the use of gas for proposed gas power plants and also from the nuclear fuel, energy production and waste that come with the increased use of nuclear power, as proposed in the IRP electricity energy mix.
The CED results in Table 5 indicate that the change to the 2030 IRP electricity energy mix has a positive impact on both systems, with the print system having a total reduced CED of 3% and the digital system having a total CED reduction of 5%. Since the CED is met with fewer inputs of primary energy commodities, the stages that are most dependent on electricity in the print system, paper and printed paper, have reduced cumulative energy demands. The pulpwood, book distribution transportation, personal transportation and waste management are not affected.
3.4 Multiple users per book scenario
The break-even point is defined here as a measure of the point at which the number of users sharing books causes the print system to have lower impact than the digital system. This point differs between the different impact categories (Table 4). As indicated previously, in the impact categories of freshwater eutrophication, freshwater ecotoxicity, marine ecotoxicity and metal depletion, even with one user per book the digital system impacts are greater than those of the print system. Two users per system is the break-even point for the impact category of terrestrial acidification; three users per system is the break-even point for climate change, photochemical oxidant formation, particulate matter formation, ionising radiation and fossil depletion; four users per system is the break-even point for water depletion and human toxicity potential; six users per system is the break-even point for marine eutrophication; and seven users per system is the break-even point for ozone depletion. The impact categories associated with land cannot reach the break-even point within the maximum of eight users. This can be explained by the print system using a large amount of wood and hence the impacts associated with land use for the forest wood plantations are far greater than the digital system, which depends more on metal and mineral resources.
The LCA results thus suggest that a book used in a library could prove environmentally preferred to reading an e-book on iPads, for the same number of users. The greater the number of users per book, the more beneficial it is to read from a printed book. This result confirms the findings of Kozak (2003), Gard and Keoleian (2003) and Toffel and Hovarth (2004). The CED results also indicate that the print system is increasingly favoured as the number of users increase. In contrast, the digital system energy demand increases almost linearly with each additional user as would be expected. The break-even point for the number of users seems to be approximately three users sharing their books. The CED results thus also indicate that reading a printed book in a library could, for a large number of users, prove more environmentally preferred and be less energy demanding than reading e-books on an iPad.
4. Conclusions and recommendations
The objective of the study was to establish which of the systems, digital or print, had less of an environmental and energy demand impact. The initial hypothesis of this study was that reading 21 e-books from an iPad would have a smaller environmental impact and energy consumption than reading them in printed form.
When the two systems are compared in terms of impact potentials, the digital system emerges as the environmentally preferred system for certain impact categories, including climate change, ozone depletion, terrestrial acidification, marine eutrophication, human toxicity, photochemical oxidant formation, particulate matter formation, terrestrial ecotoxicity, ionising radiation, agricultural land occupation, urban land occupation, natural land transformation, water depletion and fossil depletion. The study's initial hypothesis is therefore proved partially correct, as each system is preferable in terms of certain impacts.
The stages with the highest contribution to the impact potentials and cumulative energy demand for the print system are the printing and paper stages. Electricity produced in South Africa using hard coal also features as a one of the main contributing processes in these stages. Mining also features prominently in fossil depletion potential and urban land occupation, and the disposal of coal-mining waste is the main contributing process for freshwater eutrophication potential.
The other major finding is that the print system has much larger land-based impacts than the digital system, because of the large amount of wood needed to produce books. The impact potentials for agricultural land occupation, urban land occupation, and natural land transformation are significantly higher for the print than the digital system.
The digital system is influenced by both local and international processes. The iPad production stage is the prominent contributor in most impact categories. The e-book reading stage is the second-greatest contributor in terms of impact potentials. It has a large impact in global warming potential, terrestrial acidification potential, photochemical oxidation formation potential, particulate matter formation potential and fossil resource depletion potential. The main processes are the production of electricity using coal, coal-mining and coal waste disposal. The digital system is also dependent on coal processes because it is based on the Chinese electricity mix, which has a large dependency on coal (although recognising this dependence is not as high as South Africa's). In the digital system, the production of the iPad in China has the greatest energy demand and is responsible for 53% of the total cumulative energy demand, followed by e-book reading (37%).
The results of the IRP 'adjusted policy' scenario reveal that the IRP electricity mix change reduces the environmental impacts and cumulative energy demand of both systems. As expected, however, the digital system realised a greater reduction.
The final scenario assessed the effects of multiple users reading each book. The break-even point was reached for most impact categories at four users whilst a break-even point for impacts associated with land-use could not be reached even with eight users. This was because the print system has a much greater reliance on wood products compared to the digital system, and even with multiple users this gap cannot be overcome.
Reading e-books from an iPad could be encouraged in universities because the findings of this study suggest that the environmental impact of e-books read on iPads is less than that of reading printed books. However, this will depend to an extent on the amount of reading material and whether the re-use of books or sourcing books from the library is actively promoted at the university.
References
Achachlouei, M.A., Moberg, A. & Honschhorner, E. 2013. Climate change impact of electronic media solutions: Case study of the tablet edition of a magazine. Centre for Sustainable Communications, Royal Institute of Technology, Stockholm, Sweden. [ Links ]
Apple. 2013. iPad Air Environmental report, Apple. October 2013. Available: https://www.apple.com/environment/reports/docs/iPadAir_PER_Oct2013.pdf. [ Links ]
Bare, J.C., Hofstetter, P, Pennington, D. W. & de Haes, H. A.U. 2000. Life cycle impact assessment workshop summary: Midpoint versus endpoints: The sacrifices and benefits. International Journal of LCA 5(6):319-326. [ Links ]
Chamberlain; D., Essop, H., Hougaard, C., Walker, R. 2005. The contribution, costs and development opportunities of the forestry, timber, pulp and paper industries in South Africa: Part III: Technical notes and appendices. Genesis Analytics, Johannesburg. Available: http://www.daff.gov.za/doaDev/sideMenu/ForestryWeb/dwaf/cmsdocs/Elsa/ Docs/FED/SA%20 Forestry%20Industry%20Market%20Analysis%202005.pdf. [ Links ]
Department of Environmental Affairs. 2012. Identification of the magnitude of the electrical and electronic (e-waste) situation in South Africa: A strategic approach to international chemicals management (SAICM) e-waste as an emerging policy issue. Africa Institute for Environmentally Sound Management of Hazardous and Other Wastes, and the Department of Environmental Affairs. Available: http://africainstitute.info/wp-content/uploads/2013/02/E-WASTE-South-Africa-2012.pdf [ Links ]
Enroth, M. 2009. Environmental impact of printed and electronic teaching aids, a screening study focusing on fossil carbon dioxide emissions. Advances in Printing and Media Technology 36, 2009. [ Links ]
Frischknecht, R., Jungbluth, N., Althaus, H., Doka, G., Dones, R., Hirschier, R., Hellweg, S., Humbert, S., Margni, M., Nemecek, T., Spielmann, M. 2003. Implementation of life cycle impact assessment methods. EcoInvent Report 3, Swiss Centre for LCI, Duebendorf, Switzerland. Available: http://www.ecoinvent.org/fileadmin/documents/en/03_LCIA-Implementation-v2.2.pdf [ Links ]
Gard, D.L. & Keoleian, G. A. 2003. Digital versus print: Energy performance in the selection and use of scholarly journals. Journal of Industrial Ecology 6(2):115-132. [ Links ]
International Standards Organisation. 2006. ISO 14040:2006: Principles and framework of LCA. International Standards Organisation. [ Links ]
Kozak, G. 2003. Printed Scholarly books and e-book reading devices: A comparative life cycle assessment of two book options. Centre for Sustainable Systems, University of Michigan, Report No. CSS03-04. Available: http://css.snre.umich.edu/css_doc/CSS03-04.pdf [2014, July 6]. [ Links ]
Malmodin, J., Lundén, D., and Andersson, G. 2011. Lifecycle assessment of ICT networks and primary subscription services in Sweden. In Presentation slides and Abstract to the 3rd NorLCA Symposium (Helsinki, Finland, September 15-16 2011). [ Links ]
Moberg, Å., Borggren, C. & Finnveden, G. 2011. Books from an environmental perspective - Part 2: e-books as an alternative to paper books. International Journal of LCA 2011(16):238-246. DOI: 0.1007/s11367-011-0255-0. [ Links ]
National Association of Automobile Manufacturers of South Africa. 2012. Current and future trends of the South African car parc. Paper presented by Eckart Kruger, 30 March 2012. Available: http://www.energy.gov.za/files/IEP/presentations/CurrentFutureTrends_SA_CarParc_ 30MArch2012.pdf [2014, August 9]. [ Links ]
Prinsloo, D. 2010. Classification and hierarchy of retail facilities in South Africa. Available: http://www.urbanstudies.co.za/wp-content/uploads/2014/07/New-Retail-Classification-2010.pdf [2014, August 9]. [ Links ]
Sappi. 2003. The paper making process from wood to coated paper. Available: http://www.sappi.com/regions/sa/service/mediadownloads/Pages/default.aspx [2014, July 6]. [ Links ]
Sappi. 2012. Frequently asked questions about: eucalyptus trees. Available: http://www.sappi.com/group/Sustainability/FAQs/Sappi-FAQs-Eucalypts.pdf [2014, July 6]. [ Links ]
Taylor, C. & Koomey, J. 2008. Estimating energy use and greenhouse gas emissions of internet advertising. February 14th, 2008 Working Paper. IMC2. [ Links ]
The Timber Watch Coalition. 2009. Pulp mills and plantations: Environmental, social and economic impacts of the pulp and paper industry globally and in South Africa. The Timber Watch Coalition, Mayville, South Africa. Available: http://www.timberwatch.org/user-files/Social%20impacts%20of%20certified%20timber%20plantations%20in%20South %20Africa%20%20TW(2).pdf [2014, July 6]. [ Links ]
Toffel, M.W. & Horvath, A. 2004. Environmental Implications of Wireless Technologies: News Delivery and Business Meetings. Environmental Science & Technology 38(11): 2961- 2970. [ Links ]
Wolf, M., Pant, R., Chomkhamsri, K., Sala, S. & Pennington, D. 2012. The international reference life cycle data system handbook. Institute for Environment and Sustainability in the European Commission Joint Research Centre. Available: http://eplca.jrc.ec.europa.eu/uploads/JRC-Reference-Report-ILCD-Handbook-Towards-more-sustainable-production-and-consumption-for-a-resource-efficient-Europe.pdf. [ Links ]
* Corresponding author: Tel +27 (0)72 434 2208; Email: brett@tgh.co.za

