


Services on Demand
Article
 English (pdf)
 Article in xml format
 Article references
Indicators

Related links
-
 Cited by Google
 -
 Similars in Google
Share

 Permalink
Journal of Energy in Southern Africa
On-line version ISSN 2413-3051
Print version ISSN 1021-447X
J. energy South. Afr. vol.27 n.2 Cape Town Mar./May. 2016
A literature review on the potential of renewable electricity sources for mining operations in South Africa
Roman Günter VottelerI, *; Alan Colin BrentII
ISchool of Public Leadership, and the Centre for Renewable and Sustainable Energy Studies, Stellenbosch University, Stellenbosch, South Africa
IIDepartment of Industrial Engineering, and the Centre for Renewable and Sustainable Energy Studies, Stellenbosch University, Stellenbosch, South Africa
ABSTRACT
The economic situation of mining corporations operating in South Africa has in recent years created considerable challenges in staying globally competitive. One reason for this is the increase in average electricity costs from 7% to 20% of total operational expenses since 2007. Forecasts for the next decade predict that this development will continue at similar rates. The reliability of Eskom has also decreased, with self-generation being increasingly considered. In addition, the South African government plans to launch a carbon tax in 2016, which will further add to the costs of current electricity sources. This paper investigates the potential of renewable electricity sources for mining operations in South Africa. It is based on an extensive literature analysis, which was conducted in the form of a conceptual review. The investigation of electricity usage patterns reveals that mining operations commonly have a relatively constant day and night consumption. One of the prerequisites for a suitable source is its ability to supply electricity constantly. Most renewable sources can therefore only be used in hybrid versions, owing to relatively high intermittencies, especially with electricity supply from solar photovoltaic and wind generation. Nevertheless, the levelised costs are substantially lower than diesel generators and are already similar to Eskom tariffs, whilst also lowering carbon emissions. The business case of self-generation is shown to be positive. An on-site project can be realised through a power purchase agreement or through own investments.
Keywords: mining; South Africa; renewable energy
1. Introduction
The cost of electricity for mining corporations in South Africa has substantially increased in recent years. The average percentage of annual expenditure on electricity costs for members of the Energy Intensive User Group of Southern Africa, of which 47% are mining companies, has risen from 7% in 2007 to 20% in 2014, (Energy Intensive User Group of Southern Africa, 2014).1 Power rarely constitutes less than 10% of mining operating costs and often exceeds 25% (Banerjee et al., 2015). The current commonly used electricity sources are on-site diesel generators and the electrification grid of the national utility supplier, Eskom (Boyse, Causevic, Duwe & Orthofer, 2014). Electricity price escalations, past and future, will damage the global competitiveness of these companies (Creamer, 2012). Moreover, uncertainty around reliable electricity supply and carbon emissions management hinders the possible future development of these companies (Kohler, 2014).
The current situation of these companies demands an investigation of alternative sources of electricity, in order to lower costs, to create greater independence and to decrease the carbon footprint of their operations.2 The enormous technological and economic development of renewable sources of electricity in recent years has increased their attractiveness as a possible option for mining operations in South Africa to diversify electricity sources (Mulaudzi, Muchie & Makhado, 2012; Cornish, 2013).
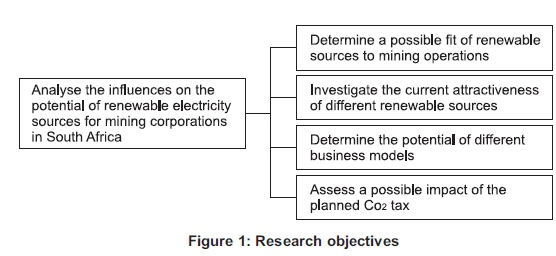
As Figure 1 shows, the investigation, summarised in the paper, looks at how renewable sources could fit into the electricity usage patterns of mining operations, the technological attractiveness of different renewable and current sources, the most beneficial business model is investigated, and possible impacts of the CO2 tax. No previous study combining all the macroeconomic elements that influence the project realisation of renewable electricity projects with mining corporations in South Africa could be found through a literature review. Three papers - by Boyse et al. (2014), Gets and Mhlanga (2013), and Brodsky et al. (2013) - do, however, cover some of the elements.
2. Methodology
Petticrew and Roberts (2006) identify six different types of literature reviews, namely: systematic review, narrative review, conceptual review, traditional review, critical review and state of the art review. For this paper a conceptual review was conducted. A conceptual review aims to synthesise areas of conceptual knowledge that can contribute to a better understanding of these issues. The objectives of these syntheses are to provide an overview of the literature in a given field, including the main ideas, models and debates (Petticrew & Roberts, 2006). The literature - conference and journal papers, theses and dissertations, and industry reports from 2008 onwards - was researched until the information was repeated in new texts. This approach assisted in identifying all key factors and their potential effect on the realisation of renewable electricity projects by mining corporations in South Africa. Based on the fact that the element topics are broad, and that there is a vast amount of information, this approach was deemed most suitable. Other approaches, such as a systematic review, would be too detailed and extensive.
3. Mining operations
3.1 Electricity pattern of mining operations
The current development of lower commodity prices hinders the widespread adoption of renewables, as falling profits and lower fuel prices maintain barriers (Crespo, 2015). In addition, the long-term investment into renewables is hindered by the investors' pressure for short-term capital appreciations (Elliott, 2014). As a result, one of the main outcomes of several renewables and mining summits worldwide is the recognition that mining corporations have to be better educated about the concept of renewable sources in the context of their unique operational demands (Judd, 2014b).3
Electricity consumption patterns greatly influence the selection of electricity sources (Klein and Whalley, 2015). The majority of mining locations operate day and night, which often creates a relatively constant baseload demand (Levesque et al., 2014). The required amount of electricity depends on the type of mineral and even more on the extent of processing or beneficiation. (Banerjee et al., 2015). Every type of mineral mined has its specific processes, and it is not necessary for all to undergo all processes to be ready for use in manufacturing. The main processing stages are as follows (Banerjee et al., 2015):
• Extracting the resource by digging, sorting and crushing - generally known as mining.
• Concentration of the mineral using various techniques, the majority either based on gravity, or using a chemical process to separate elements, or using magnetism to separate waste from the mineral.
• Smelting of the concoction at high temperatures to separate slag from metal.
• Refining, often through electrolysis, to achieve a higher level of purity.
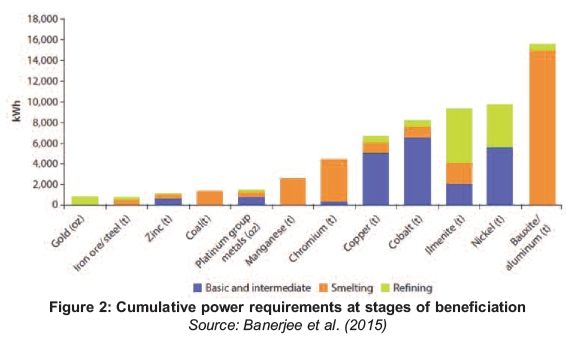
Figures 2-4 are based on a database of 168 mining operations in Africa (World Bank Group, 2015a). Figure 2 provides an overview of the cumulative power requirements for mining operations at stages of beneficiation. By far the most electricity-intense ones are the platinum group, gold and aluminium. Gold and platinum is illustrated in ounces and it needs 35 273 oz to fill up a tonne (Metric Conversion, 2015). Nickel, ilmenite, cobalt, copper and chromium also have a relatively high electricity demand with a more mixed consumption profile.
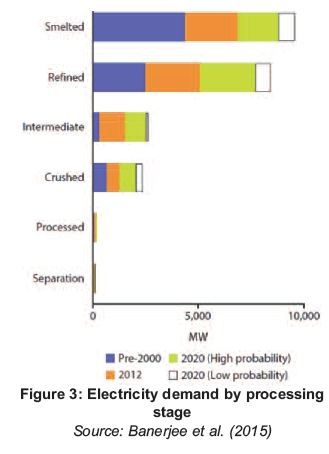
The overall contribution in the different periods to the mining electricity demand of the sample can be seen in Figure 3. The smelting and refining processes are the most electricity-intensive and were responsible in all periods for more than three quarters of the demand. Mining in South Africa is the most electricity-intense industry in Sub-Saharan Africa, with 70% of the demand in 2000 and 66% in 2012. The contribution is, however, forecast to decline to 56% if all high- and low-probability projects are completed (Banerjee et al., 2015).
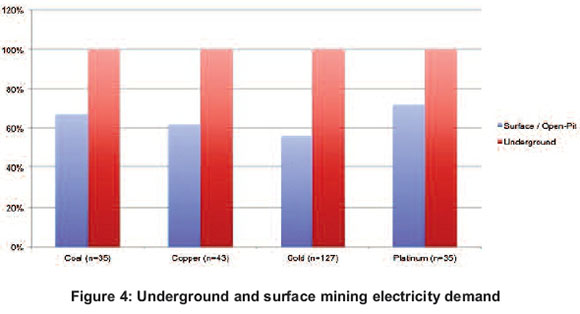
Another factor affecting electricity demand is whether mining operations are underground or at the surface. Underground mining operations require significantly higher quantities of electricity, due to a great rise in hauling requirements, ventilation, water-pumping and other operations (Toledano, 2012). Figure 4 provides an indication of the difference in electricity demand for coal, copper, gold and platinum. It can be seen that surface mining consumes 30% to 40% less electricity.
3.2 The demand profile
This section introduces the 24-hour demand profiles of five different mining operations in South Africa. The purpose is to gain a better understanding of the consumption patterns and how renewable electricity sources could fit in.
The demand profile in Figure 5 illustrates the electricity consumption pattern of an underground grid connected gold mine in South Africa. The 24-hour electricity demand is relatively constant, with two visible reductions at approximately 9am and 7pm. The purpose of these reductions is to save costs and to shift loads to other times if possible. The reason for shifting consumption is Eskom's Megaflex tariff structure, which is used for large electricity consumers and is more expensive at these times, as can be seen on the price signal line. In addition, Eskom's demand response programme invites large customers to reduce their demand when requested in return for financial rewards, which improves grid stability (Williams, 2014). This demand-side management (DSM) strategy is commonly used in South Africa to lower operating costs by optimising time schedules of systems like pumping and refrigerating (Mathews, 2005).

Figure 6 illustrates another average weekday and Sunday consumption profile of a large grid-connected underground gold mine in South Africa. The purpose of the consumption reduction around 8:00 and 18:00 is again to save costs by shifting demand to other times (Wouter, 2014). Apart from the two reductions, the day and night electricity consumption remains relatively constant. The demand profile in Figure 7 illustrates the 24-hour electricity usage of an underground grid-connected coalmine in South Africa. The usage dip between 2am and 7am is due to operating processes and not a DSM strategy, but the reduction at 6pm is load-shifting to reduce costs. The consumption on weekends is lower than during the week (van Staden, 2015). The electricity demand profile of the third mine does not exist in the form of a graph, as the consumption is not recorded on an hourly base. The operation is not grid-connected and runs on diesel generators day and night. The 24-hour consumption is constant. The mining is conducted on the surface and the main mineral extracted is zircon (Beukman, 2015).
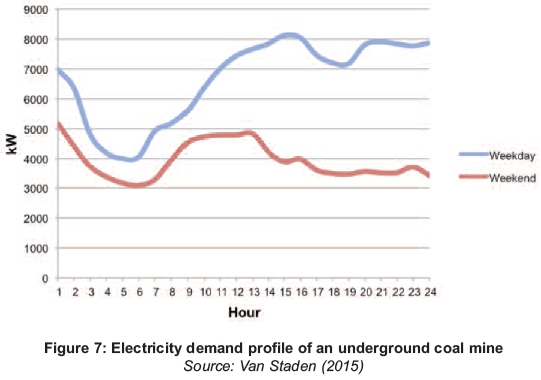
Four demand profiles in this section and in Figure 9 in the next section show a relatively constant 24-hour consumption. The profile in Figure 7 has only one reduction in the early morning, to half the amount used after midday. The mine still uses 3MW at the lowest point of the curve. Consequently, the fundamental prerequisite for an electricity source to be suitable for a mining location is its baseload capacity to be able to cover the electricity need for 24 hours a day. The intermittency of most renewable sources like wind or solar photovoltaic (PV) renders it impossible to use these sources individually to cover the electricity demand of mining operations (Judd, 2014a; Mostert, 2014).
3.3 Hybrid concepts
This section introduces the concept of hybrid solutions in accordance with the demand profile. It is difficult to generalise to all mining operations, as every profile has its own characteristics, but the concept of a 24-hour demand, and commonly with a relative constant usage, is also provided in the previous section.
Without a grid connection, there are three technical options to be able to use renewable sources with lower capacity factors at mining locations: renewables with storage, a hybrid system, and a hybrid system with storage. A detailed report on the opportunities of renewables at mining locations in South Africa (Boyse et al., 2014) identifies a hybrid version combined with a baseload capacity source as most cost-effective. The model recommended is that the supply/demand profiles have to be optimised, which means that all renewable energy goes to the primary load. Ideally, at peak output the supply should not exceed the mine's demand. Grid-connected mining operations can add a single renewable source for purposes like decreasing costs, increasing independence and lowering CO2 emissions (Levesque et al., 2014).
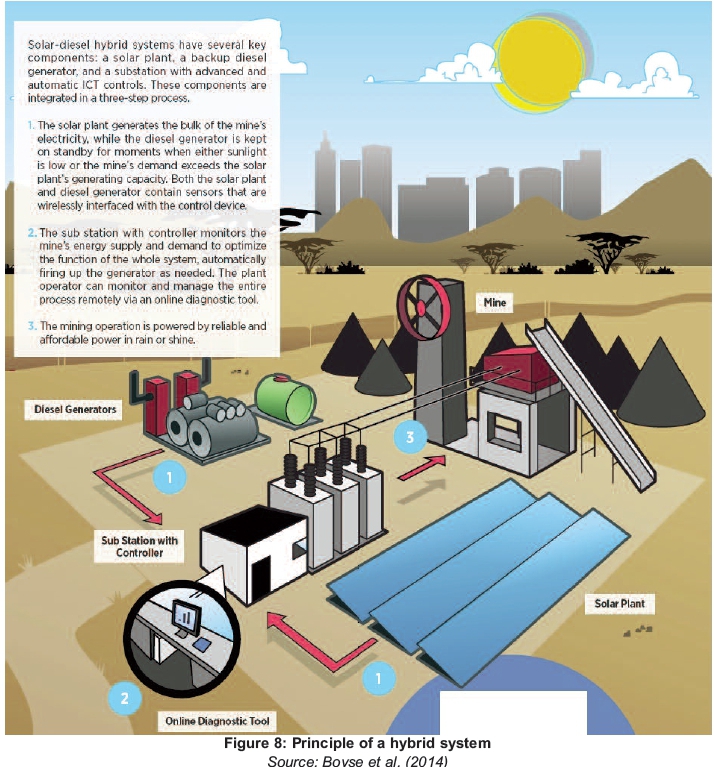
The basic principle of a hybrid system is illustrated and explained in Figure 8, although the hybrid project can also be realised with other renewable sources like wind. Where there is a grid-connection to Eskom it is, for example, possible to replace the diesel generator (Wirth, 2015).
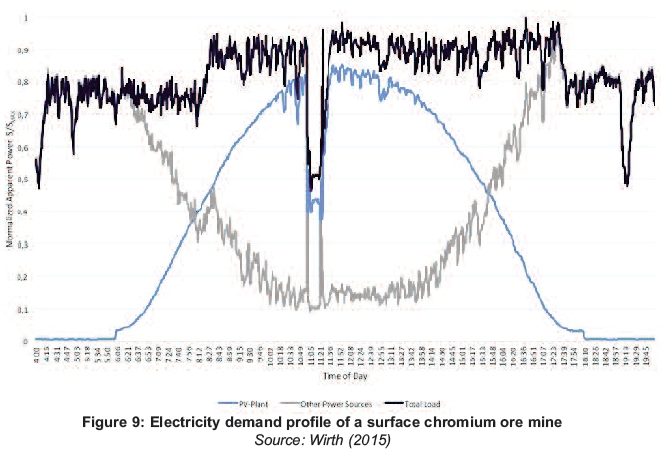
The demand profile of the first renewable electricity project at the non-grid-connected Cronimet Chrome Mining's Thaba mine is presented in Figure 9 and was finalised at the end of 2012. The project is a hybrid solution, and uses a 1 MW PV system (60% penetration ratio) and a 1.6 MVA diesel generator. The diesel generator provides the back-up electricity. The time span from concept to commissioning took six months. The initial capital outlay was EUR 2.42 million for the PV plant in 2012, with annual 1% operating and maintenance costs. The annual diesel burn was 1.9 million litres, of which 450 000 litres can be saved through the solar PV plant. It was calculated that the breakeven point would be achieved at 3.6 years owing to the savings on diesel. The calculation included the assumption of an annual 12% diesel inflation rate on initially EUR 1.05 per litre. The net present value was calculated at EUR 2.86 million, with a discount rate of 15% and a lifetime of 20 years (Ambros, 2014).
The demand profile in Figure 9 is relatively constant, with a slightly increase between 8am and 5pm; the sudden drop at 11am is due to operational processes. As stated at the beginning of this section, the general solar peak supply does not exceed the mining demand. The solar PV profile represents a clear sky throughout the whole day. As the solar PV generation increases, the diesel generator production decreases and vice versa. It is important to note that the diesel generator has a lower load limit of 25% to prevent damage. Below this limit it suffers from poor combustion, which reduces efficiency, increases maintenance costs and can cause permanent damage that reduces its life span. A control unit manages the supply levels of solar and diesel generator (International Renewable Energy Agency [IRENA], 2013). A hybrid version with Eskom requires only a 5% minimum base load to keep the electricity supply stable (Wirth, 2015).
The principles for hybrid versions with wind and geothermal power are similar, but the different generation profiles have to be considered. Wind generation is possible throughout the whole day. Variations between no wind and strong wind are possible, which makes it important to create a wind profile of the area through measurements (Rehman et al., 2012). Geothermal energy, on the other hand, is not dependent on the weather and has a constant 24-hour electricity output. Both sources require lower spinning limits for a diesel generator due to their more constant supply levels (Wirth, 2014).
3.4 South African landscape
South Africa's economy is the second-biggest on the African continent, with a GDP of EUR 3.18 billion in 2014. The GDP of Nigeria surpassed the South African one in 2011 (World Bank Group, 2015c; Statistics South Africa, 2015a). Since 2013, the mining sector in South Africa has contributed about 8% to the GDP, with a long-term downward trend since 1970's 21%. Despite the decline in the growth rate of real investment, mining is still responsible for nearly 19% of private sector investment. Today, minerals account for 30% of South Africa's total merchandise export (Chamber of Mines, 2014).
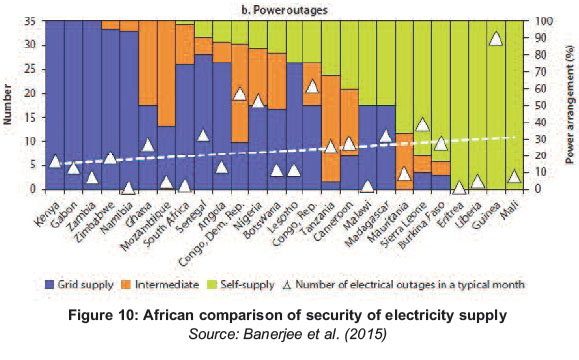
As illustrated in Figure 10, South Africa has sill one of the most reliable electricity supplies in Sub-Saharan Africa. The electricity crisis, including Eskom's power outages, contributed to economic growth dropping by 1.5% to 3.5% in 2008. The mining sector suffered the most, and plunged by 22.1% in the first quarter of 2008. The Eskom crisis in 2015 caused economic growth to contract by 1.3% in the second quarter to 1.2%. The production of the mining sector decreased by 4.8% from 2014 to 2015 (Maasdam, 2008; Statistics South Africa, 2015b).
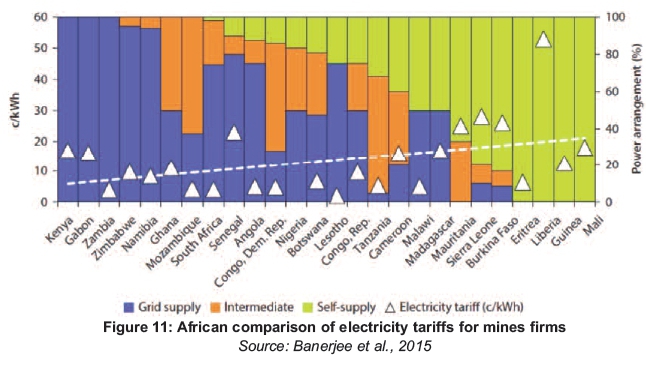
Eskom's Megaflex tariff, commonly charged to mines because of their high consumption, increased by 346% from 2007 to 2015. As can be seen in Figure 11, however, South Africa still has one of the cheapest tariffs in Africa (the statistics are from 2014). The South African mining sector consumes 15% of Eskom's annual output. Within the mining industry, gold mining uses 47% of the total, followed by platinum at 33%, with all other sectors combined consuming the remaining 20% (Eskom, 2010).
3.5 A global overview of existing projects
Worldwide, 21 operating renewable energy projects were identified, and these are introduced and categorised in Table 1. The market is relatively young, with the first wind project being commissioned in 2010 and the first solar project in 2012. An overwhelming 91% of the electricity sources are solar PV (n=11) and wind (n=8) installations. Half the projects are in Chile, of which the majority are grid-connected and financed through a power purchase agreement. Table 1 shows the projects that are not connected (1-11) and those that are connected (12-21) to their countries' national grids. The following conclusions can be drawn:
Off-grid projects
• They can be found in various countries.
• Seven out of twelve are based on the mining corporation's own investment.
• The largest project is 6.7 MW.
On-grid projects
• Eight out of ten are in Chile.
• 90% are financed through a power purchase agreement; and
• Sizes range up to 115 MW.
3.2 Attractiveness of electricity sources
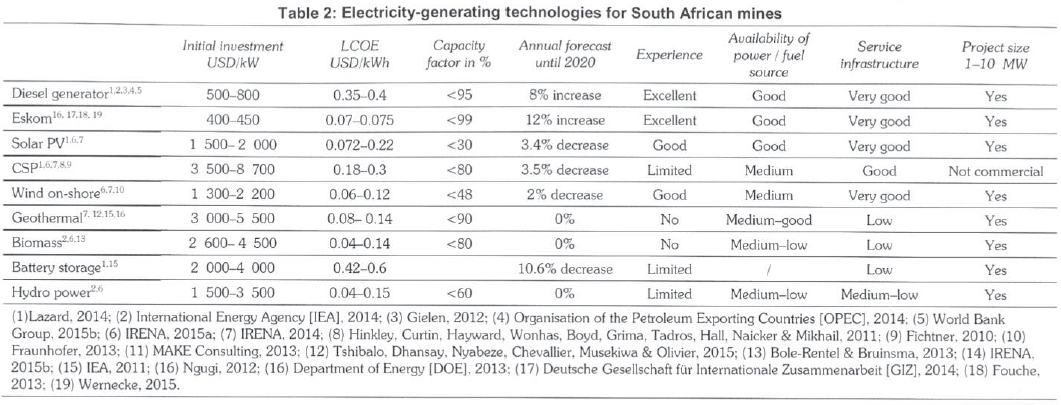
This section discusses technological factors of currently used and possible renewable electricity sources for mining operations in South Africa. Table 2 represents an overview of the results.
Two types of technical factors were selected. These were identified according to the main factors used to analyse electricity sources in the papers investigated for Table 2. Only experience and project size were added to the specifications of this research. The first type provides indicative data for generating technologies, namely initial investment costs, levelised costs of energy and capacity factor.5The second type indicates the suitability for the purpose of mining operations in South Africa. The selected factors are: the experience with the source in the global mining industry; the availability of the energy source or fuel in South Africa to power the system; the service infrastructure in South Africa; and the possibility to realise medium-scale projects of 1-10 MW. The location of mining regions in South Africa is indicated in Figure 12. This will give a better understanding of the natural fuel availability to power the renewable technology.
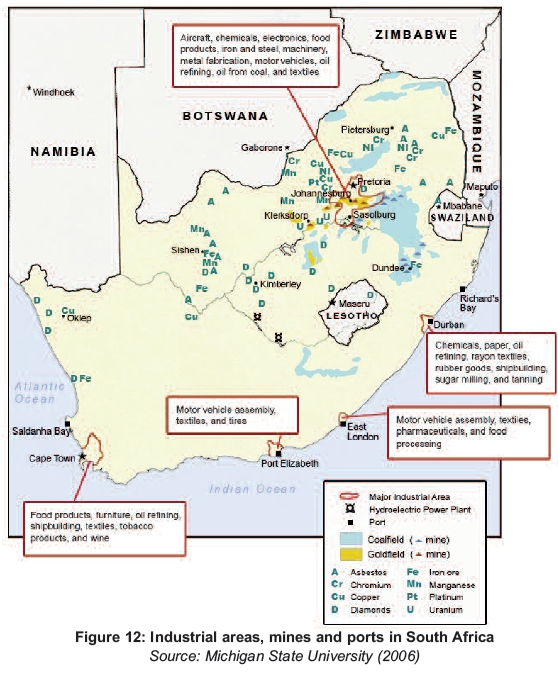
Gas generators were not selected, as the fuel supply infrastructure in South Africa is not sufficient and is currently not used by South African mines (Boyse et al., 2014; IRENA, 2015c). The black blocks on the maps indicate the mining areas where the source can be used. The non-renewable and renewable electricity-generating technologies, which have the potential to be used on-site or via grid connection by mining corporations, are now briefly introduced.
Diesel generator
The usage of diesel generators at mining operations in South Africa is common. The reason for this is their high reliability due to solid service and fuel infrastructure. Projects of all sizes can be executed, according to the need of the mine (Global Data, 2014). The average annual diesel price increase is a combination of the forecasted global real annual increase of 2% (OPEC, 2014; World Bank, 2015b) and a South African average annual inflation rate of 5% (International Monetary Fund, 2014; Organisation for Economic Co-operation and Development, 2014).
Eskom
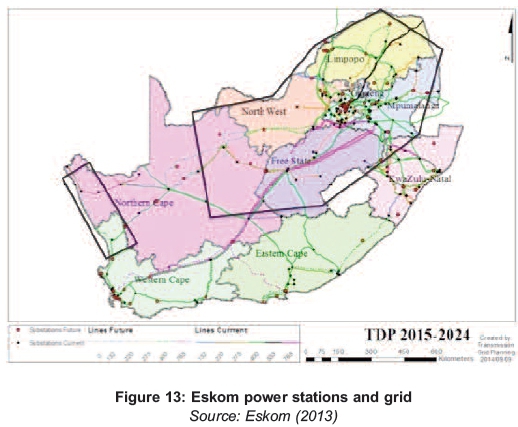
Eskom is responsible for South Africa's electricity production. The country's electricity is produced with coal-fired plants (93%), renewables (1%), pumped storage (1%), gas (1%) and nuclear power (5%) (Eskom, 2014). Eskom's experience and practical knowledge is extensive, as numerous mines use Eskom as a supplier (Boyse et al., 2014). The availability of Eskom as a source can be seen in Figure 13. The thin lines represent the power grid (availability of power source), which is not ideally developed in the central and western regions. The service infrastructure is well established, as Eskom owns the /national grid. Applications can be made for medium- and large-scale connections (Eskom, 2015a).
Solar photovoltaic
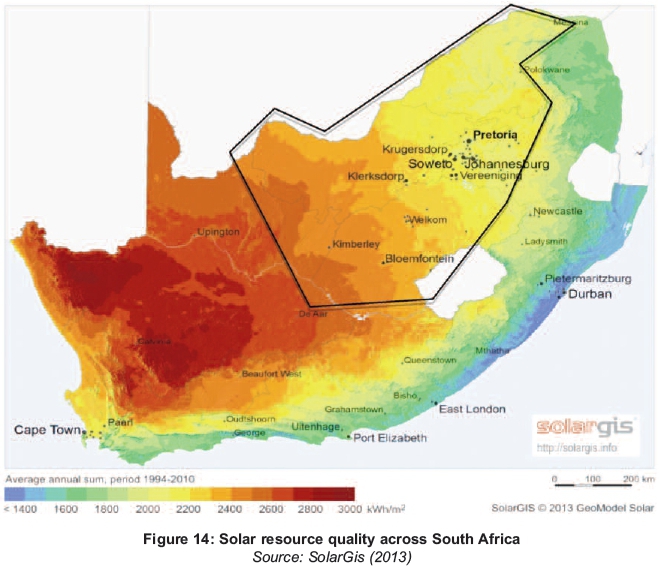
The data for solar photovoltaic (PV) technology are based on single-axis tracking devices. The global experience with solar PV technology at mining operations is considerable (see Table 1). The areas with high mining activity are indicated in Figure 14; the majority have an annual radiation of more than 2 000 kW/m2. The modular technology enables medium-sized projects. The service infrastructure is well established owing to an established market in South Africa (South African Photovoltaic Industry Association, 2013; Global Data, 2014).
Concentrating solar power
The data presented for concentrating solar power (CSP) are based on the technology of parabolic trough with synthetic oil and power tower with molten salt, as both technologies are commercially proven and available (Gauché, Brent & Von Backström, 2014). The initial investment is strongly positively correlated with the capacity factor. The global experience with CSP and mining operation is limited, with one grid-connected project in Chile (Table 1). The sun radiation in mining areas shows high potential to use CSP as a power source, as discussed with solar PV in Figure 14. The service infrastructure is established with several companies in South Africa, which have realized seven projects (National Renewable Energy Laboratory, 2015). Projects of up to 10 MW exist, but are not commercial as costs are too high (Fraunhofer ISE, 2013).
Wind power
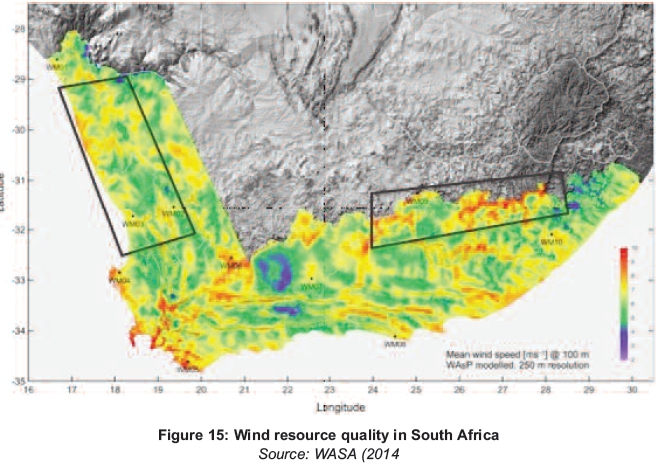
For the purpose of this paper, only on-shore wind technology was considered, as it is easier to carry out wind parks closer to the mining operations. The international experience with wind and mining operations is advanced, with nine established off- and on-grid projects (see Table 1). Figure 15 illustrates mining areas with the highest wind potential in South Africa. The overall power availability is medium, as wind conditions in the centre of South Africa are generally less favourable (Department of Trade and Industry, 2015). The service infrastructure in South Africa is well established, as several wind farms have been established and the responsible companies are located in the country. Projects can be realised on a small-to-utility scale (IEA, 2014; SA Wind Energy Association, 2015).
Geothermal
For the data of this paper, only the 'hot dry rock' method was considered, because it has the highest potential for electricity generation and future development (IRENA, 2014; Geothermal Energy Association, 2013). No experience with mining operations could be identified (see Table 1). Figure 16 indicates the mining locations with the highest potential. In granite areas, 3 000 m to 5 000 m have to be drilled. The service infrastructure is limited, as there are no larger projects in the country. Projects can be realised on a small to utility scale (Tshibalo et al., 2015).

Biomass
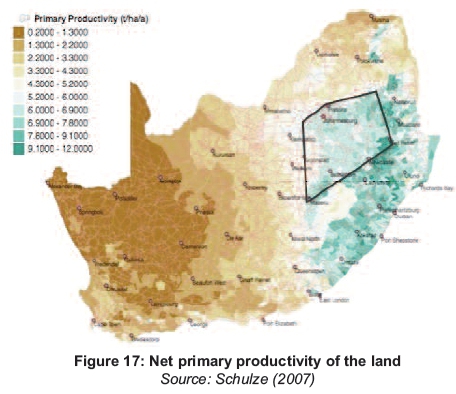
The data for electricity generation with biomass focuses on the matured technologies, including direct combustion in stoker boilers, low-percentage co-firing, anaerobic digestion, municipal solid waste incineration, landfill gas, and combined heat and power (IRENA, 2015a). No experience with biomass electricity generation could be identified globally (see Table 1). As can be seen in Figure 17, South Africa is a water-scarce country, which makes fuel availability medium with some potential in the north-east area. The service infrastructure is still a challenge, which lowers the reliability of the system and fuel supply (van Zyl, 2010; Bole-Rentel & Bruinsma, 2013; IRENA, 2012).
Battery storage
The data for lithium-ion and lead-acid batteries is presented, as cost and performance levels are improving, especially in comparison to sodium-sulphur batteries (IRENA, 2015b). Batteries can extend the capacity factors of non-baseload technologies, like solar PV and wind power (Dickens et al., 2014). Global experience is limited, with one operational project in Australia (see Table 1), as is service infrastructure. Two operational projects were identified with 10 kW and 20 kW (DOE, 2015; IRENA, 2015b).
Hydro power
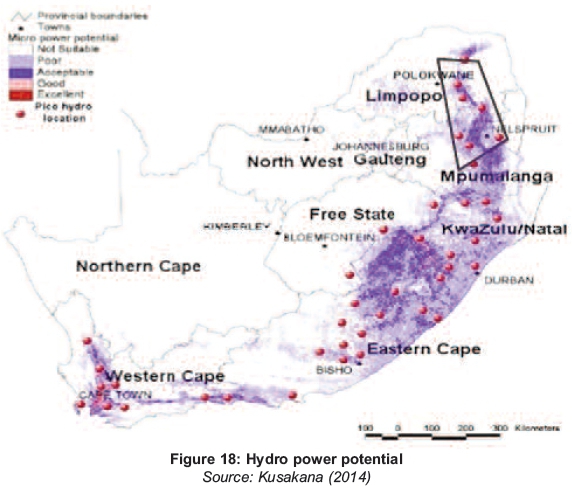
The data represented for hydro power excludes pumped storage. At present, one project in Chile represents limited experience with mining (see Table 1). Figure 18 shows that power source availability, especially for micro projects, is moderate in southwestern regions of South Africa. The service infrastructure is improving as more projects are being introduced, but it is still in its infancy. It is possible to realise projects on a small to utility scale (Klunne, 2012; Rycroft, 2014a). On-site executions are highly constrained, however, as the mining operation has to be close to the hydro facility.
3.3 Attractiveness business models
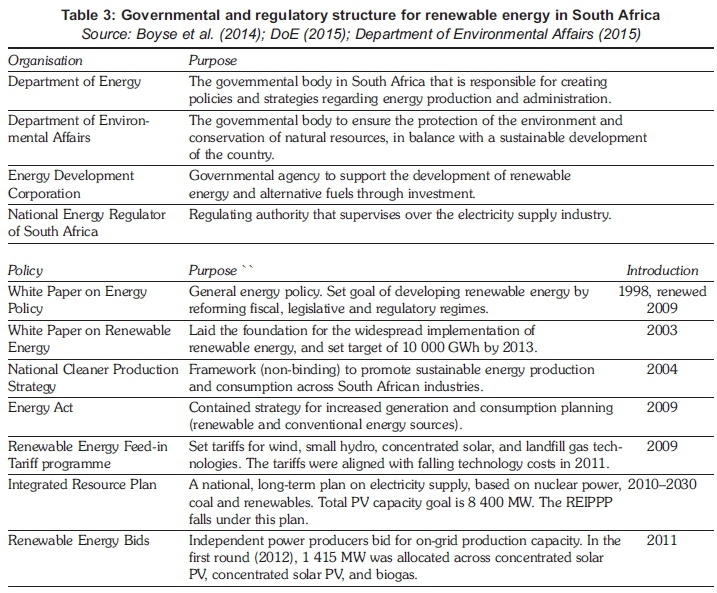
This section focuses on business models of renewable energy projects at mining operations, as initial expenses are considerably higher and the experience with present sources is well established. Table 3 provides a summary of the main organisations and the regulatory and policy framework for renewable energy in South Africa.
In South Africa, the government is presently not supporting the implementation of off-grid industrial electricity generation from renewable sources. However, there are plans to implement subsidies until 2020 for solar photovoltaic electricity generation (Ahlfeldt, 2013).
This section discusses the attractiveness of the different business models for South African mining corporations to execute renewable energy projects. Business models entailing wheeling agreements with Eskom were not considered, as costs can add up to 18% to the kWh price (Rycroft, 2014b; Haw, 2013). The models investigated are self-generation, industrial pooling, net metering, and self-generation for powering townships (Boyse et al., 2014; GIZ, 2014; Banerjee et al., 2014):
Self-generation model
In the case of the self-generation model, the mining corporation develops a renewable generation source to reduce electricity costs and to increase independence. Grid-connected mines use this model as a separate electricity source, which is only connected to the mine. It is possible to implement this model in two ways. The first is for the mine to develop, finance and operate the plant on its own land, using a subcontractor for the development. The second is to lease its own land to an independent power producer (IPP), who sells the electricity to the mine. The benefit of the self-generation model is that the smallest number of actors is involved, so that experts presently prefer it. The disadvantage is the high initial investment cost - which represents a shift from operating expenses (diesel fuel or Eskom electricity costs) to capital expenses (plant costs), making this model rewarding only in the long term. The risk for an IPP is the long-term commitment to only one client, the mine. Factors like changing commodity prices or operational expenses can lead, in the worst case, to the closure of a mine (Jamasmie, 2014).
Industrial pooling model
The industrial pooling model entails several corporations, with mining operations situated close to one another, forming a partnership to reduce electricity generation costs. The foundation of this model is the building of a consortium to enter a long-term power purchase agreement with shared renewable energy assets. As in previous models, the project can be realised by using combined financial investments and a subcontractor to build the plant. The plant would be situated on the land of one of the mining operations. Another option is to use an IPP. A mini-grid would be used to distribute the electricity. The advantage would be a lowering of the electricity costs as a result of a higher economy of scale than in the case of self-generation. The difficulty lies in the planning process of the model. Experience has shown that a joint capital investment of competitors is difficult to achieve, owing to different interests, diverse lifespans of the mines, and a lack of education about renewables.
Net metering model
The net metering model can only be implemented by grid-connected mines, which purchase electricity from the national supplier. Its purpose is to lower long-term electricity expenses, avoid potential electricity interruptions and use cleaner electricity. This model can be installed by the mine itself, using a subcontractor, or by an IPP. Eskom purchases the excess electricity produced by the renewable source. The benefit of the system is in gaining additional revenue for the operator of the system. In addition, no electricity is wasted, as all energy generated is used. The disadvantage of the model is that net metering is currently not formally supported by the regulatory framework in South Africa and is therefore not attractive.
Self-generation model for powering rural settlements
The self-generation model for powering rural settlements is especially for off-grid mines running on diesel generators. In this case, a rural settlement would be situated close to the mine. The community could be connected via a mini-grid through an own investment or an IPP. The outcome would be the reduction of electricity expenses for the mining corporation and rural electrification. The renewable electricity plant can be installed via a subcontractor, by the mine itself, or through an IPP. The neighbouring community would apply for government support to run a transmission line.
The advantage of the model is that selling the unused electricity to the community creates extra revenue - with the mine also contributing to one of the government target of expanding electrification. A difficulty presented by the model is the deviation of active mines from their core business. In addition, the process of obtaining the required permits from Eskom, NERSA and environment or land management offices is lengthy and difficult. The regulatory difficulties make this model unfeasible.
3.5 Carbon emissions tax
The South African government has announced its intention to launch a carbon emissions tax (Republic of South Africa, 2013). The bill is part of the commitment to reduce greenhouse gas emissions below business as usual by 34% by 2020 and 42% by 2025. The tax is planned to be introduced at a marginal rate of EUR 8.61 (ZAR 120) per ton of CO2. Taking into account the listed tax-free threshold, the effective carbon tax rate will vary between EUR 0.43 (ZAR 6) and EUR 3.44 (ZAR 48) per tonne CO2. All calculations are closely linked to the Department of Environmental Affair's mandatory reporting requirements. Entities will be liable for fossil fuel combustion emissions, industrial processes and product use emission, and fugitive emissions (National Treasury of South Africa, 2015; Swart, 2015).
According to the latest publication from the Treasury, the Draft Carbon Tax Bill includes the following features (National Treasury of South Africa, 2015):
1. Basic 60% tax-free threshold during the first phase of the carbon tax, from implementation date up to 2020.
2. Additional 10% tax-free allowance for process emissions.
3. Additional tax-free allowance for trade exposed sectors of up to 10%.
4. Recognition for early actions and/or efforts to reduce emissions that beat the industry average in the form of a tax-free allowance of up to 5%.
5. A carbon offsets tax-free allowance of 5-10%.
6. To recognise the role of carbon budgets, an additional 5% tax-free allowance for companies participating in phase 1 (up to 2020) of the carbon budgeting system.
7. The combined effect of all of the above tax-free thresholds will be capped at 95%.
There is, however, still much controversy about the actual design of the tax, the date of implementation and even if it will actually be implemented. A scenario analysis by Roger Baxter, CEO of the Chamber of Mines of South Africa (2015), offers two case scenarios of how the tax would affect two deep underground gold mines close to Johannesburg, owned by AngloGoldAshanti and SibanyeGold. The Sibanye case predicts a further 30% price increase from 2014 till 2017. The Anglo case forecasts its electricity tariff to increase from EUR 4.3 c/kWh in 2013 to EUR 10.9 c/kWh in 2020 (ZAR 60-152 c/kWh); without the tax an increase to EUR 10.4 c/kWh (ZAR145 c/kWh) is projected.
The treasury claims the tax will not affect the cost of Eskom electricity, as the utility might be excluded, or the existing environmental levy included in tariffs will be replaced by the tax. In addition, plans are still uncertain about a levy reduction and other 'revenue recycling' measures, which will be specifically aimed at not increasing costs in distressed sectors such as mining (Van Rensburg, 2015; Peyper, 2015; Dhawan, 2015; Seccombe, 2015).
4. Results and discussion
4.1 A possible fit of renewable sources to mining operations
Several renewable sources have half the levelised costs of diesel generators and are close to parity with Eskom, even without including forecast future price changes, which are also in favour of renewables. In the case of own investment, however, the disadvantage of renewables is the high initial capital expense, instead of current operational expenses. It can therefore be seen as an investment for long-term success.
The risk factor of high initial capital expenses, combined with limited global experience, necessitates the further education of decision-making leaders of mining corporations. The global renewable energy market only started to evolve in 2011, with the first and so far only project in South Africa being realised in 2012.
Most mines have a relatively constant baseload consumption, so that, considering the intermittency of most renewable sources, it is only possible to use such sources in hybrid versions. For a mine that is not grid-connected, a hybrid version with the currently used diesel generator was identified as most promising, as storage facilitates are still too expensive.
4.2 Current attractiveness of different renewable sources
The renewable technology with the highest potential for the majority of mining corporations in South Africa is solar PV. Initial investment costs are low in comparison to other renewable energy technologies, besides wind power, but roughly three times the price of present sources. As stated before, however, current levelised costs are half the amount of diesel generators and close to parity with Eskom. The global experience in this market is the most highly established, with 11 projects, demonstrating the success of the model (Table 1). The availability of the power source is also the best compared to the other renewable technologies. Furthermore, owing to the numerous companies situated in South Africa, the service infrastructure is well developed. Wind energy is selected as the second-best option. The disadvantage, in comparison to solar PV, is the lower availability of the power source, which decreases the potential for on-site realisations. The third and last option selected for its potential is geothermal technology. Though the initial investment costs are high, the levelised costs are low. Disadvantages are that there is no experience with this technology within mining operations, service infrastructure is low, and the technology is relatively new, especially in South Africa. The geothermal option does, however, have the potential for a baseload source with a capacity factor of up to 90%. Solar PV and wind, on the other hand, have to be used as a hybrid version to achieve baseload characteristics.
All other renewable energy technologies were evaluated as unsuitable at the current state of development. The initial investment costs for CSP and battery storage are too high. There is no experience and a low service infrastructure with biomass. A combination of low power-source availability, little experience within mining operations, and a very young service infrastructure are the reasons for not selecting hydro power as an option.
4.3 Potential of different business models
The business model of self-generation is selected as the most attractive one in South Africa. The model entails the least actors, which simplifies the realisation process. As far as the regulatory framework is concerned, this is the most feasible option, as no additional organisations are involved or licences needed. Wheeling options were not considered, as additional costs are up to 18% of the electricity price and levelised costs of renewables are close to parity with Eskom. The option of using an IPP is limited, especially for smaller, remote mines. Some of the reasons are the elevated risk factor of international institutions investing in South Africa, the risk that the mine as the only customer may close down, and limited global experience with renewable projects at mining operations (Reeves, Whittaker & Ellinghaus, 2015; Baker & McKenzie, 2013).
4.4 Possible impact of the CO2 tax
The planned South African CO2tax of EUR 8.61 (ZAR 120) with an actual effective impact of EUR 0.43-3.44 (ZAR 6-48) still involves a lot of controversy regarding its realisation and it is not yet certain if or when it will be implemented. A case study by two large mining corporations operating in South Africa states that the tax would spur their current negative economical development; the tax would, however, add to the attractiveness of renewable sources to reduce CO2 emissions (Forer et al., 2014).
5. Conclusion
This paper set out to determine the influences shaping the market potential of renewable sources of electricity at mining operations in South Africa. It argued that the most attractive renewable electricity sources for the corporations are, in descending order of suitability, solar PV, on-shore wind, and geothermal technology. Owing to the electricity usage patterns of mining operations and the intermittency of, especially, solar PV and wind, a hybrid version with current sources must be used. To execute a project, the business model of self-generation was identified as the most promising, and can be realised through own investment or an IPP agreement.
The past and projected future economic situation of mining corporations operating in South Africa creates the opportunity for renewable electricity sources to contribute to their long-term success. The advantages would be greater independence from diesel and Eskom's electricity supply, lower electricity costs and reduced CO2 emissions. Considering the shift from operational to capital expenses, however, there are some key challenges: firstly, the need to foster greater trust in investors so that power purchase agreement projects may be realised, and, secondly and of greater importance, the need to encourage further education for decision-making leaders of mining corporations so that they are able to understand the emerging opportunity presented by renewable electricity sources (Judd, 2014b). Further research should, therefore, be conducted to help these leaders to better understand the concept of renewable electricity in relation to their specific needs. Ideally, the research should be conducted from the perspective of these mining leaders in order to make the knowledge more plausible and accessible. Possible strategic approaches that could add value and structure to the research are the multi criteria decision analysis methods, the strategic planning process, and Porter's value chain (Grant & Jordan, 2012; Hough et al., 2011).
Notes
1 The Energy Intensive User Group of Southern Africa (2014a) is a non-profit organisation whose members are energy-intensive consumers - of which 47% are involved in mining and quarrying.
2 efers to the amount of carbon dioxide gas (CO2) that is emitted as a result of, among other things, the consumption of fossil fuels (Reddy & Jorgensen, 2014).
3 Summits of mining corporations and renewable energy companies started in 2013, to develop and discuss the market of renewables in mining operations (Energy and Mines, 2015).
4 For the purpose of this study the following exchange rates from the 13.07.2015 were used: EUR 1 = USD1.10 (CNN Money, 2015a); EUR 1 = ZAR 13.94 (CNN Money, 2015b).
5 This method considers the predicted lifetime-generated energy and estimates a price per unit of electricity produced (Branker et al., 2011). The different sources assumed: share of equity of 20-40%; share of debt of 60-80%; cost of capital of 8-10%; cost of debt of 6-8% and a lifespan of 20-25 years.
References
Abengoa Solar. 2015. Industrial installation of concentrating solar power in Chile. [ Links ] [Online]. Available: www.abengoasolar.com/web/en/nuestras_plantas/plantas_para_terceros/chile/index.html [2015, January 31].
Ahlfeldt, C. 2013. The localisation potential of photovoltaic PV and a strategy to support large scale rollout in South Africa. South Africa: WWF SAPVIA, Department of Trade and Industry, Pretoria. [ Links ]
Alton, T., Arndt, C., Davies, R., Hartley, F, Markrelov, K., Thurlow, J. & Ubogu, D. 2014. Introducing carbon taxes in South Africa. Applied Energy 116, March:344-354. [ Links ]
Ambros, D. 2014. Project 'zimbi': PV/diesel hybrid power case study. Final report. Unterhaching: Cronimet Power Solutions Gmbh. [ Links ]
Baker & McKenzie. 2013. The future of clean energy in Africa. Final report. Chicago: Green Energy Pipeline. [ Links ]
Banerjee, G.S., Romo, Z., McMahon, G., Toledano, P & Robinson, P. 2014. The power of the mine: A transformative opportunity for sub-Saharan Africa. Final report. Washington D.C.: World Bank Group, ESMAP, Africa Region Sustainable Development. [ Links ]
Baxter, R. 2015. Presentation of Chamber position on carbon tax to the Davis Tax Committee. Johannesburg: Chamber of Mines of South Africa. [ Links ]
Beukman, H. 2015. Mineral sand resources. Presentation. Johannesburg: MSR. [ Links ]
Bole-Rentel, T. & Bruinsma, D. 2013. The bioenergy sector in South Africa. Den Haag: tbr Consulting, ECN, Bruinsma Solutions. [ Links ]
Boyse, F, Causevic, A., Duwe, E. & Orthofer, M. 2014. Sunshine for mines: Implementing renewable energy for off-grid operations. Washington, DC: Carbon War Room. [ Links ]
Branker, K., Pathak, M.J.M. & Pearce, J.M. 2011. A review of solar photovoltaic levelized cost of electricity. Renewable and Sustainable Energy Reviews, 159: 4470-4482. [ Links ]
Brodsky, S., Curnow, P, Fevre, M., Ghannam, M., Nasrollah, K. & O'Brien, J.P 2013. The future of clean energy in Africa. Chicago: Baker & McKenzie. [ Links ]
Chamber Of Mines. 2014. Facts and figures 2014. Johannesburg: Chamber of Mines of South Africa. [ Links ]
Cornish, L. 2013. Energy management - delivering operational excellence. Inside Mining 61:60-61. [ Links ]
Creamer, T. 2012. Big users urge hard line on Eskom costs, as utility delays tariff submission. Mining weekly. Available at www.miningweekly.com/article/big-users-urge-hard-line-on-eskom-costs-as-utility-delays-tariff-submission-2012-08-31 [2015, January 26]. [ Links ]
Crespo, T. 2015. Despite barriers to adopting, costs pressure driving renewed mining interest in renewable energy. Toronto: Energy and Mines. [ Links ]
Cronimet Power Solutions. 2015. Project Thabazimbi chromium mine. Available: www.crmps.com/en/thabazimbi.php [2015, January 30]. [ Links ]
Department of Environmental Affairs. 2015. Department of Environmental Affairs, Republic of South Africa. Available: www.environment.gov.za [2015, April 6]. [ Links ]
Dhawan, R. 2015. Carbon tax in the mining sector. Business media live. Available: www.businessmedialive.co.za/the-distributional-impacts-of-a-carbon-tax-in-the-mining-sector/. [2015, November 25]. [ Links ]
Dickens, A., Singh, C., Bosset, P., Mitchell, V., Cosgrove, J., McLoughlin, S. & Cuadrado, P 2014. Energy storage: Power to the people. London: HSBC Global Research. [ Links ]
Department of Energy. 2013. Integrated resource plan for electricity IRP 2010-2030. Johannesburg: Department of Energy, Republic of South Africa. [ Links ]
Department of Energy. 2015. Department of Energy, Republic of South Africa. Available: http://www.doeirp.co.za [2015, April 6]. [ Links ]
Department of Trade and Industry. 2015. The wind energy industry localisation roadmap in support of large-scale roll-out in South Africa. Johannesburg: Department of Trade and Industry, Republic of South Africa. [ Links ]
Deutsche Gesellschaft für Internationale Zusammenarbeit. 2014. Alternative energy in mining. Pretoria: German Cooperation; Deutsche Gesellschaft für Internationale Zusammenarbeit; South African Institute of International Affairs. [ Links ]
E-CL. 2015. E-CL and Quiborax to build solar PV plant. Available: www.ecl.cl/prontus_ecl/site/artic/20130705/pags/20130705115312.php [2015, January 30]. [ Links ]
Elliott, M. 2014. Business risks facing mining and metals. London: Ernst & Young Global Mining & Metals Center. [ Links ]
Enercon. 2015. Windenergieanlagen. Available: http://www.enercon.de/dede/windenergieanlagen.htm [2015, January 31]. [ Links ]
Energy and Mines. 2015. Introduction to renewable energy with mining operations. Available: http://energyandmines.com [2015, March 17]. [ Links ]
Energy Intensive User Group of Southern Africa. 2014b. Electricity cost as a percentage of annual expenditure. Available: www.eiug.org.za/about/membership/ [2014, December 27]. [ Links ]
Eskom. 2010. The energy efficiency series: Towards an energy efficiency mining sector. Johannesburg: Eskom Demand Side Management Department. [ Links ]
Eskom. 2013. Map of Eskom power stations. Available: www.eskom.co.za/Whatweredoing/ElectricityGeneration/PowerStations/Pages/Map _Of_Eskom_Power_Stations.aspx [2015, April 4]. [ Links ]
Eskom. 2014. Environmental management. Available: http://financialresults .co.za/2012/eskom_ar2012/fact-sheets/013.php. [2015, April 4]. [ Links ]
Eskom. 2015a. Transmission development plan 2015-2024. Johannesburg: Eskom. [ Links ]
Fichtner. 2010. Technology assessment of CSP technologies for a site specific project in South Africa, final report. Johannesburg: The World Bank & ESMAP. [ Links ]
First Solar. 2015. Rio Tinto's project. Available: www.firstsolar.com/en/about-us/projects [2015, January 30]. [ Links ]
Forer, G., Warren, B., O'Flynn, B., Elliott, M., Mitchell, P. & Downham, L. 2014. Mining: The growing role of renewable energy. London: Ernst & Young. [ Links ]
Fouché, N. 2013. Palabora mining company: The effect of power tariff increases. Management presentation. Phalaborwa: Palabora Mining Company. [ Links ]
Fraunhofer ISE. 2013. Levelized cost of electricity: Renewable energy technologies. Freiburg: Fraunhofer Institute for Solar Energy Systems. [ Links ]
Galaxy Resources. 2015. Mt Cattlin mining location. Available: www.galaxyresources.com.au/pro_raven_mt_cattlin.shtml [2015, January 31]. [ Links ]
Gauché, P, Brent, A. & Von Backström, T.W. 2014. Concentrating solar power: Improving electricity cost and security of supply, and other economic benefits. Development Southern Africa 315:692-710. [ Links ]
Geothermal Energy Association. 2013. Geothermal power: International market overview. Washington D.C.: Geothermal Energy Association. [ Links ]
Gets, A. & Mhlanga, R. 2013. Powering the future: Renewable energy roll-out in South Africa. Johannesburg: Greenpeace South Africa. [ Links ]
Gielen, D. 2012. Power sector costing study. Abu Dhabi: International Renewable Energy Agency. [ Links ]
Glencore. 2015. Powering a mine on wind. Available: http://www.glencore.com/sustainability/case-studies/p/powering-a-mine-on-wind [2015, February 1]. [ Links ]
Global Data. 2014. Diesel generator market - global market size, equipment share and competitive analysis to 2020. London: Global Data Research Institute. [ Links ]
Haw, H. 2013. Overview of solar PV in South Africa. Cape Town: South African Photovoltaic Industry Association. [ Links ]
Hinkley, J., Curtin, B., Hayward, J., Wonhas, A., Boyd, R., Grima, C., Tadros, A., Hall, R., Naicker, K. & Mikhail, A. 2011. Concentrating solar power-drivers and opportunities for cost-competitive electricity. Victoria: CSIRO. [ Links ]
International Energy Agency. 2011. Geothermal heat and power roadmap. Paris: International Energy Agency. [ Links ]
International Energy Agency. 2014. Africa energy outlook: A focus on energy prospects in Sub-Saharan Africa. Paris: International Energy Agency. [ Links ]
International Monetary Fund. 2014. World economic outlook. Washington D.C.: International Monetary Fund. [ Links ]
International Renewable Energy Agency. 2012. Biomass for power generation. Abu Dhabi: International Renewable Energy Agency. [ Links ]
International Renewable Energy Agency. 2013. Hybrid power systems. Abu Dhabi: International Renewable Energy Agency. [ Links ]
International Renewable Energy Agency. 2014. Estimating the renewable energy potential in Africa: A GIS approach. Bonn: International Renewable Energy Agency. [ Links ]
International Renewable Energy Agency. 2015a. Renewable power generation costs in 2014. Bonn: International Renewable Energy Agency. [ Links ]
International Renewable Energy Agency. 2015b. Battery storage for renewables: Market status and technology outlook. Bonn: International Renewable Energy Agency. [ Links ]
International Renewable Energy Agency. 2015c. Africa power sector: Planning and prospects for renewable energy. Bonn: International Renewable Energy Agency. [ Links ]
Jamasmie, C. 2014. Anglo American considers closing platinum mines in South Africa. Mining. Available: www.mining.com/anglo-american-considers-closing-platinum-mines-in-s-africa-98146/ [2015, April 6]. [ Links ]
Judd, E. 2014a. Positioning mines to meet the mining industry's energy needs. Toronto: Energy and Mines. [ Links ]
Judd, E. 2014b. Sincerity and patience required for renewables in mining sector. Toronto: Energy and Mines. [ Links ]
Klein, S.J.W. & Whalley, S. 2015. Comparing the sustainability of U.S. electricity options through multi-criteria decision analysis. Energy Policy 79 April:127-149. [ Links ]
Klunne, W.J. 2012. Current status and future developments of small and micro hydro in Southern Africa. Journal of Energy in Southern Africa 243:14-25. [ Links ]
Kohler, M. 2014. Differential electricity pricing and energy efficiency in South Africa. Energy 641:524-532. [ Links ]
Kusakana, K. 2014. A survey of innovative technologies increasing the viability of micro-hydro power as a cost effective rural electrification option in South Africa. Renewable and Sustainable Energy Reviews, 37, September:370-379. [ Links ]
Lazard. 2014. Levelized cost energy analysis - version 8.0. New York: Lazard Asset Management. [ Links ]
Levesque, M., Millar, D. & Paraszczak, J. 2014. Energy and mining. Journal of cleaner production 84 (December):233-255. [ Links ]
Maasdam, R. 2015. Energy crisis - The case of South Africa. Johannesburg: Rabobank Economic Research Department. [ Links ]
MAKE Consulting. 2013. Global wind turbine trends 2012: Lowering the levelized cost of electricity. Aahhus: MAKE Consulting. [ Links ]
Mathews, E.H. 2005. Implementation of DSM strategies at the Kopanang Mine. Journal of Energy in Southern Africa 162:32-37. [ Links ]
Metric Conversion. 2015. Metric tons to ounces. Available: http://www.metric-conversions.org/weight/metric-tons-to-ounces.htm [ 2015, December 1]. [ Links ]
Michigan State University. 2006. South Africa: Industrial areas, mines, and ports. Available: http://overcomingapartheid.msu.edu/image.php?id=65-254-103 [2015, April 3]. [ Links ]
Mostert, M. 2014. A quantitative method for selecting renewable energy projects in the mining industry based on sustainability. Master's thesis, University of the Witwatersrand, Johannesburg, South Africa. [ Links ]
Mulaudzi, S.K., Muchie, M. & Makhado, R. 2012. Investigation of the solar energy production and contribution in South Africa. African Jurnal of Science, Technology, Innovation and Development, 44:233-254. [ Links ]
National Treasury of South Africa. 2015. Publication of the Draft Carbon Tax Bill for public comment. Pretoria: Department of National Treasury of South Africa. [ Links ]
Ngugi, PK. 2012. What does geothermal cost? - the Kenya experience. El Salvador: United Nations University. [ Links ]
National Renewable Energy Laboratory. 2015. Concentrating solar power projects in South Africa. Colorado, USA: National Renewable Energy Laboratory. [ Links ]
Organisation for Economic Co-operation and Development. 2014. Economic Outlook no 95 - long term baseline projections. Paris: Organisation for Economic Co-operation and Development. [ Links ]
Organisation of the Petroleum Exporting Countries. 2014. World Oil Outlook. Vienna: Organisation of the Petroleum Exporting Countries. [ Links ]
Pattern Energy. 2015. El Arrayán wind. Available: http://patternenergy.com/en/operations/projects/el_arrayan [2015, January 30]. [ Links ]
Petticrew, M. & Roberts, H. 2006. Systematic reviews in the social science: A practical guide. Oxford: Blackwell. [ Links ]
Peyper, L. 2015. Can a carbon tax still fly as SA mining sinks? Miningmx, 13 August. Available: www.miningmx.com/page/special_reports/mining-yearbook/mining-yearbook-2015/1653564-Can-a-carbon-tax-still-fly-as-SA-mining-sinks#.VlXD_LSZa-I. [2015, November 25]. [ Links ]
Rame Energy. 2014. Past projects. Available: www.rame-energy.com/operations/past-projects [2015, January 30]. [ Links ]
Reddy, V. & Jorgensen, P. 2014. Managing greenhouse gas emissions in mining: Opinion. ReSource 163:12-13. [ Links ]
Redevia. 2015. Mining location in Tanzania. Available: www.redaviasolar.com/mines [2015, January 31]. [ Links ]
Rehman, S., Alam, M., Meyer, J.P AND Al-Hadhrami, L.M. 2012. Feasibility study of a wind-pv-diesel hybrid power system for a village. Renewable Energy 38:258-268. [ Links ]
Reeves, R., Whittaker, S. & Ellinghaus, S.D. 2015. Conference Interview, 24 February. Johannesburg: Energy and Mining Summit. [ Links ]
Renewable Energy Resource Cooperation. 2014. Suriname solar project. Available: www.rerc.us/projects.htm [2015, January 30]. [ Links ]
Republic of South Africa. 2013. Reducing greenhouse gas emissions and facilitating the transition to a green economy. Carbon Tax Policy Paper. Pretoria: National Treasury. [ Links ]
Rycroft, M. 2014a. The potential of small hydro power plants in southern Africa. Energize May 2014:18-22. [ Links ]
Rycroft, M. 2014b. Wheeling and dealing: Connecting electricity suppliers and customers. Energize April 2014:44-48. [ Links ]
Seccombe, A. 2015. Chamber of mines says carbon tax will damage industry. Business Day, 20 May. Available: www.bdlive.co.za/business/mining/2015/05/20/chamber-of-mines-says-carbon-tax-will-damage-industry [2015, November 25]. [ Links ]
Schulze, R.E. 2007. Primary production, in R.E. Schulze ed. South African atlas of climatology and agrohydrology. Water Research Commission, Pretoria, RSA, WRC Report 1489/1/06, Section 14.1. [ Links ]
Société Nationale Industrielle et Minière de Mauritanie. 2013. Inauguration of SNIM's wind power plant. Available: http://www.snim.com/e/index.php/news-a-media/news/10-inauguration-of-snims-wind-power-plant.html [2015, February 1]. [ Links ]
Soitec. 2015. Concentrix™ technology in action around the world. Available: www.soitec.com/en/products-and-services/solar-cpv/our-references [2015, February 1]. [ Links ]
Solairedirect. 2012. The Dayton project. Available: www.solairedirect.com/international-presence/chile [2015, January 31]. [ Links ]
SolarGis. 2013. Direct normal irradiation - South Africa. Available: http://solargis.info/doc/postermaps [2016, April 19]. [ Links ]
Solarpack. 2012a. Calama solar 3 project. Available: www.solarpack.es/ing/calama.aspx [2015, January 30]. [ Links ]
Solarpack. 2012b. Pozo Almonte solar project. Available: www.solarpack.es/ing/pozo-almonte.aspx [2015, January 31]. [ Links ]
South African Photovoltaic Industry Association. 2013. South Africa PV industry - overview. Johannesburg: South African Photovoltaic Industry Association. [ Links ]
South African Wind Energy Association. 2015. Wind industry growth. Available: http://www.sawea.org.za/resource-library/useful-information/109-industry-growth.html [2015, March 25]. [ Links ]
Statistics South Africa. 2015a. Gross domestic product: Second quarter 2015. Pretoria: Stats SA publications. [ Links ]
Statistics South Africa. 2015b. Mining: Production and Sales, September 2015. [ Links ] [Online}. Available: www.statssa.gov.za/?page_id=1856&PPN=P2041&SCH=6230. [2015, November 15].
Stellar Energy. 2013. Barrick-Western power plant. Available: www. stellarenergy.com/case-studies/commercial-solar/commercial/item/barrick-western-power-plant.html [2015, January 31]. [ Links ]
Sun Edison. 2013. Amanecer solar CAP. Available: www.sunedison.cl/chile [2015, January 31]. [ Links ]
Swart. I. 2015 Draft Carbon Tax Bill released: South Africa moves to reduce greenhouse gas emissions. Johannesburg: Deloitte and Touche. [ Links ]
Toledano, P 2012. Leveraging the mining industry's energy demand to improve host countries' power structure. Working paper. New York: Colombia University. [ Links ]
Tshibalo, A.E., Dhansay, T., Nyabeze, P, Chevallier, L., Musekiwa, C. & Olivier, J. 2015. Evaluation of the geothermal energy potential for South Africa. Proceedings World Geothermal Congress 2015 Melbourne. Johannesburg: University of South Africa. [ Links ]
Van Rensburg, D. 2015. Carbon tax? What carbon tax? Fin24, 8 November. Available: www.fin24.com/Economy/Carbon-tax-What-carbon-tax-20151106. [2015, November 25]. [ Links ]
Van Staden, P. 2015. Energy management Sasol. Presentation. Johannesburg: Sasol. [ Links ]
Van Zyl, E. 2010. Bioenergy potential in sub-Saharan Africa. Stellenbosch: Stellenbosch University, Department of Microbiology. Vergnet Wind Turbines. 2014. El Toqui. Available: www.vergnet.com/en/centrale-eltoqui.php [2015, January 30]. [ Links ]
WASA. 2014. Wind atlas for South Africa. Available: http://www.wasaproject.info [2015, April 2]. [ Links ]
Wernecke, G. 2015. Senior Project Manager, Cronimet Mining Power Solutions SA. Johannesburg: Personal interview, [ Links ] [May, 6].
Williams, N.C. 2014. Demand reduction and responsive strategies for underground mining. PhD thesis, University of Exeter, Exeter, England. [ Links ]
Wirth, G. 2015. Technical manager at Cronimet Power Solutions. Unterhaching: Cronimet Power Solutions. [ Links ]
Personal interview. World Bank Group. 2015a. Africa Power-Mining projects database. Washington D.C.: World Bank Group. [ Links ]
World Bank Group. 2015b. Commodity markets outlook. Washington D.C.: World Bank Group. World Bank Group. 2015c. Economic data South Africa. Available: http://data.worldbank.org/country/south-africa. [2015, November 13]. [ Links ]
Wouter, F 2014. Energy management AGA. Presentation. Johannesburg: AngloGold Ashanti. [ Links ]
* Corresponding author: Tel: 021 8089530, Email: acb@sun.ac.za

