


Services on Demand
Article
 English (pdf)
 Article in xml format
 Article references
Indicators

Related links
-
 Cited by Google
 -
 Similars in Google
Share

 Permalink
Journal of Energy in Southern Africa
On-line version ISSN 2413-3051
Print version ISSN 1021-447X
J. energy South. Afr. vol.27 n.1 Cape Town Feb. 2016
RESEARCH ARTICLES
Evaluation of a wind farm project for a smart city in the South-East Coastal Zone of Mauritius
A.Z. Dhunny; M.R. Lollchund*; S.D.D.V. Rughooputh
Department of Physics, University of Mauritius, Reduit, Mauritius
ABSTRACT
A study was carried out to analyse the potential of wind energy in the generation of electricity for a smart city which is located in the South-East Coastal Zone of Mauritius. A flat land area of 10 square km situated about 3.5 km from the smart city was chosen for the placement of a wind farm. The viability of the location was assessed by analysing ten years (Jan 2005 to Dec 2014) of mean hourly wind speed measured at a height of 10 m above ground level (m.a.g.l). The speed data was filtered according to the AWS (1997) guidelines and computed at 60 m.a.g.l using the power law formula. At this height, the average wind speeds was approximately 6.5 m/s, which was considered cost effective, as per the European Wind Energy Union guidelines for the harvesting of wind power. Estimated yearly power generated by a wind farm consisting of 40 wind turbines, each of rating capacity 275 kW, placed at a hub height of 60 m were made. The study resulted in an investment proposal for a 11 MW wind farm project in Mauritius.
Keywords: wind energy assessment, two-parameter weibull distribution, wind power, wind turbines
1. Introduction
Energy is the basis of the world's economy, combining with all other entities that are vital for economies. The quest to meet growing energy demand of the global population initiated numerous research in a wide range of environmental application of renewable energy (RE) (Park & Law, 2015). Currently, the wind sector stands out as one of the most promising RE as wind is an inexhaustible diurnal resource that can provide significant quantities of energy to support the needs of a country (Ackerman & Soder, 2002). Exploitation of wind energy for the production of electricity increased around the world at an accelerating pace more than ten 10 years ago (Marciukaitis et al., 2008). Wind energy is currently being exploited widely in many countries such as the USA, Germany, Spain, China, India, UK, Denmark and Canada (Adelaja et al., 2012; Coskun & Turker, 2012). According to the American Wind Energy Association (AWEA) and the European Wind Energy Association (EWEA), cumulative global wind energy generating capacity exceeded 282 GW in 2012, with an increase of about 80% of new capacity that was installed worldwide during the past decade (WEC, 2014). Such a vast RE resource has a potential to be exploitable by small island developing states (SIDS) such as the island of Mauritius. The work of Dhunny at al. (2015) showed the potentials of wind energy for Mauritius at different locations comparable with those of countries already reaping the benefits of this technology.
An accurate wind resource assessment is an important and critical factor to be well understood for harnessing the power of the wind (Marciukaitis et al., 2008). The identification of potential areas that might be suitable for the development of wind projects are enhanced by accurate wind resource data available at specific chosen locations (Radics & Bartholy, 2008). In its budget speech for the financial year 2015-2016, the Government of Mauritius clearly indicated its vision to build up eight 8 smart cities throughout the island. These are Omnicane Mon-Tresor Airport City in the South East Coastal Zone, St-Felix Village Project in the South, Medine Integrated Park in the West, Azuri phase 2 and Terra Projects in the North, Riche-Terre and Highlands Project in the centre and Roches-Noires in the North-East Coastal Zone. The smart cities are expected to produce a significant amount of the energy of their own using RE sources such as solar and wind. In this work, the potential of wind energy was assessed for one of the smart cities, the Omnicane Mon Tresor Airport. The placement of a potential wind farm is also analysed along with the expected power output yielded at that location to furbish the smart city as well as the project costing in terms of initial investment and expected return on investment.
Section 2 discusses the wind assessment method utilised. Section 3 describes the general wind flow patterns over Mauritius, as well as the site of interest where data was collected for this study. In Section 4, the main results obtained are analysed and discussed. Section 5 enumerates the project cost and Section 6 outlines the main conclusions of this work.
2. Wind energy assessment
The assessment of wind energy potential of a region requires long term data related to the wind speed and an accurate determination of its distribution. The variations in wind speed can be characterised by two functions, namely,the probability density function (PDF) and the corresponding cumulative density function (CDF). In literature, the wind speed frequency distribution for a given location was represented by different and various PDFs such as Burr, Weibull, Lognormal, Normal, Rayleigh, Gamma and Frechet (Kollu et al., 2012; Morgan et a/.,2010; Abbas et al., 2012; Masseran et al., 2013). Dhunny et al. (2014) performed a statistical analysis on the wind speed data of the two meteorological stations, Plaisance and Vacoas. The authors undertook to fit their data with these PDFs and compared the results using the Chi-Square, Kolmogorov and Anderson-Darling goodness-of-fit tests. The results indicated that both sets of wind speed data were more significantly represented by the Weibull and Burr distributions. For this study, the Weibull distribution was solely considered. A review of the wind assessment literature revealed that the Weibull PDF fits most accurately a variety of wind speed data measured at different geographical locations in the world (Carta et al., 2009; Altunkaynak et al., 2012). Moreover, by finding the shape parameter and scale factor of the Weibull distribution that represents the wind speed data, direct estimates of the expected wind power can be made (Mirghaed & Roshandel, 2013). During the last decade, research was undertaken on the wind characteristics and wind power potential in many countries around the world (Tarkowski & Uliasz-Misiak, 2003). Examples include Tunisia (Zghal et al., 2011), eastern Mediterranean (Sahin et al., 2005), Turkey (Gokcek et al., 2007a; Ucar & Balo, 2009b) Nigeria (Ngala et al., 2006), Iran (Keyhani et al., 2010), Columbia (Jimenez et al., 2011), Egypt (Shata & Hanitsch, 2006), Kuwait (Al-Nassar et al., 2007), coastal areas of Jiwani, Pakistan(Lehri et al., 2013) and Greece (Kaldellis, 2002) among others.
2.1 The Weibull PDF
Knowledge of the wind speed frequency distribution plays an important role for the estimation of wind potential in any location (Azad et al., 2014). When the distribution of wind speed is known, both the wind power potential and economic viability of the site can be calculated. The two-parameter Weibull distribution /(υ), most commonly known for its high accuracy for wind speed data analysis (Zghal et al., 2011), is expressed as Equation 1.
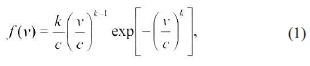
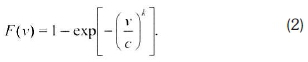
where c is the Weibull scale parameter (same dimension as ), which indicates the wind regime at that location and k is a dimensionless Weibull shape parameter (Abed & El-Mallah, 1997). The cumulative distribution function F(v), which is the integral of f(v) in the range of (0,v), is expressed according to Equation 2.
The mean and variance are respectively given by Equations 3 and 4:
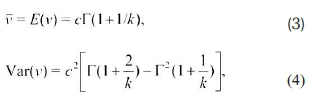
where Γ is the gamma function. To estimate the parameters k and c for a given set of measured velocity data, numerous methods were proposed in the literature (Mann et al., 1974). The most common one is the Maximum Likelihood Estimation (MLE), of which details about the method is found in the work of Harris & Stocker (1998).
2.2 Wind speed variation with altitude
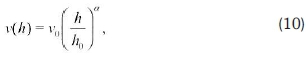
As wind turbine can be placed at different heights, the wind speed data need to be measured at such heights by using the power law which is one of the most accepted expression in the literature (Zekai Sen & Erdik, 2012). This law describes the vertical variation of wind speed and represented by Equation 5.
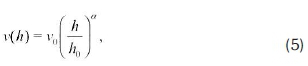
where v(h) is the wind speed at the hub height h, v0is the wind speed at measured height and α wind shear power law exponent. The value for α varies from 0.1 over the tops of steep hills to 0.25 in sheltered locations. For flat coastal regions, α is taken as 0.143 (1/7), which is the typical value used in most research (Youm et al., 2005).
As the wind velocity varies with height, it is evident that the Weibull parameters also change with height. Oyedepo et al. (2012) provide the expressions given by Equations 6 and 7:
and
where c0 and k0are respectively the scale factor and shape parameter at the measured height h0.
2.3 Estimation of wind power density and annual energy output from a wind turbine
The wind power Pwind(v) that can be captured by a wind turbine is given by the product of the mass flow rate entering the rotor blades of the wind turbine and the kinetic energy per unit mass in the wind. It is estimated by Equation 8.
where ρ is the mean air density (assumed to be 1.225 kg/m in this study), the A is the swept area of the rotor blades and the is the wind speed. As stated by Ettoumi et al. (2008), the instantaneous electrical energy W(v) generated by a wind turbine depends on the efficiency and the instantaneous local wind speed and is given as Equation 9.
where g(v) (as given by the manufacturer) is the efficiency of the turbine at speed v .The mean annual energy output of the wind turbine is given by Equation 10.
where Nh is the number of hours in a year and vin and voutare the cut-in and cut-off wind speeds of the turbine respectively (Jimenez et al., 2011).
2.4 Turbulence
The dissipation of the wind's kinetic energy into thermal energy causes turbulence in the wind. Turbulent wind have a moderately steady mean over time periods of approximately an hour. But over short times it has quite a big disparity. Turbulence can be considered as the arbitrary wind speed fluctuations imposed on the mean wind speed, which occurs in all three 3 directions: longitudinal, tangential and vertical. It is important to note that existence of turbulence decreases the power and causes a fatigue stress in the wind turbine (Oh et al., 2012; Mirhosseini et al., 2011).
2.41 Turbulence intensity
Turbulence intensity is the ratio of the standard deviation of the wind speed to the mean (Manwell et al., 2002). As stated before, the length is in the vicinity of one hour. Turbulence intensity changes with the mean wind speed, the surface roughness, the atmospheric stability and the topographic features (Frost et al., 1978). The International Electrotechnical Commission (IEC) (IEC, 2005; IEC, 2008) defines turbulence intensity into different classes for wind turbine constructions.
3. Site description and data collection
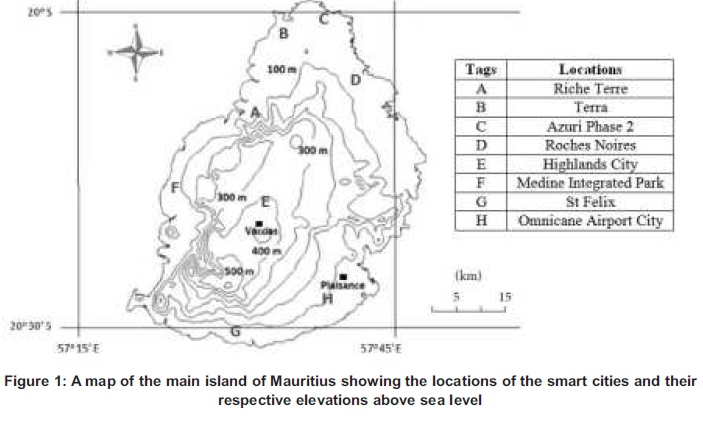
The island of Mauritius is found at the edge of the tropics, situated below the equator, at the latitude 2017' south and longitude 5750 ' east (see Figure 1). This island is of volcanic origin and forms part of the Mascarene islands. The main land of Mauritius spans over 60 km in the north-south direction and 45 km in the east-west direction. Due to its geographical location, Mauritius is influenced by two types of wind: the South East Trade Winds and the Westerlies. The south hemisphere trades are stronger than the northern ones. This is due to the larger areas of land along with their frictional effects in the northern part of the island. In the hottest months of the Northern Hemisphere, a low-level cross-equatorial flow is experienced in the western Indian Ocean. This wind can reach 1000-1500 m above the surface, though in April the flow is weak and nearly disappears in May (Padya, 1989).The Westerlies originate during the Monsoon times in India during June, and their presence are felt in Mauritius, during that period that corresponds to winter season (Padya, 1989). Mostly year round, the island is influenced by the South East Trade Winds with higher speeds because the land mass in the south occupies less area compared with the North. The trade winds blow mostly from the southeast in the southern hemisphere, strengthening during the winter and when the Arctic oscillation is in its warm phase. At 1000 m, the trade winds attain their highest average value during the months of August and September, while their strength in the whole of winter is high as compared to summer. The presence of some Easterlies during the months of June to October could also be experienced. The prevailing trade winds over the island blow predominantly from the east with an average speed of 5 m/s at 10 m above ground level. Occasionally, during the peak winter months of July and August, with the passage of strong anticyclones, wind gusts are likely to reach more than 25 m/s in some exposed areas (Padya, 1989).
Figure 1 also shows the locations of the proposed smart cities. The Mon Tresor Airport Smart City (proposed schema shown in Figure 2), is be located in the south-eastern part of the island in the region of Plaisance that comprises the SSR International Airport and mainly sugarcane plantations and some settlement areas.

This study utilises hourly wind data measured at Plaisance at 10 m above ground level. Data obtained were from January 2005 to December 2014. The AWS (1997) wind resource assessment handbook was used as a guide for data filtering. The data, at 10 m hub height were checked thoroughly for homogeneity, outliers and missing records before being processed for the study. Errors and missing data as well as wind gusts and cyclonic winds (wind exceeding 20 m/s) were eliminated.
Hence this study was restricted to flow of wind for normal days. The monthly averages of the filtered data, computed for height of 60 m above ground level (60 m.a.g.l) using Equation (5), are displayed in Figure 3. It can be observed that the average wind speeds vary between 4.9 m/s and 6.2 m/s with the maximum wind speed in August and September (Winter season) while the minimum wind speed occurred in December, February and May, which correspond to the summer season. The maximum turbulence intensity is 1.8 for 60 m and the average is 0.12 (turbulence intensity is a dimen-sionless quantity).
3.1 Wind Farming near an airport
The Mon Tresor Airport smart city is planned to be built in the vicinity of the SSR international Airport. As shown in Figure 4, a relatively flat location is proposed for the setting up of a wind farm to furbish the smart city, which is a region with an area of 10 km2. A recent study by Dhunny et al. (2015), based on CFD analysis of wind flow patterns showed that this region has a great potential for wind farming. The airport is approximately 3.6 km away from the proposed wind farm location. Consequently, it is important to consider the effect of the wind farm on radar as well as safety risks caused by the wind turbines acting as large physical obstructions to aeroplanes.
According to the Civil Department of Aviation of Mauritius (Airspace & Group, 2013),in the southeast region the lower flight altitude limit of planes and helicopters is 1100 m. The Federal Aviation Administration (FAA) in the United States and its European equivalent suggest that near an airport, hub heights of wind turbines should not exceed 60 m above ground level. Figure 4 also shows the different surfaces measured from the runway, in which there are restrictions on heights of buildings according to the FAA. It is evident that the proposed wind farm is partially located within the boundaries of the Outer Horizontal Surface in which the buildings heights should not be more than 100 m.a.g.l. Therefore, as per the existing regulations, if the wind farm consisted of turbines with hub height up to 60 m and rotor radius not exceeding 30 m, it should have no effect on the airspace reserved for aircraft operations.
To avert interference with the airport radar, the FAA proposes that a safety distance of 10 km should be retained. Since the current location of the radar is about 3 km from the boundary of the wind farm, it can be re-located at the outer extreme edge of the airport area, which will satisfy the FAA regulations for radar placement from a wind farm.
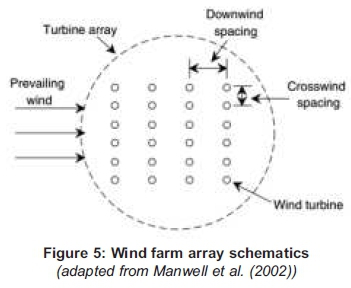
3.2 Wind turbine arrays
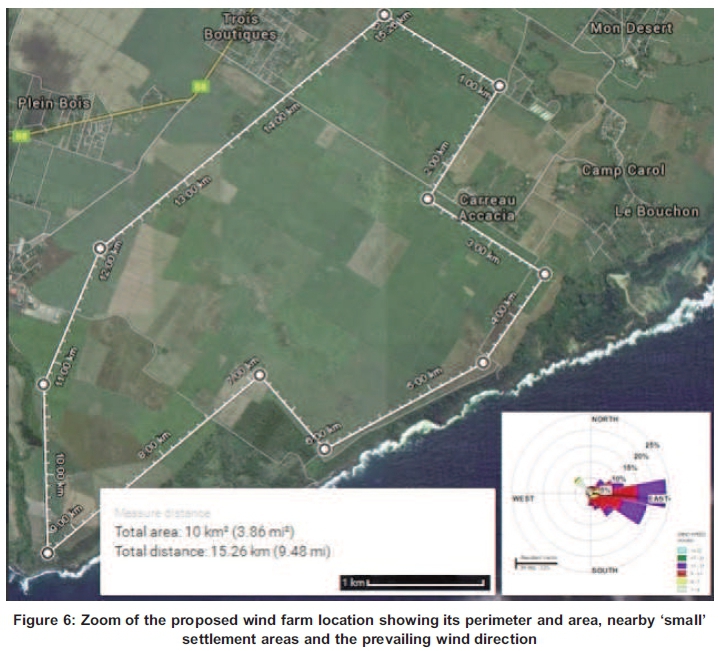
The design of wind farms as well as the exact locations of the wind turbines have to be meticulously planned to prevent power losses due to wake effects (Park & Law, 2015). Numerous technical issues arise with the close spacing of multiple wind turbines (Lissaman et al., 1982). The most important ones are related to the question of the optimum location of the wind turbines and the spcaings. The installation needs to be done in such a way as to maximize the energy obtained from the wind equipments and to cram as much wind turbines as possible. According to Manwell et al. (2002), the closer the wind turbines are towards each other, the more the energy captured will be reduced. This is due to the fact that the extraction of energy by those wind turbines that are upwind of other turbines results in a decrease in wind speeds at the downwind turbines and increased turbulence. Consequently, these wake effects decrease the energy production. Figure 5 illustrates the ideal placement of wind turbine arrays with respect to the prevailing wind direction according to Manwell et al. (2002). Lissaman et al. (1982) have shown that for turbines spaced 8 to 10D apart in the downwind direction and 5 apart in the cross wind direction (where is the turbine diameter), the array losses are less than 10%. Therefore, in the proposed wind farm area (zoomed in Figure 6), on respecting the above mentioned constraints, a total of forty wind turbines can be easily accommodated.
3.3 Choice of the wind turbine
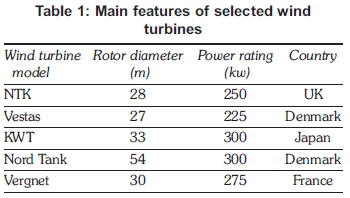
Wind turbines of hub height 60 m and rotor radius of up to 30 m has capacity in the range of 225 to 300 kW(IRNA, 2012).The most popular turbines falling in this category are: NTK 250 kW, Vestas 225 kW, KWT 300 kW, NordTank 300 kW and the Vergnet GEV MP 275 kW. Their main characteristics are given in Table 1.
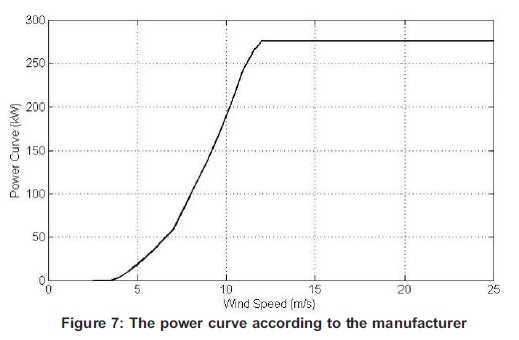
The Vergnet GEV MP 275 kW wind turbine was selected as it is specially designed for operation in tropical countries. This particular wind turbine has already been utilised for wind farming in the tropical islands of Rodrigues and Reunion. In Rodrigues, a wind farm consisting of four such turbines was set up at Trefles and two turbines at another location, Grenade. For Reunion, fifteen such turbines were erected for wind farming in 2004 and another eight were added in 2006. Detailed characteristics of the Vergnet GEV MP 275 kW wind turbine and the power curve as given by the manufacturer in the turbine's manual, are given in Table 2 and Figure 7.

4. Analysis and discussion
The methodology discussed in Section 3 was applied to the wind data. Results obtained are analysed and discussed in the following sections.
4.1 Annual and seasonal probability density of wind speeds
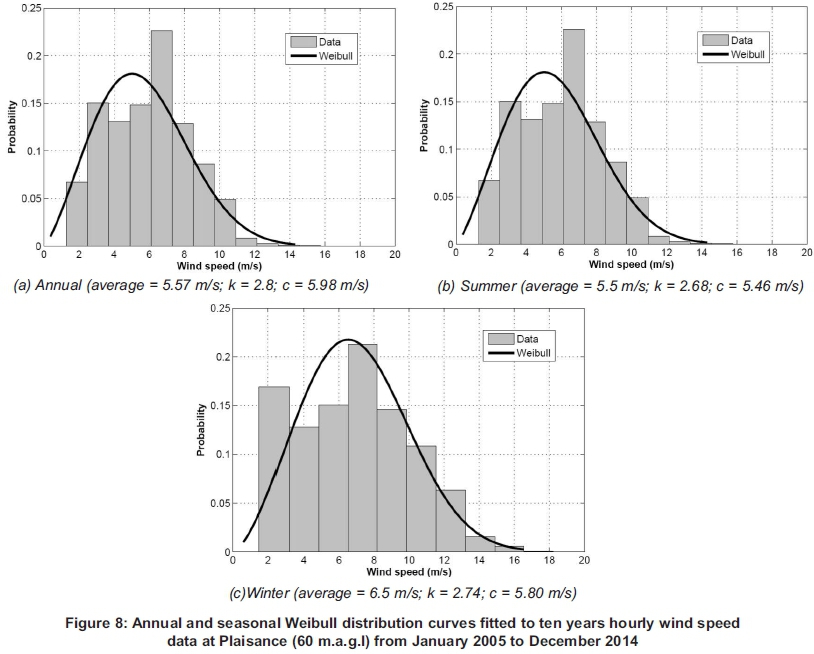
The probability distribution of wind speed is needed in evaluating the potential of wind power at the wind farm location. Figure 7 shows the 10-year annual and seasonal (summer and winter) mean histograms of recorded wind speeds along with fitted Weibull wind speed distributions at 60 m.a.g.l. The corresponding average value of the data and the Weibull c and k values are also displayed. The observed frequency for the annual curve rises steadily reaching a maximum value for wind speed of 5 m/s, and then drops gradually. For the summer season, the observed frequency reaches a maximum at 5.5 m/s and for the winter case peaks at 6.5 m/s. In all cases, the Weibull curves peak near the average values of the wind speeds. The similarity of the trends shows a good representation given by the Weibull model when compared to the actual data.
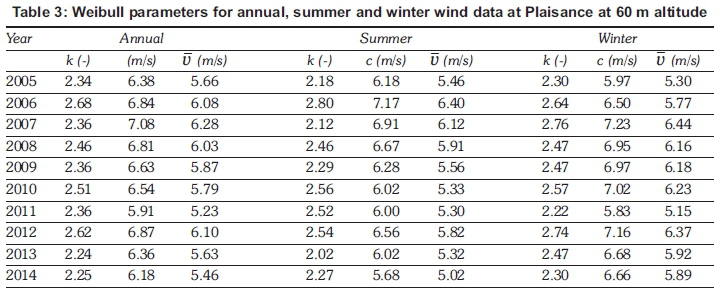
Table 3 shows the Weibull scale c and shape parameters k of the data as well as the mean values - as calculated from Equation (3) for different years during the period January 2005 to December 2014 at 60 m.a.g.l. For the annual data, the k parameter varies from 2.24 to 2.68 and the scale parameter varies between 5.91 m/s to 7.08 m/s. For summer k varies between 2.02 and 2.80 and c varies between 5.68 m/s and 7.17 m/s while for winter the shape parameter ranges in the vicinity of 2.22 to 2.76 and the scale parameter from 5.83 m/s to 7.23 m/s. In general, the mean wind speed oscillates between 5 m/s to 6.5 m/s.
4.2 Wind farm
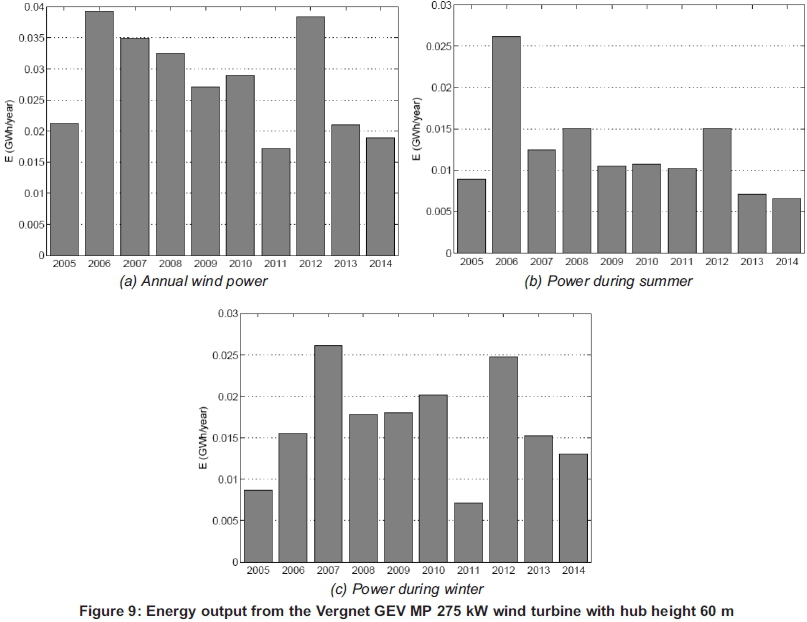
As stated previously, Plaisance benefits from a wind speed in the range of 5-7 m/s during winter season and 5-6 m/s during summer. According to 'The European Wind Energy Union' wind energy harvesting is classified as nearly good for v =6.5 m/s, good for ū = 7.5 m/s and very good for ū > 8.5 m/s (Garrad, 1991). Therefore, according to Table 2, the Mon Tresor Airport smart city at Plaisance is a suitable location for the installation of a wind farm since the mean wind speeds fall within category 1. The energy output during winter, as a function of mean wind speed for one wind turbine at hub height of 60 m at Plaisance, was estimated using Equation 6. The average annual energy output with one such turbine was observed to be around 280 MWh per annum at 60 m height. During summer for the same height (mean wind speed of 5.5 m/s), the total energy is expected to be around 150 MWh while for winter it is estimated to be 200 MWh (Figure 9).
5. Project cost
In this section, the economic viability of the proposed wind farm was analysed. The wind farm has a proposed capacity of 11 MW (40 turbines of capacity of 275 kW each). The cost of a wind turbine is mostly set by the manufacturer, and it is dependent on the rated power, e.g., a turbine rated more than 200 kW has an average cost of 1300 $/kW (Gokcek & Genc, 2009; Gokcek et al., 2007b; Matthew, 2006). In this case the cost of the Vergnet 275 kW was estimated to be around $358 000. The proposed 11 MW wind farm has an initial installation cost of $17.2 million, which includes the price of turbines and 20% for labour and other connections cost of the turbine, foundation, erection and so on (Ucar & Balo, 2009a).The operation, maintenance and repair costs were considered to be 25% of the annual cost of the turbine (Palanichamy et al., 2004). The economic optimization was performed by the Maximize Net Present Value (NPV) over n=1 to N and the Present Value Cost (PVC) as given by Equations 11 and 12.
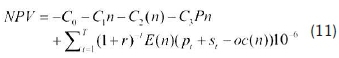
where C0 is the fixed cost of site, C1 is the cost of site infrastructure roads/internal cables etc, C2is the investment transformer connection, C3is the investment cost of turbines, the st is the subsidy level, the oc(n) is the operational cost, the Pnis the installed capacity, the r is the interest rate and E(n) is the energy yield.
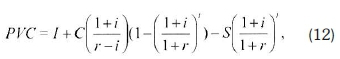
where PVC is the present value costs, the I is the initial total capital, the Comris the operation, maintenance and repair cost estimated at 25% of the annuual cost of the turbines, the t is the 20 year lifetime, the i and r are the interest and inflation rate of Mauritius, which are 5% and 3.5% respectively and S is the scrap value which is taken to be 10% of the turbine price and civil work. These values are similar to those used by Ucar and Balo (2009b) and Bataineh and Dalalah (2013). In this case the PVC is approximately $20 million and the NPV is $32 million.
The energy obtained from a single Vergnet wind turbine is around 280 MWh per annum, which makes it around 11.2 GWh electricity produced by the wind farm per year. Therefore the unit cost of electricity is about 0.089 $/kWh per year.
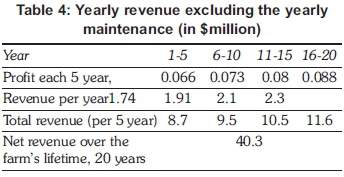
Assuming that the CEB is buying the energy produced at the current rate of 0.15 $/kWh, then the profit per kWh is 0.061 $/kWh. The yearly revenue generated by the wind farm is therefore estimated to be $1.74 million. During its 20 years life-time the revenue prediction is expected to have a 10% increase (CEB, 2014) in electricity purchase cost as given in Table 4. It is apparent that within eleven years, the initial investment would be recov-ered,emphasising that it is a profitable investment to have a wind farm at the proposed location.
The internal rate of return (IRR) for this project, which is calculated from Equation 13 is 4.4% which makes this investment attractive (Deloitte 2014).
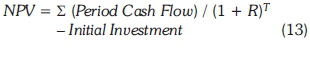
where the R is the interest rate and the T is the number of time periods which in this case is 20 years.
6. Conclusions
The main conclusions drawn from this investigation are as follows:
• The south-east coastal region of the island of Mauritius shows good wind energy potential.
• Part of the energy requirements for the Mon Tresor Airport Smart City can potentially be obtained from the wind throughout the year.
• The setting up of a wind farm in the south-east region of Mauritius is profitable with an estimated return on investment of around 11 years.
Acknowledgements
The authors thank the University of Mauritius and the Mauritius Research Council for supporting this research.
References
Abbas K., Alamgir, Khan S.A., Ali A., Khan D.M. and Khalil U. (2012), Statistical analysis of wind speed data in Pakistan". World Applied Sciences Journal 18 (11): 1533-1539. [ Links ]
Abed, K. A., & El-Mallah, A. A. (1997). Capacity factor of wind turbines. Energy, 22: 487-491. [ Links ]
Adelaja A, McKeown C, Calnin B, Hailu Y (2012), Assessing offshore wind potential. Energy Policy, 42: 191-200. [ Links ]
Ackerman, T., & Soder, L. (2002). An overview of wind energy status. Renewable and Sustainable Energy Review, 6 . [ Links ]
Airspace, & Group, S. I. W. W. (2013). Managing the impact of wind turbines on aviation. Air space and safety initiatives, [ Links ] .
Al-Nassar, W., Alhajraf, S., Al-Enizi, A., & Al-Awadhi, L. (2007). Potential wind power generation in the state of kuwait. Renewable Energy, 30: 2149-2161. [ Links ]
Altunkaynak, A., Erdik, T., Dabanli, I., & Sen, Z. (2012). Theoretical derivation of wind power probability distribution function and applications. Applied Energy, 92: 809-814. [ Links ]
AWS (1997). Wind resource assessment handbook fun damentals for conducting a successful monitoring program. [ Links ]
Azad A.K., Rasul M.G. and Yusaf T. (2014), Statistical diagnosis of the Best Weibull methods for wind power assessment for agricultural applications. Energies 2014, 7, 3056-3085. [ Links ]
Bataineh, K. M., & Dalalah, D. (2013). Assessment of wind energy potential for selected areas in Jordan. Journal of Renewable Energy, 59, 75-81. [ Links ]
Carta, J. A., PRamrez, & Velzquez, S. (2009). A review of wind speed probability distributions used in wind energy analysis: Case studies in the Canary Islands. Journal of Renewable and Sustainable Energy Reviews, 3: 933-955. [ Links ]
CEB, (2014). Central Electricity Board Integrated Electricity Plan 2013-2022. URL accessed in March 2015: http://ceb.intnet.mu/CorporateInfo/IEP2013/Executive%20Summary.pdf [ Links ]
Coskun A. A, Türker Y. Ö. (2012), Wind energy and Turkey. Environ Monit Assess, 184: 1265-73. [ Links ]
Deloitte (2014). Establishing the investment case of wind power. [ Links ]
Dhunny, A., Lollchund, M., Boojhawon, R., & Rughooputh, S. (2014). Statistical modelling of wind speed data for Mauritius. International Journal Of Renewable Energy Research, 4 (4): 564-576. [ Links ]
Dhunny, A., Lollchund, M., & Rughooputh, S. (2015). A High resolution mapping of wind energy potentials for Mauritus using Computational Fluid Dynamics (CFD). Wind and Structures, 20: 565-578. [ Links ]
Ettoumi, F. Y., Adane, A. E. H., Benzaoui, M. L., & Bouzergui, N. (2008). Comparative simulation of wind park design and siting in Algeria. Renewable Energy, 33, 2333-2338. [ Links ]
Frost W, Long BH and Turner RE. (1978). Engineering handbook on the atmospheric environmental guidelines for use in wind turbine generator development. NASA Technical Paper 1359; 1978. [ Links ]
Garrad, A. (1991). Wind energy in Europe: a plan of action. Summary report of wind energy in Europe time for action. Technical Report The European Wind Energy Association Press, Germany. [ Links ]
Gokcek, M., Bayulken, A., & Bekdemir, S. (2007a). Investigation of wind characteristics and wind energy potential in Kirklareli, Turkey. Renew Energy, 32: 1739-1752. [ Links ]
Gokcek, M., Erdem, H., & Bayulken, A. (2007b). A techno-economical evaluation for installation of suitable wind energy plants in Western Marmara Turkey. Energ. Explor. Exploit., 25: 407-428. [ Links ]
Gokcek, M., & Genc, M. (2009). Evaluation of electricity generation and energy cost of wind energy conversion systems (WECS) in central Turkey. Appl Energ, 86: 2731-2739. [ Links ]
Harris, J., & Stocker, H. (1998). Maximum likelihood method. Springer-Verlag, Handbook of Mathematics and Computational Science, 92, 824. [ Links ]
IEC 61400 wind turbines e part 1: design requirements. IEC; 2005. [ Links ]
IEC 61400 wind turbines e part 3: design requirements for offshore wind turbines. IEC; 2008. [ Links ]
IRNA (2012). Renewable energy technologies: Cost analysis series. Power Sector, Wind Power. [ Links ]
Jimenez, A., Diazgranados, J., & Morantes, M. (2011). Electricity generation and wind potential assessment in regions of Colombia. Dyna, 79: 116-122. [ Links ]
Kaldellis, J. K. (2002). Optimum autonomous windpower system sizing for remote consumers, using long-term wind speed data. Applied Energy, 71: 215-233. [ Links ]
Keyhani, A., Ghasemi-Varnamkhasti, M., Khanali, M., & Abbaszadeh, R. (2010). An assessment of wind energy potential as a power generation source in the capital of Iran, Tehran. Energy, 35: 188-201. [ Links ]
Kollu, R., Rayapudi, S.R., Narasimham, S.V.L. and Pakkurthi, K.M. (2012), Mixture probability distribution functions to model wind speed distributions. International Journal of Energy and Environmental Engineering, 3(27). [ Links ]
Ki-Yong Oh, Ji-Young Kim, Jae-Kyung Lee, Moo-Sung Ryu and Jun-Shin Lee (2012). An assessment of wind energy potential at the demonstration offshore wind farm in Korea. Energy 46: 555-563. [ Links ]
Lehri, L. A., Shah, S. M. A., Ahmed, B., Leghari, & Tareen, M. I. (2013). Wind potential assessment and optimization of wind turbine blade for coastal area of Jiwani Balochistan Pakistan. International Journal of Materials, Mechanics and Manufacturing, 1 . [ Links ]
Lissaman, P, Zaday, A., & Gyatt, G. (1982). Critical issues in the design and assessment of wind turbine. arrays. Proc. 4th International Symposium on Wind Energy Systems, Stockholm. [ Links ]
Mann, N. R., Schafer, R. E., & Singpurwalla, N. D. (1974). Methods for statistical analysis of reliability and life data. John Wiley and Sons, New York. [ Links ]
Manwell, J. FF, McGowan, J., & Rogers, A. (2002). Wind power explained: Theory, design and application. West Sussex, UK: Wiley. [ Links ]
Masseran N., Razali A.M., Ibrahim K., Zaharim A. and Sopian K. (2013), The probability distribution model of wind speed over East Malaysia. Research Journal of Applied Science, Engineering and Technology 6(10): 1774-1779. [ Links ]
Marciukaitis, M., Katinas, V., & Kavaliauskas, A. (2008). Wind power usage and prediction prospects in lithuania. Renew Sustain Energy Rev, 12: 265-277. [ Links ]
Matthew, S. (2006). Wind energy: Fundamentals. Resource Analysis And Economics. Springer, Heidelberg. [ Links ]
Morgan E.C., Lackner M., Vogel R.M. and Baise L.G. (2010), "Probability distributions for offshore wind speeds". Journal of Energy Conversion and Management. 52 (2011) 15-26 [ Links ]
Mirghaed, M. R., & Roshandel, R. (2013). Site specific optimization of wind turbines energy cost: iterative approach. Energy Conversion and Management, 73 , 167-175. [ Links ]
Mirhosseini M, Sharifi F. and Sedaghat A (2011). Assessing the wind energy potential locations in province of Semnan in Iran. Renewable and Sustainable Energy Reviews 15: 449-459 [ Links ]
Ngala, G., Alkali, B., & Aji, M. (2006). Viability of wind energy as a power generation source in 305 Maiduguri Borno state, Nigeria. Renewable Energy, 32 : 2242-2246. [ Links ]
Oyedepo, S. O., Adaramola, M. S., & Paul, A. S. (2012). Analysis of wind speed data and wind energy potential in three selected locations in south-east Nigeria. International Journal of Energy and Environmental Engineering, 3: 1-11. [ Links ]
Padya, B. M. (1989). Weather and Climate of Mauritius. Geography of Mauritius Series. Mahatma Gandhi Institute. [ Links ]
Palanichamy, C., Babu, N., & Nadarajan, C. (2004). Renewable energy investment opportunities in Mauritius- an investor's perspective. Renewable Energy, 29: 703-706. [ Links ]
Park J. and Law H. (2015).Layout optimization for maximizing wind farm power production using sequential convex programming. Applied Energy 151 (2015): 320-334 [ Links ]
Radics, K., & Bartholy, J. (2008). Estimating and modelling the wind resource of Hungary. Renew Sustain Energy Rev, 12 , 874-882. [ Links ]
Sahin, B., Bilgili, M., & Akilli, H. (2005). The wind power potential of the eastern Mediterranean region of Turkey. Journal of Wind Engineering and Industrial Aerodynamics, 93: 171-183. [ Links ]
Shata, A. S. A., & Hanitsch, R. (2006). The potential of electricity generation on the east coast of Red sea in Egypt. Renew energy, 31: 1597-1625. [ Links ]
Smart City (2015). Available at http://news.islandcrisis.net/2014/06/mon-tresor-air-port-city/. [ Links ]
Tarkowski, R., & Uliasz-Misiak, B. (2003). Renewable energy sources in guadeloup. Applied Energy, 74 , 221-228. [ Links ]
Ucar, A., & Balo, F (2009a). Evaluation of wind energy potential and electricity generation at six locations in Turkey. Applied Energy, 86 , 1864-1872. [ Links ]
Ucar, A., & Balo, F (2009b). Investigation of wind characteristic and assessment of wind-generation potentiality in Uludag-Bursa Turkey. Applied energy, 86: 333-339. [ Links ]
WEC (2014). The World Energy Council, . Available at http://www.worldenergy.org. [ Links ]
Youm, I., Sarr, J., Sall, M., Ndiaye, A., & Nane, M. M. (2005). Analysis of wind data and wind energy potential along the northern coast of Senegal. Renewable and Sustainable Energy Reviews, 8: 95-108. [ Links ]
Zekai Sen, A. A., & Erdik, T. (2012). Wind velocity vertical extrapolation by extended power law. Advances in Meteorology. [ Links ]
Zghal, W., Kchaw, G., & Kantchev, H. (2011). Determination of recoverable wind energy for electricity generation using wind energy conversion system in Tunisia. International Journal of Engineering Science and Technology, 3(5), 83-92. [ Links ]
* Corresponding author Email: r.lollchund@uom.ac.mu
Tel: + 230 4037669

