


Servicios Personalizados
Articulo
 Inglés (pdf)
 Articulo en XML
 Referencias del artículo
Indicadores

Links relacionados
-
 Citado por Google
 -
 Similares en Google
Compartir

 Permalink
Journal of Energy in Southern Africa
versión On-line ISSN 2413-3051
versión impresa ISSN 1021-447X
J. energy South. Afr. vol.26 no.4 Cape Town nov. 2015
Selection of the best location for solar plants in Turkey
Adnan Sozen*; Amin Mirzapour; M Tarik Çakir
Gazi University, Technology Faculty, Energy Systems Engineering, Teknikokullar, Ankara, Turkey
ABSTRACT
The unique properties of solar energy have led to increasing demands in various countries. In order to use solar energy effectively, environmental and geographical circumstances related to solar intensity must be considered. Different factors may affect the selection of suitable locations for solar plants. These factors must be considered concurrently for optimum location identification. This article presents an approach for the location of solar plants by data envelopment analysis (DEA). Efficiency scores over a twelve month period were evaluated by using a modified similarity to ideal solution (TOPSIS) method. This approach was applied to 30 different cities in different regions of Turkey.
Keywords: solar energy, Data Envelopment Analysis,, super efficiency, TOPSIS
1. Introduction
Renewable alternative energy resources are expected to play an increasing role in future scenarios for energy production. The environmental and technical benefits of solar energy have made it a promising alternative to conventional energy resources. Solar energy is freely available and is easily harnessed using both passive and active designs, reducing our reliance on hydrocarbon-based energy. The Sun is an ancient energy source and is the root cause of almost all fossil and renewable energy types. Sunlight has influenced building design since the beginning of architectural history. Solar architecture and urban planning methods were first employed by the Greeks and Chinese, who oriented their buildings toward the south to provide light and warmth.
Solar energy is set to develop robustly all over the world. One of the most useful applications of solar power is the energy generation of solar plants. These facilities have huge potential for harnessing energy in remote sunny regions.
Location decisions are used in all fields of facility establishment. Determining the relative suitability of different locations has special importance in the case of solar systems. The term "location" in this case refers to the modelling, formulation, and solution of a class of problems that can best be described as siting facilities at a particular spot within a given region.
The International Energy Agency said that the development of affordable, inexhaustible and clean solar energy technologies will have huge long-term benefits. It will increase a country's energy security through reliance on an indigenous, inexhaustible and mostly import-independent resource, enhance sustainability, reduce pollution, lower the costs of mitigating climate change, and keep fossil fuel prices low. The early development of solar technologies, starting in the 1860s, was driven by an expectation that coal would soon become scarce. However, development of solar technologies stagnated in the early 20th century in the face of the increasing availability, economy, and utility of coal and the development of the petroleum industry. The 1973 oil embargo and 1979 energy crisis caused reorganization of energy policies around the world and brought renewed attention to the development of solar technologies. Since the cost of investment in a solar plant is high, feasibility studies prior to implementation of a project are important. Several physical, economic, social, environmental and political factors must be considered in the development of solar energy resources. Scientific studies examining ideal geographical location selection in terms of maximizing efficiency and yield are essential parts of this complex decision making process. There are two important criteria in the selection of the solar plants; efficiency of the area in terms of the amount of sunlight and the minimization of energy production costs. The cost of the land at which the solar plants might be established is one of the fundamental features of the second criterion. Proximity to transformer centres, topography, land cover, slope, maintenance costs, the presence of ecological conservation areas, landslide areas and residential areas are other significant factors in the economic aspects of site selection.
Deriving a model of the relationships between these factors provides investors the opportunity to understand the feasibility of a given project. In this study, data envelopment analysis (DEA) and the TOPSIS model were applied to provide a quantitative characterization of the utilization of solar energy, cost and distance to power distribution networks. The results of this analysis will help in the determination of the most appropriate sites for solar plants in Turkey. The cost of energy, which is the basic variable of second criterion, must be considered in the assessment. There have been a number of previous studies of location problems (Domschke and Drexl, 1985; Bhatnagar and Sohal, 2005). Several surveys of the applications of location models have been performed (Eiselt, 1992; Jacobsen and Madsen, 1980; Marks and Liebman, 1971; Wirasinghe and Waters, 1983; Hopmans, 1986; Kimes and Fitzsimmons, 1990; Huxley, 1982; Tryfos, 1986; Vasko et al., 1987; Hogan, 1990; Azadeh et al., 2008). In this article, DEA was used as a multi-criteria method for location of solar plants. The DEA efficiency scores over a twelve month period were ordered by TOPSIS for selection of the best site.
2. Materials and methods
2.1 Materials (selection of parameters)
Some factors that are effective for selecting the location of solar plants were proposed. These parameters were then used for determining the priority of cities for location of a solar plant. After careful consideration of previous studies into the plant location problem, certain quantitative and qualitative factors were selected for focus. These factors were utilized by techniques aimed at prioritizing different possible locations of solar plants. In this article, a DEA approach using a number of pre-set indicators was applied. Ten different parameters were used. These parameters were primarily related to economic factors, ranging from vulnerability to natural disaster hail, etc.) to more application-based variables such as convection, transformers, and the price of the land. These parameters were as follows:
Inputs
Distance to power distribution networks (km): Low distance to power distribution networks is a benefit in location selection. Because the cost of electrification from the central power network is very high, supplying energy from local power generators with low maintenance and operational costs is preferred. Thus, placing solar plants in sunny locations is an excellent solution. With this assumption, this parameter has an input structure.
Land cost: Land is the base infrastructure for construction of any plant. This is more important for solar than other plants because they need considerably more land than other methods of energy generation (Ramanathan, 1999).
The number of earthquakes: The number of earthquakes that occurred within in 100 km of cities from 1990 to 2008, under the assumption that number of past earthquakes is an indicator of future earthquakes. The number of earthquakes was considered as an uncontrollable input.
The number of flooding rains: The number of torrential rains which caused flooding between 1960 and 2000. The number of flooding rains was also considered as an uncontrollable input.
The number of severe hailstorms: The number of damaging hailstorms between 1960 and 2000 was considered as an uncontrollable input.
Snow and blizzard: The number of days with snow and blizzard between 1960 and 2000 was also considered as an uncontrollable input.
The number storms and severe hurricanes: The number of storms and severe hurricanes which resulted in damage and economic loss between 1960 and 2000 was considered as an uncontrollable input.
Other adverse natural events: The number of wild fires, drought and freezing, severe fogs, etc. that occurred between 1960 and 2000 were considered as an uncontrollable input.
Human and financial losses: This input represents human and financial losses from 1960 until 2000 and was considered as an uncontrollable input.
The single output (Solar monthly average): The primary index for locating solar plants is solar monthly average, which is equal to solar global radiation multiplied by solar duration and divided by month days.
2.2 Methodology (data envelopment analysis)
Technical, geographical, and social factors for location optimization detailed in the literature were considered. This study utilized DEA for assessment of solar plant locations in the selected cities according to each city's unique characteristics. DEA has been previously used in such applications (Cook et al., 1998). For this purpose, a number of parameters were defined and considered as inputs and outputs of the DEA model.
Data envelopment analysis is a linear programming based technique which aims to measure the relative performance of decision units in times when it is hard to make a comparison between inputs and outputs which have been measured by a number of different measures or which have different measurement units. "Decision Units" are management or economic organizations whose performances will be compared (Zhou et al., 2008; Sozen and Alp, 2013). The method was developed firstly by Charnes Cooper and Rhodes. in order to measure and compare technical efficiencies (Charnes et al., 1998). While an ordinary statistical method evaluates the producers according to an average producer with the measures of central tendency approach, the DEA technique compares each producer only with the "best" producers. The most important specification of this method is the identification of the inactivity rate and the sources in each decision making unit. By means of this characteristic, the method may provide direction to managers in regards to decreasing the input and/or increasing the output. The most important innovation that the method brings is measurement without predicting any predetermined analytical production function in environments where a high output is obtained by using high input. Additionally, the inputs and outputs are free from the measurement unit, which is why it is possible to measure different dimensions simultaneously. There are three basic methods used in data envelopment analysis; CCR (Charnes-Cooper-Rhodes) Method, BBC (Banker-Charnes-Cooper) Method and Additive Method.
In this study, CCR and input-oriented models were used. Using an input-oriented CCR DEA model, by minimizing inputs, the cities which can have maximum output are indicated as efficient. The CCR method is based on the assumption that "constant returns to scale". If the activity of the jth. decision making unit is hj, the goal should be the maximization of this value. Thus, the goal function can be stated as in the formulation (Eq.1) under the input-oriented assumption (Tarim, 2001):
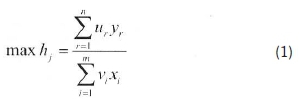
With constraints:
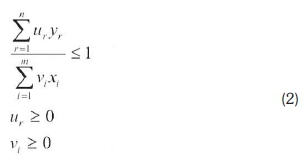
The solution of the fractional programming set is more difficult compared to the linear programming set. When the model is stated with linear programming logic, (Eq.3) and (Eq.4) formulations can be achieved:
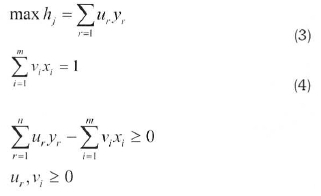
Considering whether the model is input-oriented or output-oriented, if a decision maker wants to make a decision for the activities of the decision points using the CCR method, application of the above model for all decision points is required. When the model is solved for each decision point, total activity standards will be obtained for each decision point. The standards being equal to 1' indicates activity for decision points, whereas those being smaller than 1' indicates inactivity for decision points.
2.2.1 Super efficiency
If most of the DMUs are efficient, then ranking of efficient DMUs with respect to each other with the concept of super efficiency is important. The idea of super efficiency was first presented by Andersen and Petersen (1993). They offered a model for assessing efficiency that incorporates basic DEA principles while relaxing the upper bound of 1 for efficient units, thereby restoring full information for such units. This method has been denoted ''Super-efficiency Analysis". Various discussions and applications of the method have appeared in the literature.
Suppose, we have n DMUs where each DMUj, j = 1,2,...,n. Produces s output. Yrj (r=1,2,...,s) using m input, xlj (i=1,2,...,m). The efficiency of a specific DMUo, os{1,2,..,n} can be evaluated by the BCC model. This model is as follows:
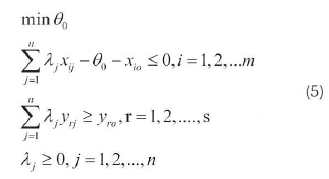
Where xio and yro are respectively the ith input anc rth output for a DMUo under evaluation. We suppose that Θ*oshows optimal amounts. G*orepresents efficiency score and all the frontier DMUs have Θ*0=1. In order to determining the performance of frontier DMUs, we use the super efficiency DEA model. Let DMUs (DMUi, i = 1. 2..... n) consist of m non-negative inputs (xij j = 1. 2.....m) and p non-negative outputs (yrk. k = 1. 2..... p) such that, at least one of the inputs and ane of the outputs of each DMUs are not zero.
The only difference between the Andersen and Petersen (1993) super efficiency model and CCR/BCC model is the disregard of the DMU that is being evaluated in the constraints. All of the CCR/BCC inefficient DMUs have the same weights and efficiency score results as the Andersen and Petersen super efficiency model. An input-oriented super-efficiency DEA model evaluates the input super-efficiency when outputs are constant at their current levels. An output-oriented super-efficiency DEA model evaluates the output super-efficiency when inputs are constant at their current levels (Chen, 2005). For a more complete explanation of super efficiency DEA models, please refer to Seiford and Zhu (1999), which provides a complete list of super efficiency DEA models (Zhu, 2001). In this article, we compared twelve efficient cities which had efficiency scores equal to one by using the scale efficiency.
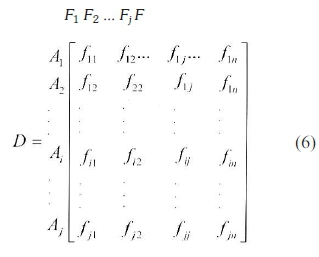
2.2.2. Modified TOPSIS Method
The TOPSIS method was proposed by Hwang and Yoon in 1981 and is applied to many decision-making problems (Boran and Boran, 2013). A modified TOPSIS method proposed by Deng and Willis in 2000 was used in this paper. The reasons for using TOPSIS are its rational and comprehensible design and the simplicity of its computations (Deng and Willis, 2000). TOPSIS allows for comparison of objective weights. The concept of TOPSIS is that the most preferred alternative should not only have the shortest distance from the positive ideal solution, but also have the longest distance from the negative ideal solution. The TOPSIS method consists of the following steps (Shyur & Shih, 2006):
Step 2: Normalize the decision matrix. The normalized value {rij} can be computed by:
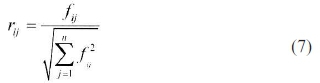
Where j = 1, 2 ... ,n; i = 1, 2 m
The above step is not necessary if DEA efficiency scores are between 0 and 1.
Step 3: Calculate the weighted normalized decision matrix by multiplying the normalized decision matrix by its associated weights. The weighted normalized value vij is calculated as:
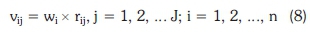
where wi represents the weight of the ith attribute or criterion.
Step 4: Determine positive and negative ideal solutions. The positive ideal solution and negative ideal solution are determined, respectively, as follows:
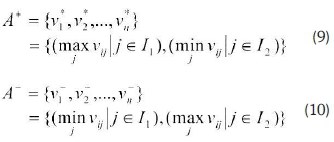
Where I1 represents benefit criteria, and I2 represents cost criteria.
Step 5: Obtain the weighted separation measures for positive and negative ideal solutions. Separation measures based on weighted Euclidean distance are calculated for positive and negative solutions, respectively:
Step 6: Calculate the relative closeness to the ideal solution and rank the alternatives. The relative closeness for alternative Ai according to A+ is defined as follows:
where the index value lies between 0 and 1. The larger the index value means the better the performance of the alternatives.
3. Results and discussions
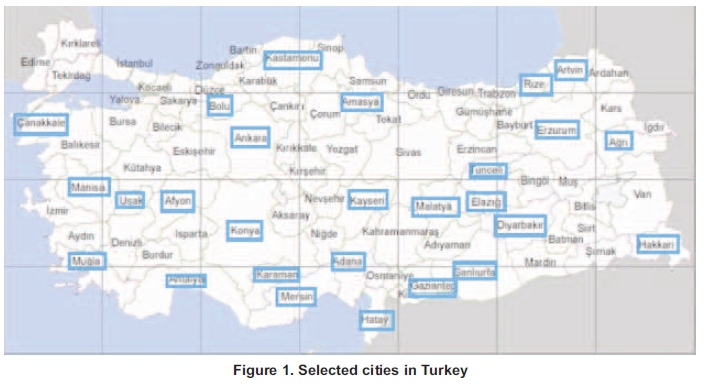
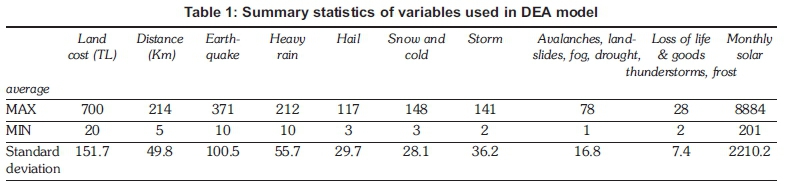
Cities used in the proposed model are presented in Figure 1. Selected cities were those that have warm weather in Turkey, which led to wide coverage of the model. Land cost, distance to power distribution networks and numbers of earthquakes, heavy rains, hailstorms, storms, avalanches, landslides, fog, drought, thunderstorms, frost and lost life and financial losses are presented in Table 1. The values of distance to power distribution networks were based on the scores determined by the experts for each city.
The maximum and minimum values along with the standard deviations of the fundamental indicators for the selected cities are given in Table 1. With this table, the study population for the analysis is defined.
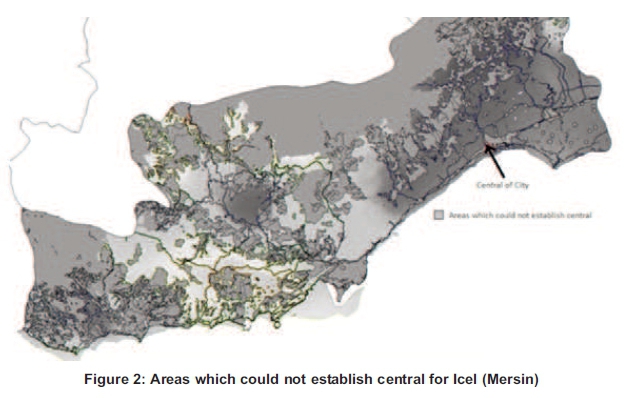
Selected indicators for cities given in Table 1 were determined by considering the allowing of central establishment areas. In Figure 2, which displays the Içel region, areas in which centrals could not be made are shaded grey.
The required data indicators used in the proposed model were gathered from the Turkish State Meteorological Service. For the values of indicators such as land cost, there was no exact data available. The combination of the measured indicators ensures adherence to the DEA convention that the minimum number of DMU observations should be greater or equal to three times the number of inputs plus outputs (Raab and Lichty, 2002). For this study, 30 observations were equal to three times the sum of the input and output variables (30>3(9+1)).
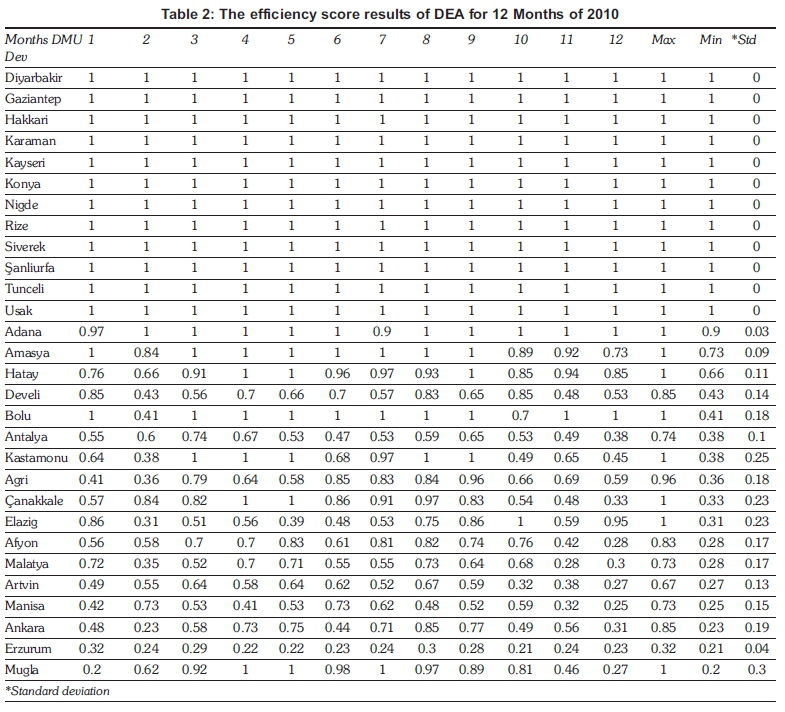
By analysing the results, critical indicators for each DMU were identified. Land cost and distance to power distribution networks were the most critical indicators for about 60% of the cases and the other indicators were most important in the remaining 40% of cases. The efficiency score results are presented in Table 2. As seen from Table 2, the cities with efficiency scores of 1 were those that attained the maximum efficiency for solar plant construction according to the determined variables. In other cities, an efficiency score below 1 revealed that one of the indicators would be able to attain an efficient value if, for a given output level, no equi-proportionate reduction of inputs could result in the same level of output. For example, the city of Adana failed to be efficient in January and attained an efficiency score of 0.97, which was near to the efficiency score of 1. As a city's efficiency score decreased, the attainment of efficiency became more difficult. According to results obtained for 2010, Kayseri, Diyarbakir, Rize, Hakkari, Sanliurfa, Usak, Gaziantep, Tunceli, Nigde, Konya, Karaman, Siverek are the most ideal cities in the order shown. The efficient cities were evaluated according to the results of analysisies. A reference number was assigned for each efficient city. These cities are shaded in Table 3. Table 3 also shows how non-efficient cities can be turned into efficient cities. To reach desired efficiency for non-efficient cities, the reference values of efficient cities (considered as reference for that city) are multiplied by the percentages given in parenthesis and then all the results are summed together, and the results has been shown in Table 4.
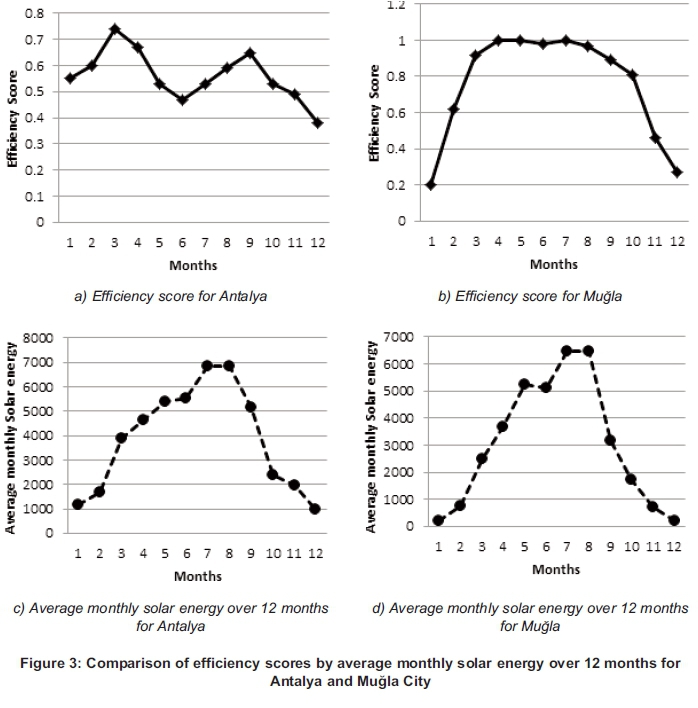
Comparing average monthly solar energy with efficiency values, it becomes clear that although Antalya, Mugla, Diyarbakir, Agri and Malatya had greater monthly solar energy values, they were not accepted as efficient cities. The land price and the distance from the nearest electricity distribution centre caused these cities to not be considered efficient. The input values which these cities must reach in order to be efficient are listed in Table 4. The target values which are obtained by multiplying and adding the percentile values given in parentheses in Table 3 required for enabling the three selected cities (Antalya, Mugla and Agri) to attain 100% efficiency are calculated and displayed in Table 4. For example, for the city of Antalya, the distance of the plant should be no more than 67.85 km from the power distribution network. The unit land price for the plant should be a maximum of 58.9 TL/m2. If these values are met, Antalya will be able to be among the cities which are efficient for solar plant construction (Table 4).
Even cities which are efficient or are nearly efficient are efficient in some months but inefficient in other months. Efficiencies which are 1 or nearly 1 have a high potential for optimal location selection. For the cities such as Antalya whose efficiencies are nearly 1 for approximately 0.5-0.6 all months, efficiency can be achieved by reduction of land cost, distance to transformers or loss of life and goods. Average monthly sunshine in southern Mediterranean cities is very high, but none of these cities are efficient. This is partly because land costs in the Mediterranean cities are very high in contrast to the efficient cities. Another reason is that they are far from the electricity transmission networks. Keeping input values constant, the efficiency value improves with increases to average monthly solar energy
For instance, the city of Agri could be efficient if it changes certain input parameters such as land prices, the distance to the electricity distribution centre and loss of life and goods. For Agri, in the first month, if the land price decreases from 100 to 40.6 Turkish Lira (1TL ≈ $2.4), the distance from the electricity distribution centre decreases from 47km to 19.68km, and loss of life and goods decreases from 8 to 2.78, this city will be efficient. As an additional example, in the first month, Mugla efficiency score is 0.20 and its benchmarks were Tunceli with 0.12 and Diyarbakir with 0.02. This means that Mugla could be efficient if inputs reached 0.12 of input for Antalya plus 0.02 of input for Diyarbakir inputs for the first month (January).
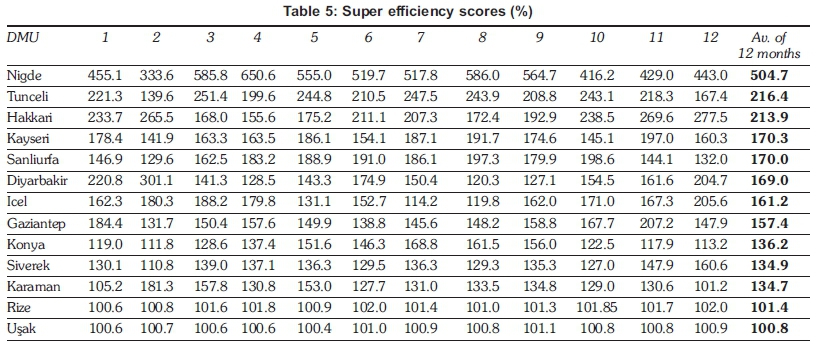
Selection of the best location to test the accuracy and efficiency in addition to the super-TOPSIS results was performed. Super efficiency scores and standings for each month according to the city which had the highest value of the smallest events lined up correctly. These results are provided in Table 5. The efficiencies of the efficient cities, although they all had a score of 1, can be sorted among themselves by employing the super-efficiency concept. The super-efficiency scores are given in Table 5. The sorted scores, which were obtained by employing the 12-month averages, revealed that the best place for solar plant construction in Turkey was Nigde. The sorting of the other efficient cities can be seen in Table 5. The priority list was validated by TOPSIS method.
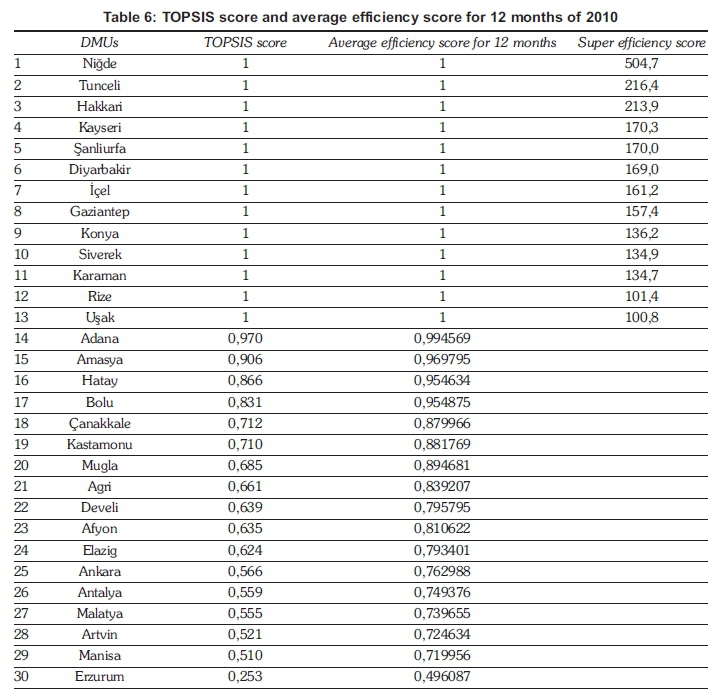
The DEA results were verified and validated by a ranking method (TOPSIS). Furthermore, the results of super efficiency for determining the priority of the cities for construction of solar plants were compared with the results of TOPSIS. For the TOP-SIS application in this analysis, the efficiency analysis was calculated separately for each month. By applying these efficiency results and using the prioritizing method, the distances from the ideal answer were specified. The TOPSIS priority was measured for twelve months and specified with location (Table 6). In terms of efficiency scores for continuous power production at solar stations, assessment for twelve months would be a correct approach. For this reason, even if the results of the TOPSIS method are the same with average values for each of the 12 months, it can render the analysis more valuable and give a new dimension to the analysis. The location designation of high priority, however, should be made according to the super-efficiency results. The TOPSIS method was used for validating the efficiency scores without deriving any gradation like super-efficiency. As seen from Table 6, the cities with a 12-month average DEA efficiency score of 1 are validated with the cities with an efficiency score of 1 according to the TOPSIS results. The priority of the effective locations, i.e. the locations which are ideal for solar plant construction, should be compliant with the super-efficiency sorting shown in Table 6.
5. Conclusions
Solar plants are very desirable as an alternative source of energy. Hence, determination of optimum locations for use of this resource is a vital issue. Generally, solar global radiation and solar duration is a primary tool used for determining the optimum locations for solar plants. However, in this approach, some local and social considerations are ignored. Additional criteria such as distance to power distribution networks, land cost, earthquakes, heavy rain, hail, storms, avalanches, landslides, fog, drought, thunderstorms, frost, loss of life and goods and monthly average sunshine duration are considered in this work. In this paper, a DEA approach using a number of predefined indicators was used to identity optimum locations of solar plants in Turkey and to rank the capabilities of various locations with respect to some output and input indicators for 30 cities in Turkey. The best location is Nigde according to the ranking of super efficiency, average efficiency over 12 months and TOPSIS.
In the results for identifying the most suitable areas for establishment of solar plant stations in Turkey, there was no conflict with variables which were not computable such as the vegetation, protected areas and residential areas. Land costs have not been used much in the consideration of selection of provinces and their capital cities although the importance of pricing of suitable land for the establishment of stations and the distance to distribution networks has been recognized. Before installation and implementation of solar power stations, both economic and environmental factors should be considered.
Nomenclature
h0 Efficiency measurement of DMUj
i Input index i = 1, 2 m
m Number of inputs
r Output index
s Number of outputs
Ur r th output weight
Vi i th input weight
Xi0 i th input for a DMU under evaluation
Xy Non-negative observed amount of input i of DMUj
Xi i th input values
Yr r th output values
Yrj Non-negative observed amount of output j of DMUr,
Yr0r th output for a DMU under evaluation
Xj Multipliers used for computing linear combinations of DMUs' inputs and outputs
60Contraction factor that determines how much a DMU's inputs can be reduced
References
Andersen, P and Petersen, N. C. (1993). A Procedure for Ranking Efficient Units in Data Envelopment Analysis. Management Science 39(10): 1261-1264. [ Links ]
Azadeh, A., Ghaderi, S. F, and Maghsoudi, A. (2008). Location optimization of solar plants by an integrated hierarchical. Energy Policy. 36, 3993-4004. [ Links ]
Boran, F E., and Boran, K. (2012). Evaluation of Natural Gas Systems: A Comparison Study for Turkey, Energy Sources, Part B: Economics, Planning, and Policy, 7:3, 222-229. [ Links ]
Bhatnagar, R., and Sohal, A.S. (2005). Supply chain competitiveness: measuring the impact of location factors, uncertainty and manufacturing practices, Technovation, 25, 443-456. [ Links ]
Charnes, A., Cooper, W. W., Lewin, A. Y, and Sieford, L.M.(1998). Data Envelopment Analysis: Methodology and Applications, Massachusetts, USA. [ Links ]
Chen, Y. (2005). Measuring super-efficiency in DEA in the presence of infeasibility, European Journal of Operational Research, 161, 545-551. [ Links ]
Cook, W. D., Chai, D., Doyle, J., Green, R. (1998). Hierarchies and groups in DEA. Journal of Productivity Analysis, 10, 177-198. [ Links ]
Domschke, W, and Drexl, A. (1985). In Location and layout planning: an international bibliography, Lecture Notes in Economics and Mathematical Systems, 238, 343-348. [ Links ]
Deng, Y., and Willis, R. J. (2000). Intercompany comparison using modified topsis with objective weights, Computes and Operations Research, 27, 963-973. [ Links ]
Eiselt, H. A. (1992). Location modelling in practice. American Journal of Mathematical and Management Sciences.12, 3-18. [ Links ]
Huxley, S. J. (1982). Finding the right spot for a church camp in Spain, Interfaces..12, 108-114. [ Links ]
Hogan, K. (1990). Reducing errors in rainfall estimates through rain gauge location, Geographical Analysis. 22, 33-49. [ Links ]
Hopmans, A.C.M. (1986). A spatial interaction model for branch bank accounts, European Journal of Operational Research. 27, 242-250. [ Links ]
Hwang, C. L. and Yoon, K. (1981). Multiple Attribute Decision Making: Methods and Applications, Springer-Verlag, New York. [ Links ]
Jacobsen, S.K., and Madsen, O.B.G. (1980). A comparative study of heuristics for a two-level routing location problem, European Journal of Operational Research. 5, 278-287. [ Links ]
Kimes, S.E., and Fitzsimmons, J.A. (1990). Selecting profitable hotel sites at La Quinta inns, Interfaces. 20, 12-20 [ Links ]
Marks, D., and Liebman, J. (1971). Location models: solid wastes collection examples, Journal of the Urban Planning and Development Division. In Proceedings of the American Society of Civil Engineers, 97:1, 15-30 [ Links ]
Raab R, and Lichty R. (2002). Identifying sub-areas that comprise a greater metropolitan area: the criterion of country relative efficiency. Journal of Regional Science, 42, 579-594. [ Links ]
Ramanathan, R. (1999). Using data envelopment analysis for assessing the productivity of the state transport undertakings, Indian Journal of Transport Management. 23(5), 301-312. [ Links ]
Seiford L. M., and Zhu, J. (1999). Profitability and Marketability of the Top 55 US Commercial Banks. Management Science 45(9): 1270-1288. [ Links ]
Shyur, H. J., & and Shih, H. S. (2006). A hybrid MCDM model for strategic vendor selection. Mathematical and Computer Modelling, 44, 749-761. [ Links ]
Sozen, A., and Alp, I. (2013). Malmquist Total Factor Productivity Index Approach to Modelling Turkey's Performance of Energy Consumption, Energy Sources, Part B: Economics, Planning and Policy, 8(4), 398-411 [ Links ]
Tarim, A. (2001). Data envelopment analysis: relative efficiency measurement approach based mathematical programming, Ankara, SayiÇtay Yayinlari, Turkey, p.222 (in Turkish) [ Links ]
Tryfos, P (1986). An integer programming approach to the apparel sizing problem, Journal of the Operational Research Society. 37, 1001-1006 [ Links ]
Vasko, F, Wolf, F, and Stott, K. (1987). Optimal selection of ingot sizes via set covering, Operations Research. 35, 346-353 [ Links ]
Wirasinghe, S.C., and Waters, N. M. (1983). An approximate procedure for determining the number, capacities, and locations of solid waste transfer stations in an urban region, European Journal of Operational Research. 12, 105-111.zh [ Links ]
Zhou, P, Ang, B. W., and Poh, K. L. (2008). A survey of data envelopment analysis in energy and environmental studies. European Journal of Operational Research189, 1-18. [ Links ]
Zhu, J. (2001). Theory and Methodology Super-efficiency and DEA sensitivity analysis, European Journal of Operational Research 129, 443-455 [ Links ]
Received 22 May 2014
Revised 13 August 2014
* Corresponding author: Tel: + (90) (312) 2028607 E-mail: asozen@gazi.edu.tr

