


Servicios Personalizados
Articulo
 Inglés (pdf)
 Articulo en XML
 Referencias del artículo
Indicadores

Links relacionados
-
 Citado por Google
 -
 Similares en Google
Compartir

 Permalink
Journal of Energy in Southern Africa
versión On-line ISSN 2413-3051
versión impresa ISSN 1021-447X
J. energy South. Afr. vol.26 no.3 Cape Town ago. 2015
Options for the supply of electricity to rural homes in South Africa
Noor Jamal
European University, Flensburg, Germany
ABSTRACT
The residential sector in South Africa is being electrified by the South African government on a priority basis. For this purpose, both grid and off-grid electrification options are being used. As off-grid option, 50 Watt Solar Home Systems (SHS) is being provided to consumers in remote rural areas where grid connection is inaccessible. But the SHS of the mentioned size can hardly produce 0.3 to 0.4 kilowatt-hour (kWh) of electricity per day, even under the best solar conditions. This electric energy is substantially lesser than the Basic Electric Energy (BEE = 50 kWh per month), being utilized in the country free of cost by grid connected low income households. In this research work, efforts have been made to determine the most economical options in South Africa's rural areas with off-grid capacity equivalent to BEE. For analysis, off-grid/micro grid options have been compared not only with one another but also with grid connection. To incorporate renewable resources spatial variations, the work has been carried out at provincial level with the period 2014 to 2050. From analysis, it has been found that currently grid-connection is marginally better than off-grid options. But due to increasing grid connection cost and development in the off-grid technologies, the later with generation equivalent to BEE will be a more attractive option to electrify South African rural areas.
Keywords: South Africa, rural electrification, renewable energy
Introduction
South Africa is a developing country, with a population of about 52.89 million people living in around 13.2 million households. In the early 1990s, the electrified households' percentage was around 35% which grew up to around 75% (including both formal and informal1 while 87% in the case of formal only). From this, it is clear that the South African government electrified the residential sector on a priority basis, but still a reasonable backlog, of around 3.4 million households, is to be electrified (Republic of South Africa, 2013), (Department of Energy, 2013).
In the latest approval, the South African government planned to electrify the sector to the maximum limit (up to 97% in case of formal households) by 2025. From the Department of Energy's statement, it is clear that they are not only considering the above mentioned backlog but also future growth in the sector. Additionally, it is mentioned that 90% of the households will be connected to the national grid, while the remaining 7% will use quality off-grid options (Bongwe, 2013).
The Department of Energy, South Africa, considered off-grid options due to the grid system infrastructure limitations, mainly transmission and distribution system availability to remote rural areas. To electrify the sector through grid, many challenges are being faced by the Electricity Supply Commission (Eskom)2 including:
1. More than 95% of all non-electrified households are from a low income group (i.e. annual income around ZAR3 50,000.00). For them, payment of connection charges is obviously difficult (Department of Energy, 2013), (University of South Africa, 2012).
2. About 31% of the South African population lives in rural areas of the country. In these areas, more than 60% of households have no access to electricity. This means that the share of the rural communities, in the non-electrified households, is more than 50%. From these facts, it can be deduced that the system cost will increase further if Eskom expands its transmission network in those areas (White and Kooperman, 2011; Municipal Institute of Learning, 2013; Madzhie, 2013; Noah, 2012).
3. According to Eskom, 'the consumption levels of rural customers are so low that it is impossible to recover capital and operations costs from the tariffs alone. In most instances, it is not possible to recover operation cost' (Barnard, 2011).
4. In the Integrated Energy Plan, the Department of Energy perceived further increase in the generation and operational costs of the system in future, which will result in further financial burden for the government if opted only for the grid option (Department of Energy, 2011).
From these facts and figures, the urgency of off-grid electrification options in South Africa can be understood. The government is currently providing 50 Watt Solar Home Systems (SHS) per household at a highly subsidized rate, to the remote rural consumers. Since 2002, a total 65 929 households have been electrified using SHS (Bongwe, 2013). According to Madzhie (2013), only in the fiscal year 2012-13, Eskom supplied 9 343 SHSs in different parts of the country with a total cost of 86 400 million rand. The figure of SHS supplied is impressive but the size of a 50 Watt solar system can hardly produce 12-15 kWh of electric energy per month under optimal weather conditions. This quantity of electric energy is hardly 20 - 30 % of BEE.4 Therefore, to make renewables based supply sufficient and reliable, increase in both generation and storage capacity is mandatory.
In this study, work has been carried out to analyse different off-grid options with enough reliability to determine the optimal choice using MESSAGE (Model for Energy Supply Systems And their General Environmental Impact). For analysis, the provinces are considered separately to incorporate the spatial variations in renewable resources availability. For example, the Cape region has better wind resources, therefore, the role of wind based generation would be more effective than other parts of South Africa.
Additionally for investment, two options have been considered. The first option is the case, in which investment cost is relatively lower, while O&M cost is high. The second option is opposite of the first one i.e. high investment with low O&M cost. For example a user installs a photovoltaic system using both solar panels and batteries of low cost. This will need frequent replacement of system components which will increase its O&M cost. Here in this case, the Investment cost is low, while O&M is high. To differential between the two options, numeric '1' has been added at the end of name for the first option, while '2' for the second one.
Analysis method
For analysis, the International Institute of Applied Systems Analysis' (IIASA) developed a modelling framework MESSAGE that has been used. The framework is also used by well-known organizations including the International Atomic Energy Agency (IAEA) and International Renewable Energy Agency (IRENA) for energy system analysis.
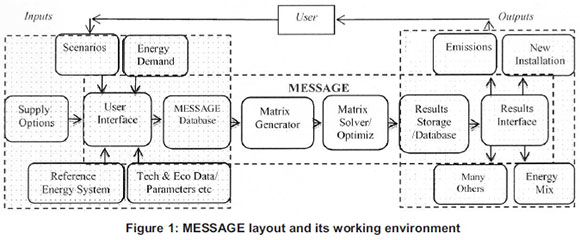
The user defines the energy system under consideration providing input data to the MESSAGE using a graphical user interface. On the basis of input data, MESSAGE produces an optimal solution using economics as the only criteria. The other criterion can also be incorporate by applying constraint or penalty e.g. CO2emissions can be incorporated in the decision criteria through applying a limit on its emission quantity or applying a cost for its production. In this research work, no limit or emission costs have been considered. Therefore, the results are solely investment and O&M costs dependent. To find the solution, MESSAGE uses linear and mixed integer (operation research) techniques. In general, the layout of MESSAGE and its working environment can be outlined as shown in Figure 1.
Assumption and data
Demand projection
The South African Government is providing 50 units (i.e. kWh) of electricity per household per month to low income consumers, free of cost, to fulfil their basic electricity needs (Adam, 2010). In this study, the total demand has been projected using the same electric demand per month per household in rural areas. To determine the total demand, it is therefore necessary to know about the number of households that are; I) located in rural areas; II) un-electrified; and III) belong to a low income group. For this purpose, the following information has been considered.
1. According to the University of South Africa (2012), around 48% (6.7 million) households in South Africa belonged to a poor group with annual income between 0-50 000 Rand per annum by 2010.
2. The Department of Energy found that 95% (3.2 million) of total un-electrified households, including both formal and informal, are from a lower income class (Department of Energy, 2013).
3. South Africa's 31% of population live in rural areas. In these areas, more than 61% are un-electrified. This means that:
Rural unelectrified population
= Total population x 0.31 x 0.61
= 52.89 million x 0.31 x 0.61
= 10.0 million
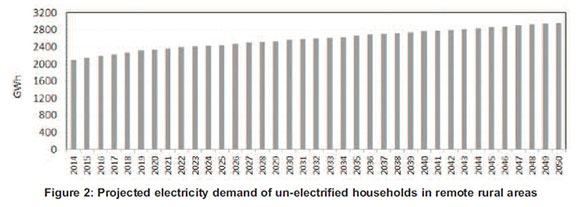
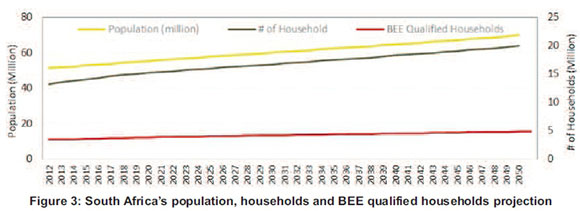
With these facts in mind, it can be deduced that most of the un-electrified households are from a lower income class and are locating in rural areas of South Africa. For a future number of such households, the Department of Energy (2013) household's projection has been taken into account with assumption that the low income class will decrease from 48% to 35% by 2050. This change could be for many reasons including socio-economic development, urbanization etc. Using these facts and figures, the projection would look like as shown in
Figure 1. In this figure, the demand of BEE qualified households has been considered for further analysis It is important to mention here that the Department of Energy numbers are average values at country level and may not represent specifically the rural communities. But adjustment in the number for rural community does not affect the main objective of the research work, which is targeted to determine the optimal option. Therefore, changes in the demand will affect the scale of required installed capacity, while the sequence of optimal choice would remain the same. Using Figure 2 households' projection with demand equal to BEE per household, the projected demand looks like as shown in Figure 3.
Supply options
The supply options are different type of standalone or hybrid generation facilities that could fulfil the rural consumers electric energy needs with reasonable reliability. For this purpose, the options considered are given in Table 1.
Except grid connection, all the above mentioned options have been analysed with battery storage, even in the case of a diesel generator. To fulfil the demand, the supply system charges the batteries to store electric energy. The stored energy is supposed to be used by consumers as per demand. Due to difference in supply options reliability, the storage capacity considered for each technology option is different. The additional feedback is considered only with a solar and wind standalone supply system due to their relatively low reliability.
Techno-economic data
Technologies basic prices
The basic prices of technologies are the market prices including services, installation and infrastructure cost (only if needed). For investment, WT and DG based standalone or their hybrid systems have been considered as micro grid. Due to this, additional cost of 30 - 50% of total investment cost for distribution within community has been considered. These basic prices of the technologies are the same irrespective of its installation location and are shown in Table 1. Later on for analysis, they are adjusted as per installation requirement. The need of adjustment and its concept are discussed below.
Technologies adjusted prices
To model the system, the investment and fixed cost should be in 'cost per unit of installed capacity', while variable cost in 'cost per unit of generation'. But here in this particular case, market costs data cannot be used directly in the modelling framework due to the following reasons:
1. The size of installed wind and solar change from place to place to provide the same energy to the consumer. For example, wind speed and its availability are better in the Western Cape than Gauteng. Therefore, a 1 000 Watt wind turbine will produce more energy in the Western Cape than Gauteng. To produce the same energy in Gauteng as in Western Cape, more WT capacity will be required there. This additional installation will make wind energy more expensive in Gauteng than Western Cape for the same demand.
2. The required installed capacity (Watt) of different technologies within a region will also be different from one another. For example anywhere, the required PV installed capacity will be significantly higher than DG to produce energy equivalent of BEE for the consumer.
3. In general, the household grid connection cannot be exactly defined in term of wattage due to variation in the demand. But the case becomes more complicated when the consumption level is so low i.e. up to 50 kWh. The daily load in such households could change between zero and maximum (most probably at the evening).
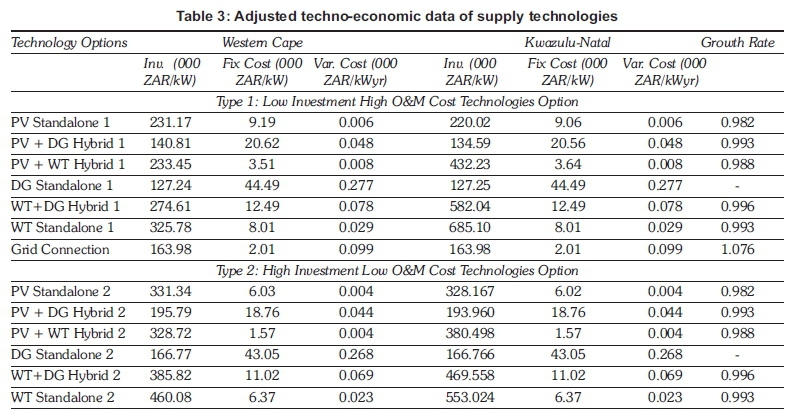
To overcome these issues and incorporate the required size and effect for comparison purposes, a hypothetical source of 95 watt has been considered. Such source can produce BEE with a utilization factor of 72%. For adjustment, the total investment of each supply option and their fixed costs in each province have been divided with this capacity. For variable costs, these have been divided with BEE i.e. 50 kWh to represent them in cost per unit generation. Since only wind and solar change from region to region, adjusted costs will change for the options where any of them is involved i.e. standalone or as hybrid. Additionally, the technologies development with time i.e. learning curve impacts, have also been considered in the work, with the corresponding rate mentioned in Table 3. For reference, the adjusted costs found for the Western Cape and Kwazulu-Natal have been shown in Table 3.
To have idea about the wind and solar resources availability and their impact on the adjusted investment cost, values found in all nine provinces have been shown in Figure 4.

Discount rate
For analysis, a discount rate (DR) of 11% has been used. This value is close enough to the DR (i.e. 11.3%) used by the Department of Energy, South Africa in the recent study i.e. Integrated Energy Plan-2012 (Department of Energy, 2013).
Renewable resources in South Africa
For wind and solar, the Atmospheric Science Data Center, NASA, USA data has been used (Atmospheric Science Data Center, 2014). To get the data from the Atmospheric Science Data Center (2014), one needs to provide colocation ordinates. For South Africa's provinces coordinates, a Google map online service has been used with South African solar and wind resource maps (Wind Atlas for South Africa, 2014; Google Map, 2014). Special attention was paid not to consider the location for data where resources availability are extraordinary different than remaining part of the province e.g. Wind resources availability in coastal regions of Western Cap and Eastern Cap are quite higher than remaining part of the province. The high resources availability in such areas make them attractive options for a grid connected large scale wind farm than just small size community based generation. Therefore, coordinates of such a location have not been used to extract data.
Results and findings
From an analysis of the system at provincial level, grid connection is generally found as an attractive option at the mentioned costs, but for a limited period of time. The probability of connection costs increase with expansion of the grid system is high. Therefore, everywhere around the country, renewables replaced the grid option to electrify rural areas. But the time taken by renewables based generation to replace grid connection varies. In general, with respect to time span and type of renewable choice, two to three different trends have been found to electrify the rural areas in South Africa. In the following three cases as representative of similar type findings are discussed, while remaining figures can be found in Appendix A of the work.
In general, the wind conditions in the Cape region of South Africa are good enough to be exploited. Therefore, in the Eastern Cape, Western Cape and Northern Cape, the WT-PV hybrid system is found to be the most attractive solution to replace grid connection and supply BEE to the consumer with enough high reliability. Moreover, the region also took a relatively short period to use renewables in place of grid option, which means that the renewable programme can be started now in rural areas of these provinces. For reference, the optimum installed capacity mix and its generation found in the Eastern Cape, are shown in Figure 5.

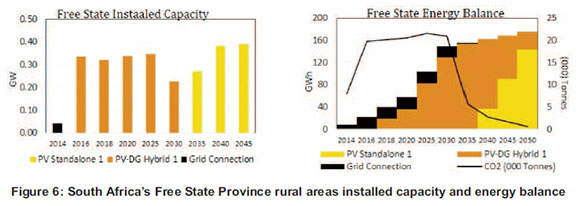
The country with those provinces where wind potentially is significantly low while solar high, the grid connection is found for a relatively longer period of time. In general, the regions are also found with a choice of a PV-DG hybrid system. But the role of PV-DG is found critical in the Free State only while in others, it could be ignored. The main candidate to electrify the rural areas in these provinces is therefore a PV based standalone system. Besides the Free State, the other provinces with this type of findings are Gauteng, KwaZulu-Natal, and Mpumalanga. For information, the installed capacity and energy balance found from simulation in the Free State Province are given in Figure 6.
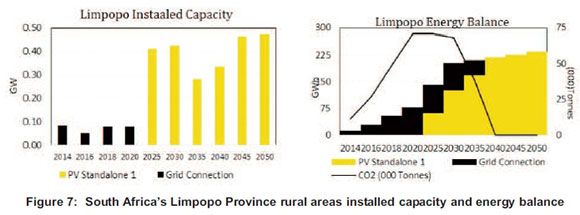
In Limpopo Province, the overall installation and energy generation trend is quite resemble as the previous one i.e. provinces with high solar insolation. But its extremely good solar resources make it a stronger candidate for a PV based standalone system. Therefore, the PV based standalone system followed the grid option soon after and no support of DG was found at all, as shown in Figure 7.
Discussion and conclusion
The results found in this study show that grid connection is the marginally preferred option with cost of ZAR 15 450 per connection. But this cost is growing continuously. According to Eskom, the growth rate recorded in the connection cost is around 1.10 for the period 1995 to 2009. Similarly, the growth rate recorded from 2008 to 2012, in the subsidy given by government per connection is found to be 1.19 (Madzhie, 2013). For these reason, the benchmark grid connection cost considered by the DoE in the Electrification Master Plan is ZAR 17 000 per connection for the rural consumer (Bongwe, 2013). If this increase in the connection cost continues due to system expansion for electrification, and the consumption level of the consumer remains relatively lower, the grid connection will be no more as an economical choice in South African rural areas.
In that case, a PV-WT based hybrid system in the Cape region would be a better choice. Despite the fact that wind is localized in nature, the region still has high potential for a small scale community or home based PV-WT (e.g. SolAir system) hybrid system with storage that can be exploited for remote areas of electrification. As the findings of the simulation showed that renewables replaced the grid option very soon, the implementation efforts for the choice can be started even now across the region.
In other parts of South Africa, PV standalone or its hybrid with DG is a more reliable choice. Compare to PV standalone, PV-DG hybrid is a more reliable and economical choice for a brief period but still the option attributes maintenance concerns. Due to motive parts and a relatively complicated structure of the diesel generator, the choice required more technical skills than others. Therefore, additional efforts will be required to provide highly skilled services in the areas. Moreover, the choice may not be a good one if CO2 emissions is considered in the decision making process. Keeping these in minds, a PV based standalone looks like good choice than its hybrid. For optimization of the investment, the electrification programme should be initiated in those remote areas where grid connection availability in the coming five to ten years is difficult.
At the end, it can be easily concluded that the targeted 7% off-grid electrification option in South Africa's long term plan is a reasonable choice but could not be achieved only through a PV based system, particularly in the Cape region. Moreover, the size of off-grid installed capacity per household should also be increased to a level where the rural consumer could fulfil its basic energy consumption including lighting, entertainment and communication. Finally, the greenhouse gases emission intensity of the South African electric sector is quite high due to the high coal share, therefore implementation of off-grid technologies will contribute in the reduction of CO2 emissions in the country.
Notes
1. Informal Household is a kind of housing structure usually constructed by using unconventional building materials e.g. a shack, used by poor urban residents.
2. The "C" is replaced by "K" for word Kommissie means Commission in Afrikaans (one of the national languages in South Africa)
3. ZAR stand for Zuid-Afrikanse Rand, which is South African's currency name
4. BEE is 50 kWh electric energy being provided by South African Government to the grid connected to an extremely low income class without charges
References
Adam F, (2010). Free Basic Electricity: A Better Life for All, Earthlife Africa Johannesburg, Republic of South Africa Available at: http://earthlife.org.za/www/wp-content/uploads/2010/03/Free-Basic-Electricity-Final-Low-res.pdf [Accessed on 10 December 2014]. [ Links ]
Alternagy, (2014). Alternagy Available at: http://www.alternagy.co.za/shop/earth-power-10kw-wind-turbine/, [ Links ] [Accessed on 10 February 2014].
Atmospheric Science Data Center (2014). Atmospheric Science Data Center, NASA Surface meteorology and Solar Energy – Location. Available at: https://eosweb.larc.nasa.gov/cgibin/sse/sse.cgi?jamal7925@gmail.com [Accessed on 10 February 2014]. [ Links ]
Barnard, W., (2011) Background to SA Electrification Program [Presentation], [ Links ] Department of Energy, Republic of South Africa. 11 November. Available at: http://siteresources.worldbank.org/EXTAFRREG-TOPENERGY/Resources/717305-1327690230600/8397692-1327691245128/WolseyBarnard_AEI_Presentation11Nov11.pdf [Accessed on 10 December 2014].
Bongwe K. (2013). Overview of Universal Energy Access Strategy [Presentation to Stakeholders Consultation Workshop on Integrated Energy Planning Report], Ministry of Energy, Department of Energy, Republic of South Africa. 31 October. Available at: http://www.energy.gov.za/files/IEP/DurbanWorkshop/Overview-of-Universal-Energy-Access-Strategy.pdf [Accessed on 10 December 2014]. [ Links ]
Department of Energy (2011). Integrated Resource Plan 2010, Department of Energy, Republic of South Africa. Available at: http://www.doe-irp.co.za/contentZIRP2010_updatea.pdf [Downloaded: 10 December 2014]. [ Links ]
Department of Energy, South Africa (2013). A survey of energy related behaviour and perceptions in South Africa, The Residential Sector 2012. Ministry of Energy, Department of Energy, Republic of South Africa. Available at: http://www.energy.gov.za/files/media/Pub/Survey%20of%20Energy%20related%20behaviour %20and%20perception %20in%20SA%20-%20Residential%20Sector%20-%202012.pdf [Accessed on 10 December 2014]. [ Links ]
Department of Energy, (2013) Integrated Energy Planning Report-2012 Department of Energy, Republic of South Africa. Available at: http://www.energy.gov.za/files/IEP/IEP_Publications/Draft-2012-Integrated-Energy-Plan.pdf [Accessed on 10 February 2014]. [ Links ]
Department of Energy (2014), Department: Energy, Republic of South Africa Available at: www.energy.gov.za, [ Links ] [Accessed on 10 February 2014].
Google Map, (2014) Google Map Available at: https://www.google.de/maps [Accessed on 10 February 2014]. [ Links ]
International Renewable Energy Agency, (2012) Power Sector, Renewable Energy Technologies: Cost Analysis Series, International Renewable Energy Agency (IRENA), Volume 1(5), pp. 34. Available at: https://www.irena.org/DocumentDownloads/Publications/RE_Technologies_Cost_Analysis-SOLAR_PV.pdf , [ Links ][Accessed on 10 February 2014].
Madzhie, L, (2013) Integrated National Electrification Program [Presentation], [ Links ] Department of Energy, Republic of South Africa. 13-June. Available at: http://mfma.treasury.gov.za/Media_Releases/ReviewOfLGInfrastructureGrants/Documents/ Review%20of%20Infrastructure %20Grants%20-%2019th%20March%20Sector%20Workshop/Presentations/DoE%,20-%o20INEPpdf [Accessed on 10 December 2014].
Municipal Institute of Learning (2013). Toward an Integrated Urban Development Framework, A Discussion Document. Municipal Institute of Learning, Republic of South Africa, available at: http://sacitiesnetwork.co.za/wp-content/uploads/2014/08/urban-policy.pdf [Accessed on 20 January 2014]. [ Links ]
Noah, A., (2012). Eskom's Electrification Program [Presentation to National Electrification Indaba], Distribution Division, Eskom. 15 March. Available at: https://pmg.org.za/files/131008eskom.ppt [Accessed on 10 December 2014]. [ Links ]
Republic of South Africa (2013). Mid-Year Population Estimates-2013, Statistical Release-P0302. Available at: http://beta2.statssa.gov.za/publications/P0302/P03022013.pdf [Accessed on 20 January 2014]. [ Links ]
Sustainable, (2014). Sustainable. Available at: http://www.sustainable.co.za/ [Accessed on 10 February 2014]. [ Links ]
University of South Africa (2012). Income and Expenditure of Households in South Africa, Bureau of Market Research. Information Blurb, University of South Africa. Available at: http://www.unisa.ac.za/contents/faculties/ems/docs/Press429.pdf [Accessed on 10 January 2014]. [ Links ]
Uprice (2014). Available at: https://www.uprice.co.za, [ Links ] [Accessed on 10 February 2014].
White, S., and Koopman, S., (2011). Off-grid electrification in rural areas of South Africa, energize (September 2011), Available at: http://www.ee.co.za/wp-content/uploads/legacy/Energize_2011_/09_SeT_01_Eskom_off-grid.pdf [Accessed on 20 January 2014]. [ Links ]
Wind Atlas for South Africa, (2014). Wind Atlas for South Africa. Available at: http://www.wasaproject.info/ [Accessed on 10 February 2014]. [ Links ]
Wind Atlas for South Africa, (2014). Wind Atlas for South Africa. Available at: http://www.wasaproject.info/ [Accessed on 10 February 2014]. [ Links ]
Workstation Solutions, (2014). Workstation Solutions Available at: http://www.wsol.co.za/genproducts.htm [Accessed on 10 February 2014]. [ Links ]
Received May 2014
Revised 25 June 2015

