


Servicios Personalizados
Articulo
 Inglés (pdf)
 Articulo en XML
 Referencias del artículo
Indicadores

Links relacionados
-
 Citado por Google
 -
 Similares en Google
Compartir

 Permalink
Journal of Energy in Southern Africa
versión On-line ISSN 2413-3051
versión impresa ISSN 1021-447X
J. energy South. Afr. vol.26 no.3 Cape Town ago. 2015
A perspective on South African coal fired power station emissions
Ilze PretoriusI; Stuart PikethI; Roelof BurgerI; Hein NeomagusII
IEngineering Power Plant Institute - Emission Control, Eskom; Climatology Research Group, Unit for Environmental Sciences and Management, North-West University, Potchefstroom, South Africa
IIEngineering Power Plant Institute - Emission Control, Eskom; School of Chemical and Minerals Engineering, Chemical Resource Beneficiation, North-West University, Potchefstroom, South Africa
ABSTRACT
This paper investigates trends of historical and projected future South African coal-fired power station criteria (total primary Particulate Matter (PM), Sulphur Dioxide (SO2) and Nitrogen Oxides (NOx)) and Carbon Dioxide (CO2) emissions. It was found that an energy restricted environment has an increasing effect on emissions, as emissions per energy unit increased from the onset of the South African energy crisis. PM emissions particularly, increased during the energy crisis period, due to increased pressure on PM abatement and lowered maintenance opportunity. Projections of future coal-fired power station criteria and CO2 emissions are made for four different future scenarios for the period 2015 to 2030. Three of the four scenarios are based on the lower projected energy demand baseline case as published in the updated Integrated Development Plan (IRP). The difference between these three scenarios is different retrofit rates of power stations with emissions abatement technologies. The fourth scenario is a worst case scenario and assumes high energy demand (and therefore no decommissioning of power stations), high emission rates (similar to worst past emission rates during the period 1999-2012) and no further abatement of emissions above and beyond current mitigation efforts. This scenario gives an indication of what South African coal-fired power station emissions could look like if the energy crisis persists. There is a marked difference between projected best and worst case PM emissions during the entire projected period, but especially during 2030 when worst case PM emissions compared to a 2015 baseline value are expected to rise by 40% and best case PM emissions are projected to decline by 40%. Worst case NOx emissions are expected to increase by 40% in 2030 from a 2015 baseline value whereas best case emissions are expected to decline 10% from the same level in 2030. Worst case SO2 emissions are predicted to increase by around 38% in 2030 and best case emissions are expected to decrease by around 20% in 2030 from a 2015 baseline value. Relative emissions used in the projection of future CO2 emissions in this paper differ from that used in the energy demand and energy mix modelling done for the updated IRP baseline case. The reason for this is that the modelling for the updated IRP assumed relative CO2 emission factors for supercritical boilers, whereas only Kusile and Medupi fall in this category and relative emissions from all other stations are, in fact, between 5% and 16% higher. For this reason, it seems unlikely that the South African climate commitment target for 2030 will be made.
Keywords: coal-fired power station emissions; energy crisis; South Africa; emissions projection; climate commitments
1. Introduction
The South African energy sector is currently faced with a number of challenges. Residential energy consumption dramatically increased (by 50%) during the period 1994 to 2007 due to the implementation of a Free Basic Electricity Policy in 2001. This meant that 50 kWh of electricity was supplied per household to poor households per month, free of charge (Inglesi and Pouris, 2010). Since 2007 the country has been experiencing an ongoing energy crisis. The main reason for this was the delay by government in making a decision to fund the building of a new power station after being warned of an energy crisis approaching in 1998, combined with an increase in demand as a result of economic growth and the implementation of the Free Basic Energy Policy (Department of Minerals and Energy (DME), 1998; Inglesi and Pouris).
During the energy crisis period, energy demand was met by means of delaying maintenance on the generation fleet. This led to the decline in performance of the fleet, which in turn, negatively impacted the effectiveness of the fleet to meet future demand (Integrated Resource Plan for Electricity (IRP), 2013). Three older power stations that were mothballed during the 1980's and early 1990 were returned back to service to alleviate the pressure on existing stations. It is believed that the energy demand/supply balance will remain vulnerable until Medupi and Kusile, two new power stations currently under construction, come fully online expectedly between 2018 and 2020 (Eskom, personal communication), although uncertainty still remains on the exact commissioning dates. In 2010 the South African Department of Environmental Affairs (DEA) promulgated a set of Minimum Emission Standards (MES) for criteria pollutants that will come into effect in 2015 and 2020, and is expected to decrease emissions (Department of Environmental Affairs (DEA), 2010a). However, a number of industries, including Eskom and Sasol, the two major role players in the combustion of coal in South Africa have filed applications for the postponement of, and in some cases, exemption from the MES (Iliso Consulting, 2013; SRK Consulting, 2013). The reasons for this are the high cost of compliance with the MES (with a capital cost of around 6% of the South African nominal Gross Domestic Product (GDP) for 2013) (Eskom, personal communication, 2014; Statistics South Africa, 2014), and the inflexibility of the MES by not taking the ambient air quality and exposed population surrounding power stations into account. This means that stations are expected to comply with the MES even if the national ambient air quality standards are met before compliance. It is further envisaged that a Carbon tax as an instrument to encourage carbon mitigation will come into effect in 2016 (Greve, 2013).
The energy sector in South Africa is the biggest contributor to SO2and NOx emissions and second highest contributor to PM emissions of all sources of air emissions in the country (70%, 55% and 36%, respectively) compared to industrial, commercial & institutional fuel burning (27%, 23% and 44%), vehicle emissions (2%, 21%, 5%), biomass burning (0%, 0.3%, 6%) and domestic burning (0.8%, 0.2%, 9%) (DEA, 2012; Scorgie et al., 2004). However, several studies have shown that power
station emissions are not the main cause of adverse health impacts from air quality in South Africa. Past studies have found that domestic burning has by far the largest impact on human health (Friedl et al., 2008; Scorgie et al., 2004). Domestic burning of wood, coal and paraffin is practiced by the very poor, living in informal settlements, in South Africa. In 2011, the number of households living in informal households was in the order of 1.25 Million, of which 57% of these households did not have access to electricity. Of the 43% of households that did have access to electricity, many opted to still making use of domestic burning of wood, paraffin and coal for their cooking and heating needs (Housing Development Agency (HDA), 2013).The reason for the large negative impact of domestic burning emissions on human health is the close proximity of emissions to humans (at ground level), the concomitance of peak emissions with periods of poor atmospheric dispersion (early morning, night time and winter time) and the release of these emissions within areas of dense population exposure to both indoor and outdoor pollution concentrations (Scorgie et al., 2004). On the other hand, power station emissions are emitted through tall stacks and therefore usually dilute in the atmosphere before reaching human lungs. It is believed that cost and unreliable supply are the main factors that keep the South African poor from switching to electricity (Friedl et al., 2008).
In the past, regional CO2and NOx emission factors for the power sector in Southern Africa were determined both theoretically and from continuous in-stack measurements for comparison to the Intergovernmental Panel on Climate Change (IPCC) default emission factors (Zhou et al. 2009). It was found that Southern African CO2 emission factors were on the upper end of the IPCC default emission range whereas NO2 emission factors were below the low end of the range. In 2013, a document was published on the outlook of the coal value chain in South Africa. Emissions projections for South African coal-fired power stations were made up until 2040 for four different future scenarios, namely a lag behind, more of the same, at the forefront and low carbon world scenario (South African Coal Roadmap (SACRM), 2013). However, this document is already outdated in terms of the decommissioning schedules of existing power stations and the projection of future South African energy demand (and therefore the building program of new power stations to meet this demand) (IRP, 2013). Currently there are no publications focusing on the current and future status of coal fired power station emissions in South Africa - taking into account the effect the energy crisis had on emissions, the most updated information on the decommissioning schedules of stations, the commissioning of stations currently under construction, the building of new stations and the retrofitting of stations with new, more efficient, emissions abatement technologies in the future.
The aim of this paper is to give a perspective on the contribution of South African coal-fired power stations to a wide range of pollutants, including criteria pollutants (PM, NOx, SO2) and CO2. Historical emissions were investigated in order to establish a relationship between an energy restricted environment and emission trends. Estimations of future coal-fired power plant criteria and CO2emissions from 2015 to 2030 in South Africa are made for worst case, business as usual, intermediate and best case scenarios which are based on different predicted future energy demand outlooks and retrofit scenarios of stations with emissions abatement technologies.
1.1 The South African power sector
South Africa generates 32% of total energy on the African continent. Eskom, one of the largest energy utilities in the world, is responsible for the generation of approximately 95% of South African electricity and 45% of Africa's electricity (Eskom, 2010). Eskom power is exported to Botswana, Lesotho, Mozambique, Namibia, Swaziland and Zimbabwe. Eskom-owned coal-fired power plants, all of which are base load plants, include Arnot, Duvha, Camden, Grootvei, Hendrina, Kendal, Komati, Kriel, Lethabo, Majuba, Matla, Matimba and Tutuka (Eskom, 2012). The remaining 5% of South African electricity is generated by coal-fired power plants owned by the private sector (Kelvin power plant), municipalities (Rooiwal, Pretoria West and Bloem-fontein power plants) and Sasol. Currently two additional Eskom plants are under construction, namely Medupi and Kusile. It is expected that the first units of each will come online during 2015, although there is still uncertainty about the precise dates (Eskom, 2013a; Eskom, 2013b). It is evident that even though the South African government is trying to reduce the country's dependence on coal; it will remain a dominant source of energy in South Africa, at least in the medium term.
Most South African power plants consist of six to ten units with an average capacity of approximately 600 megawatt (MW) each. Eight of the thirteen base-load stations have generating capacities in excess of 3 000 MW. When compared to the approximate average sizes of thermal power plants in the United States (737 MW) (US Energy Information Administration (US EIA), 2013a), it is clear that South African power stations are extremely large when compared to their international counterparts.
South Africa has been at the forefront in the developing world in recognizing climate change and its role in addressing carbon dioxide emissions. The latest developments include the commitments made by the presidency at the 2009 Climate Summit, to a 'peak, plateau and decline' emissions path between 2010 and 2050. This means that carbon emissions are allowed to peak between 2020 and 2025 at 500 megatons (Mt) to 550 Mt CO2equivalent and then to remain constant at this level until 2035, where after it should decline to between 200 Mt and 400 Mt in 2050 (DEA, 2010; Department of Environmental Affairs and Tourism (DEAT), 2009). In January 2010 the country formally notified its climate change mitigation proposals with the United Nations Convention on Climate Change. These included a 34% reduction of emissions below 'Business as Usual' by 2020 and a 42% reduction by 2025. Whether or not these targets can be realistically met will be addressed in Section 3.3 of this paper when future CO2 emissions projections for South Africa are discussed.
1.2 South African coal quality
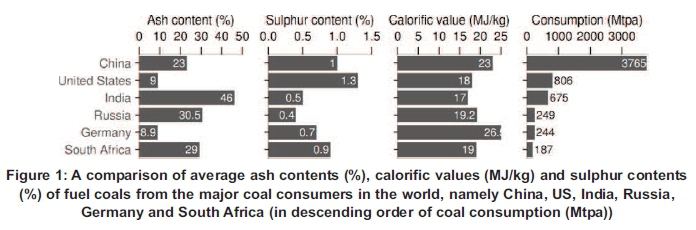
South African coal has the general characteristics of the southern hemisphere Gondwana coal and therefore differs from northern hemisphere Laurasian coal in being variable between regions and seams and in possessing relatively high ash contents, low calorific values and low sulphur, sodium, potassium and chlorine contents (Falcon and Ham, 1988). The variability in the quality of South African coals is illustrated by the fact that the difference between the maximum and minimum ash contents, calorific values and sulphur contents burned at Eskom during the 1999 to 2012 historical period was 4%, 6 mega joules per kilogram (MJ/kg) and 19%, respectively (Eskom, 2006 -2012). The average ash content, sulphur content and calorific values of South African fuel coals compared to those of China, United States (US), India, Russia and Germany, the major coal consumers in the world, are shown in Figure 1 (Chandra and Chandra, 2004; Eskom, 2006; 2007; 2008; 2009; 2011; 2012; European Association for Coal and Lignite (EURACOAL), 2013; Podbaronova, 2010; Sun, 2010 and US EIA, 2013b). The annual coal consumption of each country is also indicated in megatons per annum (Mtpa) (US EIA, 2014).
2. Methods
2.1 Historical South African power plant emissions
Historical South African coal-fired power station emissions were investigated in order to understand the effect of an energy restricted environment on emissions. Historical emissions and energy production information for Eskom power plants over the period 1999 to 2012 were obtained from the Eskom energy utility's annual reports (Eskom, 2006-2012). Total annual PM emissions reported in these reports were estimated by means of continuous opacity monitoring systems and estimated volumetric flow rates of flue gas in power station stacks. NOx, SO2 and CO2 annual emissions were estimated from mass-balance equations and annual coal consumption tonnages. Although Eskom does not currently calculate uncertainties associated with their emissions estimation techniques, it is estimated from similar operations elsewhere in the world that uncertainties associated with PM, NOx, SO2 and CO2 emissions estimation at Eskom is around 10%, maximum 20%, maximum 20% and maximum 7.5%, respectively (Source Testing Association, personal communication; European Commission, 2012; Evans et al., 2009). It was assumed that the coal-fired power plants not owned by Eskom followed the same emissions trends as the Eskom plants during this period. This assumption is valid as Eskom plants generate the major share of South African electricity (95%). Relative emissions from coal fired power stations were calculated by normalizing the absolute emissions (in units of mass per annum) for total electricity production per annum. It was assumed that all Eskom reported emissions originated from coal fired power stations as gas turbine stations (the only emitters apart from coal fired power stations) were responsible for only a fraction (<< 1%) of total energy production and therefore have a negligible effect on total criteria and CO2 emissions.
2.2 Future emission projections
Projections of future South African coal-fired power station emissions were made for the period 2015 to 2030. The decommissioning of power stations, the addition of Kusile and Medupi power stations and the building of new power stations in the future were included in the emissions projections. The decommissioning and new building schedules are strongly dependent on future energy demand, which in turn is dependent on numerous factors such as demand responses to higher electricity prices, structural changes in the economy, energy efficiency and population dynamics (Energy Research Centre, 2013; Department of Energy (DOE), 2012).
The projection of future South African energy demand is therefore associated with high relative uncertainties. However, the fact that this paper only looks at coal-fired power station demand projections simplifies this process to an extent. It is unlikely that Eskom will be able to construct another large scale coal-fired power station after the completion of Kusile and Medupi (Eskom, personal communication). Even if this is the case, the construction of such a power station will take time (Medupi and Kusile will take an estimated 15 years to be fully constructed) and therefore such a station will most likely only contribute to emissions after 2030 (the cut-off date of emissions projections in this paper). It is furthermore probable that the 50-year lifetimes of existing stations will be expanded instead of investing in new coal generating capacity as this will most likely be the more cost effective option. For this reason, the future coal-fired power station new building program and decommissioning schedules assumed in this study are based on the baseline projection as published in the updated IRP (IRP, 2013).
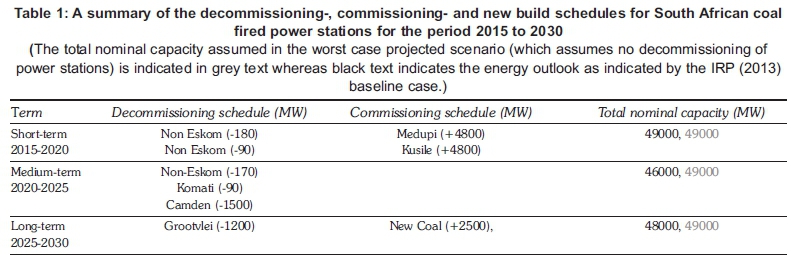
The baseline projection published in the IRP 2013 is the preferred power generation output of TIMES modelling done by the Energy Research Centre at the University of Cape Town (Energy Research Centre, 2013). The TIMES model makes use of a number of assumptions including demand projections, fuel prices and CO2 emissions constraints in order to project the optimal energy mix to sustain future demand (Energy Research Centre, 2013). The baseline scenario published in the recently updated electricity resource plan (IRP, 2013) and based on the above mentioned modelling, proposes that the lifetimes of existing coal-fired power stations (excluding the return-to-service stations) will be extended beyond their 50 year operational time period and that 2 500 MW of new coal-fired capacity be added in the future. This is believed to be a more realistic scenario compared to an addition of 6 500 MW and no extensions of the lifetimes of power stations as proposed in the IRP 2010. Business as usual, intermediate and best case future projections of criteria and CO2 emissions were based on the updated IRP baseline scenario (Table 1, black text), but an additional worst case scenario was included where high energy demand was assumed (and therefore that no power stations will be decommissioned) (Table 1, grey text). The worst case emissions scenario can be seen as an estimation of an upper limit of emissions if rapid economic growth occurs and the pressure on the South African energy system remains high.
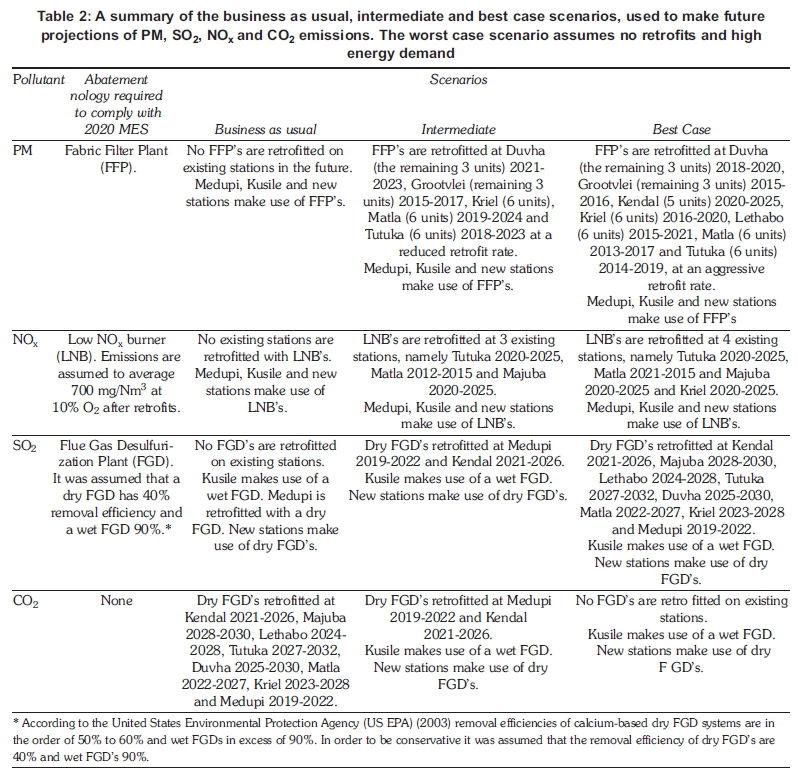
The business as usual, intermediate and best case scenarios are based on different retrofitting rates of power stations with newer, more efficient abatement technologies. Mitigation strategies for different pollutants are independent of one another and are all tied with different technologies, capacities and infrastructure development pathways. The abatement technologies include the retrofitting of Electrostatic Precipitators (ESPs), the current abatement technologies used at around half of the existing power stations with Fabric Filter Plants (FFP's) (which have higher efficiencies than ESPs) for reducing PM emissions, Low NOx Burners (LNB) for reducing NOx emissions, and Flue Gas Desulfurization Plants (FGD) for SO2 emissions reductions. The business as usual scenarios assume retro-fitments only on new stations whereas the intermediate and best case scenarios assume less aggressive and aggressive retro-fitment rates, respectively. There is no emissions abatement planned for CO2 emissions reductions at present; however CO2 emissions are influenced by the FGD retrofit scenario as CO2 is a direct by-product of the wet FGD process and the additional auxiliary power requirements of the FGD system of around 1% of annual power generation by the station (EON Engineering, 2007). CO2emission scenarios are therefore slightly influenced by the SO2 retrofit scenario. The effect of LNB's on CO2 emissions was considered to be negligible (there are some who believe it will impact CO2 emissions by changing the thermal efficiency of a power station, but information on this is scarce). A summary of the retrofit schedules assumed in the business as usual, intermediate and best case scenarios are given in Table 2. Retrofit rates and schedules were possible scenarios proposed by Eskom (Eskom, personal communication).
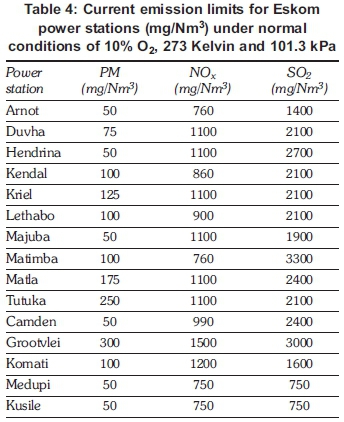
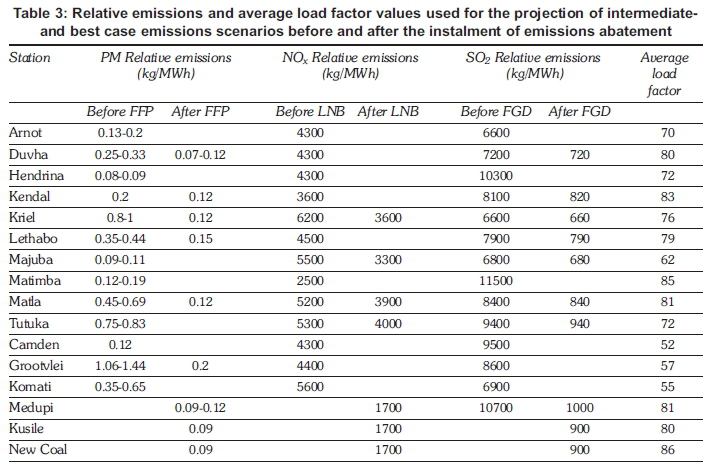
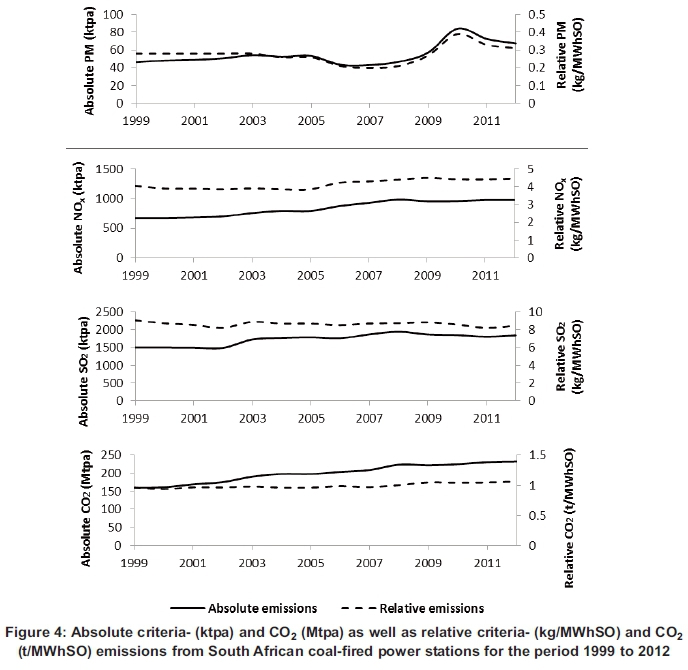
Intermediate and best case emissions were calculated by making use of relative emissions for the different retrofit scenarios (Table 3) based on the efficiency of emissions abatement technology and projected future load factors (Eskom, personal communication). Retrofits of FFP's, LNB's and FGD's take place at a rate of one unit per year and therefore relative emissions were allowed to gradually decrease during the retrofit period. Business as usual criteria emissions projections were calculated from the current emission limits to which stations adhere (see Table 4) (Eskom, personal communication). Relative CO2 emissions for the business as usual, intermediate and best case scenarios were assumed to be 1 000 kg/MWSO for all power stations where no FGD retrofits take place (Eskom, personal communication). The annual increase in CO2 emissions that would result due to the installation of an FGD plant at a given power station were obtained from Eskom's applications for postponement or exemption from the MES (Eskom, 2013c; 2013d; 2013e; 2013f; 2013g; 2013h; 2013i). Worst case scenarios were calculated by making use of the highest relative emissions of the power generation fleet during the historical period 1999 to 2012 (see Figure 4) and the projected generating capacity based on a high future energy demand scenario assuming that no power stations are decommissioned during the projected period (grey values in Table 1).
The formula used to calculate total emissions from relative emissions is as follows:
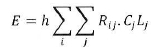
Where E is total annual emissions of a specific pollutant, i, in tons/year, h is the total hours in a year, R is the relative emission in tons per megawatt hour sent out (t/MWhSO), Cj is the total nominal capacity of power station j (MW), and Lj is the generation load factor of power station j (%) as planned by Eskom (Eskom, personal communication). The following formula was utilized to calculate total emissions from emission limits and the volumetric flow rates of power stations:
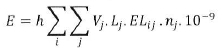
Where Vj is the specified gas volume flow rate in normal cubic metres per hour (Nm3/h) for a single boiler at power station j, ELij is the emission limit of pollutant i in milligrams per normal cubic metre (mg/Nm3) with which power station j comply and Njis the number of boilers at power station j.
Even though South African legislation dictates that emissions information should be available to the public of South Africa, the reality is that information is relatively inaccessible. It was therefore not possible to obtain current information from Sasol, Kelvin power station and the municipal power stations. Emissions estimations for these non-Eskom plants were made by assuming that they have similar emissions to Eskom plants of similar ages and operational conditions, making use of similar emissions abatement technologies. This is the same approach taken in the SACRM (2013). The future energy projections further assumed that future fuel coal quality will remain constant and similar to current values.
3. Emissions trends and projections
3.1 South African power plant emissions during the energy crisis
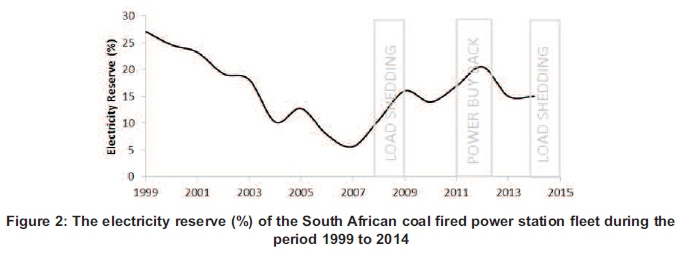
Electricity reserve is the amount of reserve energy in an electric power system left after consumer supply has been met at all times. The electricity reserve is required in order to operate reliably in the face of possible unplanned equipment outages and fluctuations in demand due to occurrences such as unusually cold weather conditions (DOE, 2010). Electricity reserve can therefore be used as an indicator of how much pressure an electricity generation system is under. When electricity demand is greater than supply, there will be very little spare electricity in the system. The decline in the electricity reserve of the South African energy system from 1999 to 2007 marks the approach of the energy crisis (Figure 2) (Eskom, 2006-2012; Eskom 2014).
During the period leading up to the energy crisis and during the energy crisis itself, the electricity reserve fell well below the Eskom aspiration of 15%. Internationally, percent electricity reserve requirements usually fall in the range of 15% to 25% (DOE, 2010). The electricity reserve curve was skewed after 2008, when the implementation of load shedding increased the electricity reserve artificially. During 2011 and 2012, the reserve was increased by means of the application of power buy-backs by Eskom, in which certain energy intensive consumers were paid not to use energy during this period. From the end of 2014 onwards, the reserve was again increased by means of the implementation of load shedding and Eskom urging large consumers to cut back their electricity consumption by 10%.
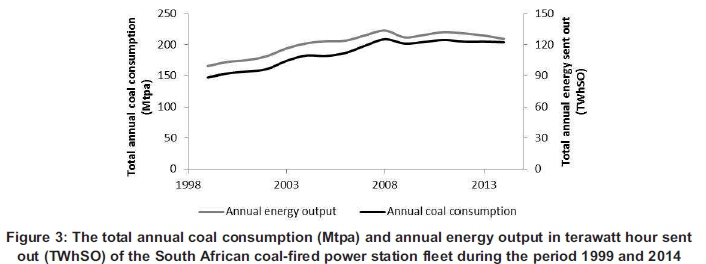
Three older power plants (Camden, Grootvlei and Komati) that were mothballed during the late 1980's and early 1990's had to return back to service during 2004 to 2013 in order to help alleviate the pressure on operational plants. These older plants have lower thermal efficiencies and, in most cases, make use of older, less effective particulate matter abatement technologies. Since the load shedding that occurred during 2008, electricity demand could be met by means of delaying maintenance on the generation fleet, which led to the decline in performance of the fleet (IRP, 2013). This deteriorating effect is evident in the fact that the IRP (2011) assumed the fleet to have an average availability of 86%, but in reality the actual performance declined to less than 80% (IRP, 2013). The combination of the above mentioned factors contributed to the decline of approximately 3% in the overall thermal efficiency of the fleet between 2007 and 2012 (Eskom, 2006; 2007; 2008; 2009; 2011; 2012). The energy crisis therefore had a negative effect on the overall thermal efficiency of South African power plants, which meant that more coal had to be burned in order to produce the same amount of energy. The decline in the thermal efficiency of the fleet led to an increase in coal burn of approximately 8% per annum relative to energy output from 2008 onwards as indicated in Figure 3 (Eskom, 2006-2012; Eskom 2014).
The relative (emissions per energy output) and absolute (total annual emissions) criteria- and CO2 emissions for South African power plants for the period 1999 to 2012 are shown in Figure 4 (Eskom, 2006-2012). Absolute emissions are a multiplication function of the relative emissions and annual energy sent out. Therefore it is important that absolute emission trends be seen against the annual energy sent out (Figure 3).
PM emissions are mainly a function of the ash content of the coal burned and the efficiency of the PM abatement technology used (United States Environmental Protection Agency (US EPA), 1993). Approximately half of South African thermal power plants currently make use of ESPs for PM control and the other half make use of FFP's. In general, the FFP removal efficiencies are higher than those of ESP's, by design. In South Africa, plants making use of ESP's experience additional difficulties associated with the low sulphur content of coal fuels (and therefore low resistivities of fly ash), and various operational and maintenance challenges. In order to mitigate the problem of low resistivity fly ash, flue gas conditioning (by means of SO3 injection) is done at the majority of plants that make use of ESPs.
The sharp increase in relative PM emissions from 2007 to 2010 is explained by the increase in relative PM emissions due to the increased pressure on PM abatement equipment during this period. From 2010 onwards, relative PM emissions started to decline, albeit not to pre-energy crisis levels. This reduction is explained by the major modifications that were completed on particulate emission abatement equipment in 2010 (Eskom, 2010). Absolute emissions mainly followed the same trend as that of relative emissions, thereby showing that the absolute emissions were strongly affected by the increase in relative emissions during the energy crisis period. Absolute PM emissions almost doubled between 2007 and 2010 (from 43 ktpa to 84 ktpa) when energy output only increased by approximately 0.3% during the same period. It is therefore clear that PM emissions were highly affected by the energy crisis. The reason for this is the fact that abatement technology experienced tremendous strain during the energy-restricted period and maintenance opportunity was low. PM is the only pollutant that is currently controlled by means of abatement, but in the future FGD's and LNB's maybe installed to control SO2 and NO2 emissions, respectively. It can be argued that, if the energy crisis persists in the future, removal efficiencies of these abatement technologies will probably be lower than expected, as in the case of PM abatement during the historical energy crisis period (2007 to 2012).
The absolute and relative NOx emissions during the period 1999 to 2012 are indicated in Figure 4. NOx emission factors are governed by a number of different factors, including the thermal efficiency of the plant, fuel quality, boiler type and emission control level (US EPA, 1993). Currently, none of the South African thermal power plants make use of NOx abatement technologies. From 2006 onwards, absolute NOx emissions increased by 10% (from 877 ktpa to 977 ktpa) whereas energy output only increased by 6%.
Uncontrolled SO2 emissions from conventional pulverized combustion are almost exclusively a function of the sulphur content in the fuel and SO2 abatement (US EPA, 1993). Currently there are no operational power stations using SO2 abatement. The absolute and relative SO2 emissions from the South African coal fired power station fleet during the period 1999 to 2012 are shown in Figure 4. Relative SO2 emissions (kg/MWhSO) remained relatively stable during the energy crisis period, and absolute emissions mainly followed the energy sent out trend of Figure 3. This can be explained by a decrease in average sulphur content in coals burned during the period 2007 to 2012 of around 10% (Eskom 2007-2012).
The amount of CO2 emitted by a thermal power plant depends on the thermal efficiency of the plant and the extent to which the energy content of the coal can be converted into electrical energy without losses. Absolute CO2 emissions increased by 15% (from 200 Mtpa to 230 Mtpa) during the 2006-2012 period (Figure 4) whereas energy output only increased by 6% (Figure 3). The reason for this increase was the reducing effect the energy crisis had on the overall thermal efficiency of the fleet.
3.2 Emissions projections
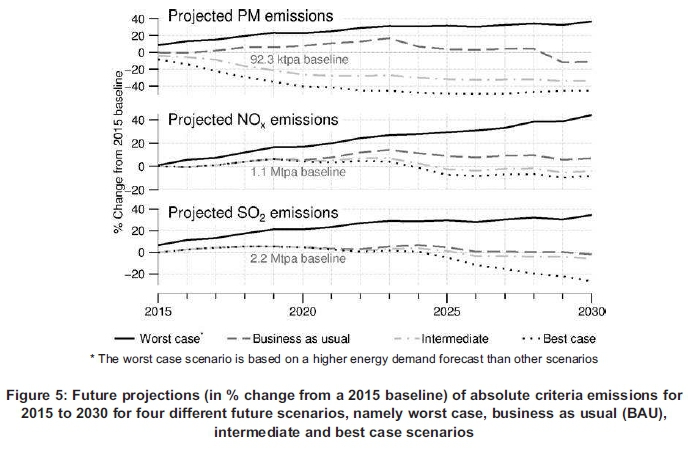
Future projections of absolute criteria coal-fired power station emissions indicated as a percentage growth against a 2015 baseline are depicted in Figure 5. It is important to note that projections for 2015 differ and that for this reason not all projections intercept zero. Real projected values (not normalized for a 2015 baseline case) are tabulated in Table 5 and are supplied for input to prospective modelling endeavours.
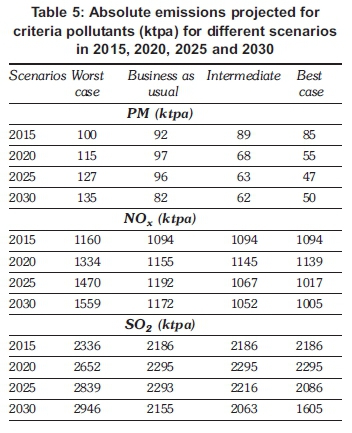
There is a marked difference between projected best- and worst case PM emissions during the entire projected period, but especially during 2030 when worst case PM emissions are expected to rise by 40% from a 2015 baseline value and best case PM emissions are projected to decline by 40% from the same value (Figure 5). Eskom plans to retrofit FFP's at five existing stations and Medupi and Kusile will also make use of FFP's (Eskom, 2013c; 2013d; 2013e; 2013f; 2013g; 2013h; 2013i). If this plan goes forward, future PM emissions will most probably follow the intermediate scenario trend which means that PM would have decreased by around 28% in 2030 compared to a 2015 baseline value (Figure 5). However, if pressure on the energy system remains high and maintenance opportunities are continually missed, retrofits may not be possible and emissions may follow the business as usual or even the worst case scenario trends.
Worst case NOx emissions are expected to increase by 40% in 2030 from a 2015 baseline value whereas best case emissions are expected to decline 10% from the same level in 2030. There is not a marked difference between predicted best case and intermediate emissions trends. Eskom undertakes to install LNB's at four of its existing stations (Medupi and Kusile will both also make use of LNB's) (Eskom, 2013c; 2013d; 2013e; 2013f; 2013g; 2013h; 2013i), if this is done and if the current pressure on the energy system decreases, emissions will follow the approximate best case NOx emissions trend, which means that emissions are expected to decline by approximately 10% between 2015 and 2030.
There is a marked difference between worst-and best case SO2 emissions during 2030 (Figure 5), where worst case emissions are predicted to increase by around 38% from a 2015 baseline in 2030 and best case emissions are expected to decrease by around 20% in 2030 from the same baseline value. Eskom undertakes to retrofit one FGD at Medupi power station (although some uncertainty exists on this). FGD systems are major infrastructure investments with high complexity of operation and are associated with high capital and operational costs. This means that the most probable SO2 emissions trend is the business as usual scenario (which is projected to stay relatively constant
3.3 CO2 emissions projections and South African climate commitments
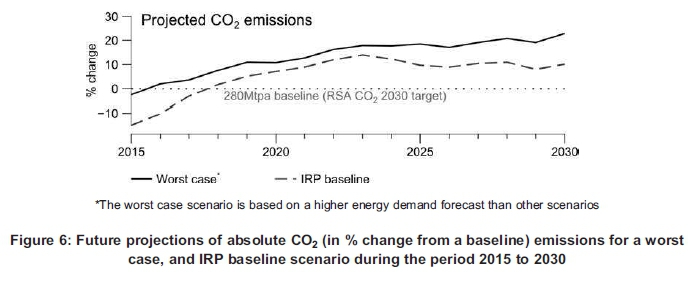
Absolute emission projections for CO2 are given in Table 6 whereas CO2 projections in % change from a 2015 baseline value are shown in Figure 6. The difference between CO2 scenarios assuming different retrofit rates of FGDs (business as usual, intermediate and best case scenarios) was negligibly small and was therefore indicated as a single line in Figure 6 (namely IRP Baseline, because of the fact that these scenarios assume the updated IRP baseline future energy demand and energy mix). The worst case- and IRP baseline projected CO2 emissions in 2015 differ because of the fact that they have assumed different relative CO2 emissions, and for this reason both lines do not intercept zero. One of the assumptions of the TIMES energy demand/energy mix modelling was that CO2 emissions are capped at 275 Mtpa from 2025 onwards in order to follow a peak, plateau and decline trajectory (Energy Research Centre, 2013). However, use was made of relative CO2 emissions for supercritical boilers in the modelling (IRP, 2013). Only Medupi and Kusile fall in this category, whereas all 13 other base load stations as well as Sasol and municipality-owned stations do not. Relative CO2 emissions assumed for supercritical boilers in the TIMES modelling and IRP (2013) are 947 kg/MWhSO, whereas the Eskom average for the period 2002 to 2012 was 1002 kg/MWhSO and projections in this publication assumed 1000 kg/MWhSO. This means that CO2 emissions were underestimated during the energy forecast modelling for the updated IRP.
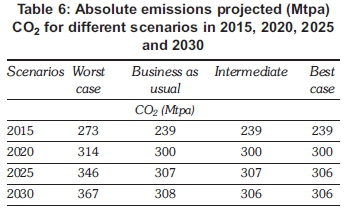
When a 45% contribution of the electricity sector (and specifically coal fired power stations) to total carbon emissions in South Africa is assumed, the upper limit carbon emissions of the electricity sector, according to South Africa's climate change commitments, should be in the order of 280 Mt by 2030 (IRP, 2013). From the CO2projections in this study (Table 6) it is clear that it is unlikely that this target will be met, unless economic growth and energy demand dramatically decrease in the future.
4. Conclusions
South African coal is variable between regions and seams and has relatively high ash contents, low calorific values and characteristically low sulphur contents. The difference between the maximum and minimum ash contents, calorific values and sulphur contents during the historical period 1999 to 2012 is 4%, 6 MJ/kg and 19%, respectively. The implication of this is that emissions from South African coal-fired power stations may vary only based on the variability of fuel coals. This is especially true for uncontrolled SO2 emissions as sulphur contents showed large variability during the historical period.
An energy-restricted environment has an increasing effect on emissions. This is especially true for pollutants controlled by means of abatement as increased pressure on abatement technology and low maintenance opportunity reduce removal efficiencies. Absolute PM emissions doubled between 2007 and 2010, the height of the energy crisis, when energy output only increased by around 0.3% during the same period. There is a marked difference between projected best- and worst case PM emissions during the 2015 to 2030 projected period, but especially during 2030 when worst case PM emissions are expected to rise by 40% from a 2015 baseline value and best case PM emissions are projected to decline by 40% from the same value.
NOx emissions increased by 10% during the 2006-2012 energy crisis period whereas energy output only increased by 6%. The reason for this increase was the reducing effect the energy crisis had on the overall thermal efficiency of the coal-fired power station fleet. Worst case NOx emissions are expected to increase by 40% in 2030 from a 2015 baseline value whereas best case emissions are expected to decline 10% from the same level in 2030.
SO2 emissions did not increase during the energy crisis because the sulphur content in fuel coals decreased. There is a marked difference between worst- and best case SO2 emissions during 2030, where worst case emissions are predicted to increase by around 38% from a 2015 baseline in 2030 and best case emissions are expected to decrease by around 20% in 2030 from the same baseline value. The best case SO2 scenario (eight stations being retrofitted with FGD's) is highly improbable as FGD systems are major infrastructure investments with high complexity of operation and are associated with high capital and operational costs. At best Eskom undertakes to retrofit one FGD at Medupi power station (although some uncertainty exists on this). This means that the most probable SO2 emissions trends are the business as usual scenario (which is projected to stay relatively constant between 2015 and 2030) or the worst case scenario (projected to increase by around 20% during the 2015 to 2030 period), if pressure on the energy system persists.
CO2 emissions increased by 15% during the 2006-2012 period whereas energy output only increased by 6%, as a result of the decline of power station thermal efficiencies during the energy restricted period. Relative emissions used in the projection of future CO2 emissions in this publication differs from that used in the energy demand and energy mix modelling done for the updated IRP baseline case. The reason for this is that the modelling for the updated IRP assumed a relative CO2 emission for supercritical boilers whereas only Kusile and Medupi fall in this category. The relative CO2 emissions for the rest of the South African coal-fired power station fleet are between 5% and 16% higher than that of supercritical boilers. From projections of future CO2 emissions in this study it seems unlikely that the South African climate commitment target of 280 Mt in 2030 will be made, unless energy demand dramatically decreases in the future.
Acknowledgements
The authors wish to thank Eskom for their knowledge sharing and for providing information without which this publication could not be possible. The authors further thank the National Research Foundation for the funding of this research project and three anonymous reviewers for their constructive inputs.
References
Chandra, A., and Chandra, H., (2004). Impact of Indian and imported coal on Indian thermal power plants. J. Sci. Ind. Res. 63, 156-162. [ Links ]
Department of Energy (DOE), (2010). Reserve Margin - IRP 2010 Input Parameter information sheet (Supply input). [ Links ]
Department of Energy (DOE), (2012). Draft 2012 Integrated Energy Planning Report. Annexure A-Technical report, Part 1: Demand modelling report. [ Links ]
Department of Environmental Affairs (DEA), (2010). National Environmental Management: Air Quality Act, 2004 (Act No. 39 of 2004). List of activities which result in atmospheric emissions which have or may have a significant detrimental effect on the environment, including health, social conditions, economic conditions, ecological conditions or cultural heritage. Government Notice, No 33064, 10 March 2010. [ Links ]
Department of Environmental Affairs (DEA), (2012). Fuel Burning Emissions: Contribution to total particulate, sulphur dioxide and nitrogen oxide emissions. Accessed 18 June 2015, http://soer.deat.gov.za/1322.html. [ Links ]
Department of Environmental Affairs and Tourism (DEAT), (2009). South Africa's Long Term Mitigation Scenarios: Process and Outcomes. Presentation at the Climate Change Summit 2009. [ Links ]
Department of Minerals and Energy (DME), (1998). White Paper on the Energy Policy of the Republic of South Africa. [ Links ]
Energy Research Centre, (2013).Towards a New Power Plan. For the National Planning Commission. University of Cape Town. [ Links ]
E-ON Engineering, (2007). Kendal Retrofit Research Study, Phase 1. [ Links ]
Eskom, (2006). Eskom Annual Report. Eskom holdings Limited. [ Links ]
Eskom, (2007). Eskom Annual Report. Eskom holdings Limited. [ Links ]
Eskom, (2008). Eskom Annual Report. Eskom holdings Limited. [ Links ]
Eskom, (2009). Eskom Annual Report. Eskom holdings Limited. [ Links ]
Eskom (2010). Eskom Annual Report. Eskom holdings Limited. [ Links ]
Eskom (2011). Eskom Integrated Report. Eskom holdings Limited [ Links ]
Eskom (2012). Eskom Integrated Report. Eskom holdings Limited. [ Links ]
Eskom (2013a). Eskom Integrated Report. Eskom holdings Limited. [ Links ]
Eskom, (2013b). Medupi Power Station Project Schedule. [ Links ]
Eskom, (2013c). Exemption from the Minimum Emission Standards for the Duvha power station. [ Links ]
Eskom, (2013d). Exemption from the Minimum Emission Standards for the Kendal power station. [ Links ]
Eskom, (2013e). Exemption from the Minimum Emission Standards for the Kriel power station. [ Links ]
Eskom, (2013f). Exemption from the Minimum Emission Standards for the Lethabo power station. [ Links ]
Eskom, (2013g). Exemption from the Minimum Emission Standards for the Matla power station. [ Links ]
Eskom, (2013h). Exemption from the Minimum Emission Standards for the Medupi power station. [ Links ]
Eskom, (2013i). Exemption from the Minimum Emission Standards for the Tutuka power station. [ Links ]
European Association for Coal and Lignite (EURA-COAL), (2013). Annual Report, 2013. [ Links ]
European Commission, (2012). The Monitoring and Reporting Regulation - Guidance on Uncertainty Assessment. MRR Guidance Document No. 4, final version of 5 October 2012. [ Links ]
Evans, S., Deery, S., and Bionsa, J., (2009). How Reliable are GHG Combustion Calculations and Emission Factors?, Presented at the CEM 2009 Conference, Milan, Italy, available via http://www.theclimateregistry.org/down-loads/2009/05/CleanAirEngineering-HowReliableareGHGCombustionEmissionFactors.pdf (last access: 11 November 2014), 2009. [ Links ]
Falcon, R., and Ham, A.J., (1988).The characteristics of Southern African coals. J. S. Afr. Inst. Min. Metall., 88(5), 145-161. [ Links ]
Friedl, A., Holm, D., John, J., Kornelius, G., Pauw, C.J., Oosthuizen, R., and van Niekerk, A.S., (2008). Air pollution in dense, low-income settlements in South Africa. In proceedings: National Association for Clean Air (NACA), 2008, Nelspruit, Mpumalanga. [ Links ]
Greve, N., (2013). Carbon tax postponed to 2016. Mining Weekly. Published 26th February 2013, Accessed 27 Feb 2014. http://www.miningweekly.com/article/carbon-tax-postponed-to-2016-2014-02-26. [ Links ]
Housing Development Agency, (2013). South Africa: Informal settlements Status (2013). Research Report, Johannesburg. [ Links ]
Iliso Consulting, (2013). Background Information Document on the application for postponement of and in some cases exemption from the proposed MES for Eskom's coal and liquid fuel-fired power stations. Version 1: 5, June 2013. [ Links ]
Inglesi R, and Pouris A., (2010). Forecasting electricity demand in South Africa: A critique of Eskom's projections. S Afr J Sci. 106 (1). [ Links ]
Integrated Resource Plan for Electricity (IRP), (2011). Integrated Resource Plan for Electricity 2010-2030. [ Links ]
Integrated Resource Plan for Electricity (IRP), (2013). Integrated Resource Plan for Electricity 2010-2030, Updated Report. [ Links ]
Podbaronova, J., (2010). Assessment of coals from Russia and countries of former Soviet Union for utility fluidized bed boilers. Master's thesis, Lappeenranta University of Technology, Faculty of Technology, Bioenergy Technology. [ Links ]
Scorgie, Y., Burger L.W., and Annegarn, H.J. (2004). Socio-economic Impact of Air Pollution Reduction Measures - Task 2: Establishment of Source Inventories, and Task 3: Identification and Prioritisation of Technology Options. Report compiled on behalf of NEDLAC, 25 June 2003. NED-LAC, Rosebank. [ Links ]
South African Coal Roadmap (SACRM), (2013). Outlook for the coal value chain: Scenarios to 2040. Technical report. [ Links ]
SRK Consulting, (2013). Applications for Postponement and exemption from certain requirements of the National Environmental Management: Air Quality Act No. 39 of 2004 - Minimum Emissions Standards for Sasol's Operations in Secunda, Sasolburg and Ekandustria. [ Links ]
Statistics South Africa, (2014). Gross Domestic Product, Fourth quarter 2013. Statistical release, Pretoria. [ Links ]
Sun, G., (2010). Coal Initiative Reports. Coal in China: Resources, Uses, and Advanced Coal Technologies. Energy Technology Innovation Policy Group, Kennedy School of Government, Harvard University, Cambridge, MA. [ Links ]
US Energy Information administration, (2013a). Electric Power Annual. [ Links ]
US Energy Information Administration, (2013b). Quarterly Coal Report, July - September 2013. [ Links ]
U.S. Energy Information administration, (2014). International Energy Statistics. Accessed 12 December 2014 http://www.eia.gov/cfapps/ipdbproject/IEDIndex3.cfm?tid=1&pid=1&aid=2. [ Links ]
United States Environmental Protection Agency (US EPA), (1993). Emission Factor Documentation for AP-42 Section Bituminous and Subbituminous coal combustion. Office of Air Quality Planning and Standards, Office of Air and Radiation, US Environmental Protection Agency, Research Triangle Park, NC. [ Links ]
United States Environmental Protection Agency (US EPA), (2003). Air Pollution Control Technology Factsheet. Flue Gas Desulfurization (FGD) - Wet, Spray-Dry and Dry scrubbers. [ Links ]
Zhou, PP, Yamba, FD., Lloyd, P, Nyahuma, L., Mzezewa, C., Kipondya, F., Keir, J., Asamoah, J., Simonsen, H., (2009). Determination of regional emission factors for the power sector in Southern Africa. Journal of Energy in Southern Africa 20 (4). [ Links ]
Received 15 February 2015
Revised 13 August 2015

