


Services on Demand
Article
 English (pdf)
 Article in xml format
 Article references
Indicators

Related links
-
 Cited by Google
 -
 Similars in Google
Share

 Permalink
Journal of Energy in Southern Africa
On-line version ISSN 2413-3051
Print version ISSN 1021-447X
J. energy South. Afr. vol.26 n.3 Cape Town Aug. 2015
Low-income resident's preferences for the location of wind turbine farms in the Eastern Cape Province, South Africa
Jessica HoskingI; Mario du PreezII; Gary SharpII
IInsight Analysis
IINelson Mandela Metropolitan University, Summerstrand Campus, Port Elizabeth, South Africa
ABSTRACT
There is a general consensus that South Africa should be generating more power through harnessing renewable energy resources, such as wind power. However, there is no consensus with regard to the location of such generating projects. This paper describes a wind farm project proposed for development in the Kouga Local Municipality, reports low-income local residents' preferences on its nature and applies choice modelling to analyse these preferences. A questionnaire was presented to each respondent, the discrete choice experiment component of the questionnaire included two different onshore wind energy development scenarios and a status quo option. The scenarios differed by the combination of four elements: the distance of the wind turbines from residential areas, job creation, the number of turbines and a subsidy allocated to each household.
Keywords: wind, energy, underprivileged, welfare, preference, choice
1. Introduction
South Africa is the 12th largest emitter of greenhouse gasses in the world and responsible for almost half of all emissions in Africa (EDF, 2014) in large part because the majority of electricity in South Africa is produced from coal. In order for South Africa to reduce its carbon emissions and comply with the UN Framework Convention on Climate Change and the Kyoto Protocol, Eskom, its leading electricity supplier, is committed to diversifying its energy mix (DEA, 2011; SAinfo Reporter, 2008; UNEP 2009; Gets & Mlanga, 2013). The quest to reduce carbon emissions has led to a drive to increase the percentage of energy produced by renewable and sustainable sources. The most prominent of these sources today is wind energy. There are wind farms currently being developed in South Africa in both the Western Cape and Eastern Cape provinces of South Africa.
The reason wind is favoured as a source for the generation of electrical energy is because wind resources are easily harnessed through the use of wind turbine technology (Edkins, Marquard & Winkler, 2010). By the end of 2010, wind energy projects in South Africa had an installed capacity of 10 MW (WWEA, 2011). The goal of the South African government was to generate approximately 10 000 GWh of electricity through renewable energies by 2013 (Edkins et. al. 2010; Eskom, 2015). This would require the installed capacity of wind power to be increased dramatically. The introduction of a Renewable Energy Feed-In Tariff (REFIT) in 2009 incentivised independent power producers to propose different renewable power projects throughout South Africa. Several of these proposals have caused concern for coastal communities. The majority of these concerns are environmental and location related.
Their concerns are that wind turbines may (Binopoulos & Haviaropoulos, 2010):
• increase road development in ecologically sensitive areas;
• detract from the visual appeal of an area, thus affecting real estate values, and impacting a region's culture and heritage;
• increase industrial noise in the area in which they are erected;
• negatively impact on fauna and flora, e.g., discourage bird migration into the area; and
• reduce other development opportunities, e.g. flight paths for airports.
The negative externalities of wind energy are of greatest concern to the communities in the vicinity of the wind farms - this is because wind turbines are site specific (Pasqualetti, 2011). These communities may also derive benefits from wind energy in the form of employment creation, increased electricity supply and increased tourism to the area. The communities that are located nearest to big industry developments (factories, power stations etc.) are characterised as poor or low income or underprivileged (Siegfried, 2014; PRB, 1998). Such locations may be chosen by pure coincidence. Or, it may be that these communities tend to underestimate the negative environmental costs related to these projects, relative to the new jobs prospect benefit claimed for such developments, thus more easily enabling development in these areas than in more well-to-do areas. Whatever, the case, the preferences of low income residents and how their happiness is influenced by various features of wind farm construction near their places of residence clearly matter. For this reason, this paper has selected to focus attention on this issue.
A number of studies have been conducted to assess the positive and negative environmental and social impacts that arise from the construction of wind farms (Wolsink, 2007; Pasqualetti, 2011; Slattery, Johnson, Swofford & Pasqualetti, 2012). These studies highlight the issues pertaining to wind farms through analysis of public opposition with Pasqueletti (2005) indicating that there are five key issues (immobility, immutability, solidarity, imposition and place). Krohn and Damborg (1999) and Slattery et al. (2012) are in agreement that proponents of wind energy focus on the benefits as opposed to opponents that share a negative attitude towards the aspects of wind energy, with the overarching view that public opinion on the issues is not straightforward and is complex in nature. A number of studies have also attempted to quantify the effects of the erection of wind turbines in specific locations (Ek, 2002; Krueger, 2007; Ladenberg & Dubgaard, 2007; Hanley et al., 2001; Alfarez-Farizo & Hanley, 2002).
The way in which these studies compare the costs and benefits of wind turbine erection in certain locations is through an analysis of the trade-offs residents in the area of the prospective wind farms would be prepared to make in their assessment of various potential impacts. A methodology for estimating these trade-offs is the choice experiment variant of the Choice Modelling Technique (Hensher et al., 2005). This paper aims to estimate some of these trade-offs by offering an analysis of a survey on the different aspects of wind energy developments conducted with underprivileged residents of the Kouga Local Municipality.
2. A proposal to harness wind energy in the Kouga Municipality
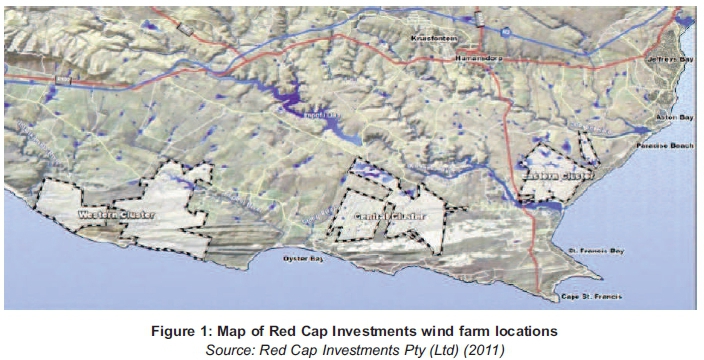
The Eastern Cape Province has attracted a number of proposals for the construction of wind turbine farms; one of which is by a company called Red Cap Investments to build a 121 wind turbine farm in the Kouga Local Municipality. The generating capacity of this wind farm is proposed to be approximately 300 MW, enough to power approximately 54 200 households with electricity (Red Cap Investments, 2011).1 The wind farm will span over three locations; the 'Eastern Cluster', located near Aston Bay and Paradise Beach, the 'Central Cluster', located near St. Francis Bay and the 'Western Cluster', located near Oyster Bay (Red Cap Investments, 2011 - see Figure 1 for map showing location).
The areas that will be most affected by the wind farm development are Paradise Beach, Oyster Bay, Umzamozethu, St. Francis Bay, Port St. Francis, Sea Vista, Kwanomzamo and to a lesser extent, Humansdorp, Jeffrey's Bay and Aston Bay.
Resistance to the erection of the turbines at certain locations has come from the better-off residents and businesses in the area (Meeting with St Francis Bay Residents Association, 2012). Many of the opponents to the wind turbine erections in the Kouga municipality support the drive for cleaner energy but they are unhappy at the prospect of wind farms dominating the area surrounding them (this is characterised as the NIMBY syndrome) (Pasqualetti, 2011).
3. Background
Local critics have asserted that the wind farm development in the Kouga Local Municipality will negatively impact on the visual attractiveness of the land (landscape character), abundance of bird life, employment and in some cases property values in the area (St Francis Bay Residents Association, 2010). These impacts are typically cited as relevant in environmental impact assessments (EIA) of wind farms and clearly are important elements to consider in any comprehensive assessment of the merits of building a wind farm (Dimitropoulos & Kontoleon, 2008). However, such factors are not of uniform importance across all communities. They differ according to social factors and general beliefs held in the community (Alvarez-Farizo & Hanley, 2002).
For a given community it is possible to assess this relative importance by means of discrete choice experiment (DCE) methodology (or conjoint analysis) (Hensher et al., 2005). It is a stated preference technique that employs questionnaires in which respondents are required to choose between hypothetical scenarios. Typically these scenarios include a monetary payment or acceptance of some form of compensation element. By this inclusion it is possible to estimate willingness to pay or acceptance of compensation for marginal changes to the given scenario. DCE is a method frequently used to determine the values of the environmental impacts that are based mainly on perception. The technique is useful in determining a scenarios impact on a population in the absence of market trades that would otherwise reveal the preferences of the population and therefore the impact.
3.1 Discrete choice experiments
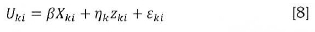
Choice experiments are based on two fundamental theories. The first is Lancaster's theory which states that a good is made up of several attributes and that the utility one derives from the usage or consumption of the good is determined by the attributes of the good and not from the consumption of the good as a whole (Lancaster, 1966). The second is based on random utility theory which proposes that not all utility derived from a good is observable to the analyst (Hensher, Rose & Greene, 2005). The combination of the two theories allows one to decompose utility of any good into two parts, an observable and an unobservable part:

where Ui represents the overall utility of a specific choice alternative i, VLrepresents the observable utility component and Etrepresents the unobservable or stochastic utility component (Hensher et. aL 2005).
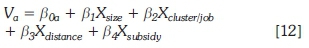
We can define the observable utility component in a linear form:
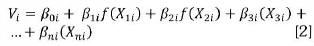
where is the parameter associated with X, and alternative i and /?0( is the alternative specific constant associated with the ilhalternative (Hensher et. al, 2005).
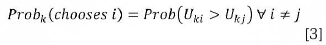
In order to model individuals choices with only the available or observed data an analyst has to determine the probabilities associated with each alternative (choice) presented to the individual. If the individual k faces j alternatives (where j = l,....,i) the individual will evaluate each alternative Ui,Uz,... ,Uj... ,Uj, and select the one that yields the highest utility. It is assumed that the probability of the individual selecting alternative i is equal to the probability that the utility of alternative i is greater than or equal to the utility of alternative j after comparing all alternatives in the choice set of j = 1,....,i,....,] alternatives (Hensher et. al, 2005);
or
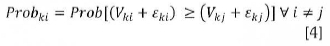
which, when rearranged to separate the unobserved components from the observed components, becomes:
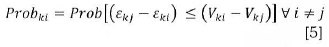
Assuming that the unobserved components are independent and identically distributed with a Gumbel distribution, allows for use to be made of the multinomial logit (MNL) model to determine the probability of choosing alternative i over alternative j (Hanley, Mourato & Wright, 2001):
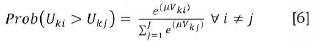
where μ is a scale parameter that confounds the direct determination of the parameters. This equation states that the probability of an individual k selecting alternative i over alternative j in the set of J alternatives is equal to the ratio of e to the exponent of the observed utility of i to e to the exponent of the sum of all the observed utility indices for all J alternatives (Bergmann, Hanley & Wright, 2006).
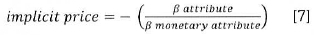
The trade-offs between the attributes that a respondent makes can be determined by the estimated coefficients of the attributes from Equation 2. This trade-off is estimated by maximising the log-likelihood function of Equation 6. A monetary attribute (usually a price or subsidy) combined with another attribute permits an estimate of willingness-to-pay (receive) of respondents for changes in the attribute levels to be calculated. This can be determined as shown by Ek (2002):
In order to incorporate taste variation among the respondents, a random parameters logit model (RPL) can be used for estimation. This model assumes that the preferences of the respondents are distributed by some known statistical distribution 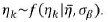 ' "The unobserved component of utility is
 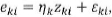 , where εki is assumed to be IID Type I extreme value, zkiis a vector of individual specific characteristics and Nk is a vector of random terms that varies across individuals k according to a known distribution
  (Glasgow, 2001). Estimation of the variance Gp provides an indication of heterogeneity in the model (Glasgow, 2001). With the new assumptions on the random component, the utility that individual k derives from choosing alternative i can be reformulated:
If there is preference homogeneity Nk= 0 and  the model is of the conditional logit specification. The random component of utility is assumed to be IID extreme value Type 1. The unconditional choice probability that decision maker k will choose alternative i becomes:

and the unconditional probability of respondent k choosing alternative i (Equation 3.9) can be reformulated as:
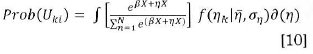
where X contains all attributes and socio-economic characteristics of the individuals. Standard maximum likelihood theory cannot be used to evaluate Equation lO as the integral does not have a closed form. For this reason, a simulated maximum likelihood technique must be used (Glasgow, 1999). The logit probability of each draw is calculated, a process repeated several times, and the mean of the draws taken as the unbiased estimator of the unconditional choice probability of respondent k choosing alternative i. The underlying utility function of respondent k is:
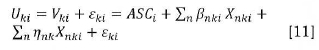
where the k is the respondent k(1, ....,K) and i is the alternative option selected (i = Option A, Option B, Option C...), n is the number of attributes (1, ...,N) and Xnkiis the vector of explanatory variables including the attributes of the alternatives, socio-economic characteristics of the respondents, decision context and choice task in choice set (Hensher et al., 2005). The non-random component of utility V is assumed to be a function of n choice-specific attributes Xnkiwith parameters βnkl. The coefficient vector Nnkvaries across the population with density  , where N is the vector of actual parameters of taste variation (Baskaran et al, 2009).
Using a RPL model is advantageous in that the model eliminates the bias due to heteroscedastic error terms (Glasgow, 1999). Additionally, the model allows for a statistical test of heterogeneity of respondent preferences for attributes by assessing the significance of the standard deviation of the r\nkestimates (Mazzanti, 2001). A significant standard deviation of the rjnkparameter would indicate heterogeneity in the preferences for an attribute (Mazzanti, 2001).
3.2 Compiling the questionnaire
An essential part of a DCE is creating an effective survey tool that can provide relevant information about the respondents and their preferences. The questionnaire is constructed in four phases. Firstly, the researcher creates a description of all possible characteristics that define the good to be analysed. Then a focus group is convened to ensure that only the relevant characteristics of the good are incorporated into the questionnaire. The third phase is a pilot study which is used to test the understanding and ease of the survey as well as identifying the appropriate bounds and levels for the cost attribute (Bateman and Willis, 1999). The last phase involves finalising the main questionnaire and administering the survey.
As this study was conducted in South Africa, a developing country, it is important to note that the distinct difference between this study and similar studies conducted in industrialised nations is that the target respondent group for this study were low-income residents. This group was selected for two main reasons. The first was that South Africa has significant inequalities in income distribution and an economy with dualistic features (Rosset, Patel & Courville, 2006). In a dual economy the behaviour of people varies according to the group to which they belong. The second is that low-income respondents are rarely included in studies of preference, so there is a gap in describing their preferences to the relevant literature in South Africa. A possible reason for this gap is a perception that these respondents are overwhelmingly influenced by price and job income prospects, rather than other factors, such as environmental impacts.
A focus group was conducted to address the main concerns of the wind farm development and compile a provisional list of important wind farm attributes for inclusion in the choice experiment. Consultation with international literature and discussions with informed residents resulted in the refinement to four key attributes, with three levels each (Table 1).
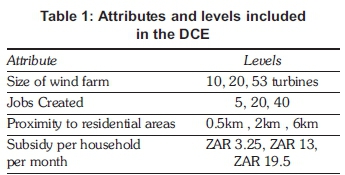
Two physical wind farm characteristics were included - one for the size of the wind farm in terms of number of turbines and proximity of the turbines to residential areas in kilometres. An attribute for employment possibilities from the wind farm development was highlighted as an important attribute for the low-income respondents and was also included in the DCE. The monetary attribute included was in the form of a subsidy, indicating willingness to accept (WTA) compensation as opposed to a price, indicating willingness to pay (WTP). A subsidy was chosen over a price for renewable energy because it was assumed that wind farm developments impose negative presence costs on the residents in the surrounding areas, and the residents surrounding the wind farm development were likely to have municipal property rights that would be infringed upon were the wind farm to be built in proximity to their residence (Dimitropoulos & Kontoleon, 2008). The subsidy took the form of providing free (basic) electricity (South African Government Information, 2011).
Once the attributes and the levels were defined, a main-effects-only, orthogonal and balanced design for the experiment was created in SPSS (version 12.01). As there were four attributes, each with three corresponding levels, a total of 34 = 81 possible treatment combinations of attribute levels were identified. A fractional factorial design was used to reduce this number to 27 treatment combinations. These combinations were randomly paired into 108 choice sets (Hensher et. al., 2005). A total of 27 unique questionnaires were created, each questionnaire containing four choice tasks. A status quo option was added to each choice task.
The body of the questionnaire had four sections. The first two sections elicited information about the respondents' understanding of wind energy. The third section contained the choice experiment. Four pages were shown to the respondents. Each page contained two choice cards and each attribute on the choice cards was represented by a picture. The respondents were asked to choose between option A, B and C, where option C was the status quo. The fourth section contained questions about the socioeconomic characteristics of the respondents. The questionnaire was simplified. Pictures were used to guide respondents with specific questions and to explain the differences between the levels of the attributes. The survey team was comprised of members with fluency in either English or Afrikaans or isiXhosa.
A pilot survey was conducted to test the comprehension and validity of the questionnaire. The pilot survey included 27 respondents.
3.3 Sample description
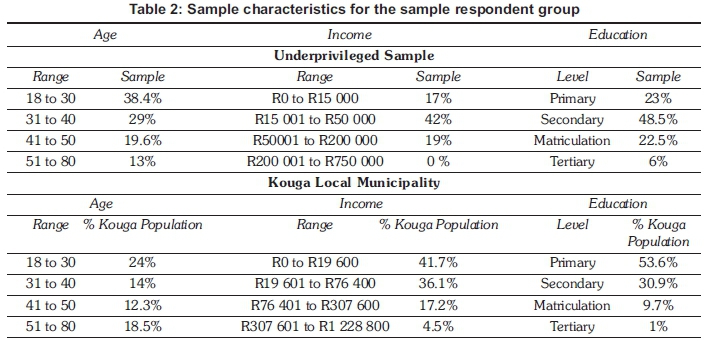
A stratified sample of randomly selected heads of households in the informal areas (townships) of Kwanomzamo, Sea Vista, Tokyo Sexwale, Ocean View and Umzamowethu was included in the study. A total of 270 personal interviews of low-income bracket households in the Kouga Local Municipality were conducted during a week in October 2012. The average household gross annual income for the sample was R30 800.89 or R2 600 per month.
Table 2 shows the distribution of age, income and education of the sample group. The majority of the respondents were aged between 18 and 30 years old and had a low level of education.
4. Results
The econometric software NLOGIT (version 10) was used to compute the relevant utilities of the alternatives. The data matrix was in the form (Bergmann et. al., 2006):
Option A:
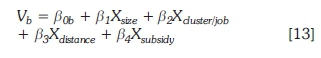
Option B:
Status quo option:
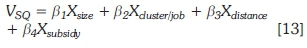
where V is the observed utility and p0is the alternative specific constants for options A and B. The status quo (non-option) level was used as the base level.
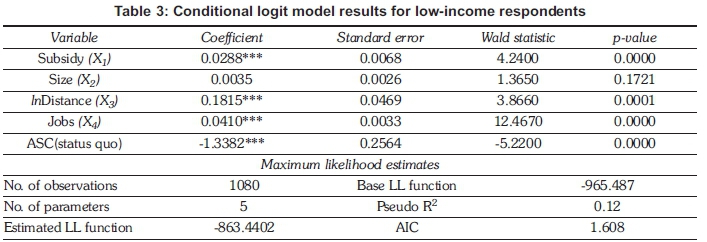
The estimation results of a conditional logit model are shown in Table 3. The influence of each attribute on the choice probabilities can be determined by the magnitude and sign of the coefficients (Krueger, 2007). The size attribute is insignificant at the 5% level, suggesting that the respondent group were indifferent in their preferences for wind farm size. The attributes for job and distance were positive and significant, indicating that the respondents derived greater utility from an increasing change in the level of these attributes, i.e. through creating more job opportunities and locating the wind farm further away from residential areas.
The pseudo R2 is 0.12, indicating a comparable OLS model fit of 30%. This level of fit is acceptable because this model only includes the attributes as parameter estimates and does not account for individual characteristics or external determinants of choice.
A test to determine whether a violation of the IIA assumption was conducted using the Hausman test. The status quo was omitted from the data and the restricted model estimated. The resulting test statistic was 16.09 and the p-value for this test was 0.0003, sufficient evidence to reject the null hypothesis that the IIA assumption is violated.
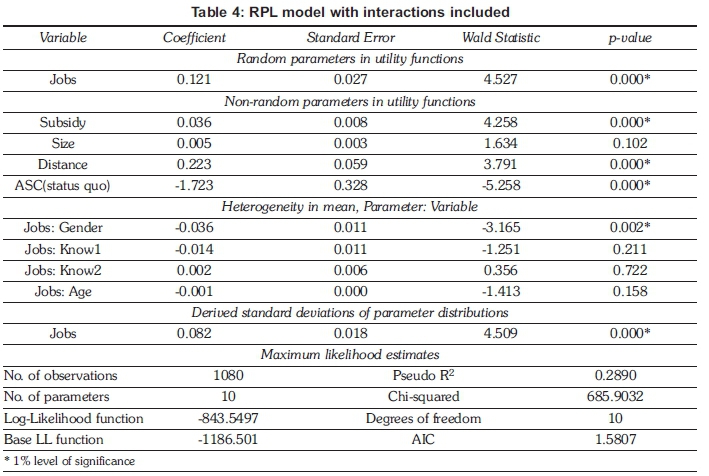
An RPL model was also fitted to the data to determine whether there was heterogeneity in the parameter estimates for the sampled population around the mean parameter estimate (Hensher et al., 2005). The dispersion of the job attribute, represented by the derived standard deviation of 0.089, was statistically significant, with a Wald statistic of 3.81 and a p-value of 0.0001. Different distributions were assigned to the job attribute to determine the best model fit (Hensher et al., 2005). The normal distribution provided the best model fit. All other attributes did not have a significant dispersion around the mean.
Interaction terms were included in the RPL model to explain the heterogeneity in the job attribute (the explanatory variables were interacted with the job attribute). Interaction terms for gender of the respondent (dummy coded, 0 for males, 1 for females), age of the respondent, and knowledge of wind energy (two different measures) were included in the model. The results of the RPL model with interaction terms included to explain the heterogeneity about the mean of the parameter estimate for the job attribute is shown in Table 4.
The likelihood ratio test value is 19.05, indicating that the model is a significant improvement on the first model. The overall model is statistically significant, as evidenced by the Chi-squared value of 685.9 with 10 degrees of freedom. The pseudo R2 value is 0.289, a good fit for this class of model (Hensher et al., 2005).
The differences in the marginal utilities held for the job attribute are in part explained by differences in respondent gender. The negative and statistically significant '' parameter indicates that male and female respondents chose different levels of the attribute for job prospects.
The WTA measure for the distance attribute was calculated differently to the job attribute. It was calculated for moving the wind farm from the baseline of 0.5 km to 2 km, 6 km and the status quo of 120 km away from the residential areas. The WTA measures were estimated using Equation 15 (Krueger, 2007).
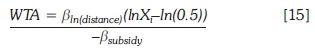
In Equation 15, the Xirepresents the distance i from the residential areas (2 km, 6 km and 120 km away) and βsubsidyrepresents the coefficient for the subsidy attribute.
The negative WTA compensation measures pertaining to the distance attribute indicate that the sampled respondents were willing to accept a reduction in subsidy the further away the wind farm was located from their residential areas. The sampled respondents were willing to accept a reduction in subsidy of ZAR 21.38 per month if the wind farm was moved from the base level of 0.5 km away to 2 kms away from the residential areas. Similarly, the negative WTA measure for the jobs attribute indicates that the sampled respondents were willing to accept a reduction in compensation for increases in the number of jobs created by the wind farm.
Moving the wind turbines so far away from residential areas that they are no longer visible, is not always the best practice or feasible. It may be a better alternative to compensate. For this purpose, it is useful to assess the marginal willingness to accept (MWTA) measures. MWTA compensation measures were calculated for the significant attributes, by taking the difference of the two WTA measures and dividing it by the difference in the corresponding change in distance (Krueger, 2007; Ladenburg and Dubgaard, 2007).
A reduction in MWTA compensation measures was higher for distances closer to the residential areas, indicating that the majority of the sampled respondents would derive social benefit from moving the wind turbines more than 0.5 kilometres away from residential areas. The MWTA compensation measures were consistent indicating that the sampled respondents derive the same amount of utility for each increase in the job prospects created by the wind farm.
As the parameter estimates for the distance attribute were also significant, WTA measures could also be calculated with respect to distance.
The underprivileged respondents were WTA a reduction in the subsidy each month of ZAR 14.25 per kilometre distance from the base-line distance of 0.5 km to 2 km away from the residential areas. The MWTA a reduction in subsidy each month drops to ZAR 4.23 per kilometre between 2 km and 6 km away from residential areas. This indicates that as the wind turbines are moved a considerable distance away from the residential areas, the perceived benefit is increased and therefore the residents are willing to accept a reduction in subsidy.
As the distance between the residential areas and the wind turbines increases, the sampled population is prepared to accept less and less of a reduction in compensation until the full subsidy value is accepted. The MWTA a reduction in subsidy is below one at a distance of 120 km away from residential areas. This rate of change indicates that for the underprivileged respondent group the benefits are minimal for locating the wind turbines at a distance greater than 120 km away. The greatest social benefit is derived for the initial movement of the turbines further than 0.5 km from residential areas.
5. Conclusions
The choice experiment methodology has been used extensively in marketing (conjoint analysis) and in valuing environmental resources that do not readily reflect in market values. Through the use of personal surveys, the residents of the Kouga Local Municipality were asked to make choices between several hypothetical wind energy scenarios defined by a selection of attributes at different levels. The selection of attributes and levels was based on the findings reported in similar international studies and through focus group sessions.
The magnitude, sign and significance of all the estimated coefficients of the attributes were similar for each of the models. The negative signs for the attributes of distance, jobs and size indicate that the respondents were WTP for increases in the attribute levels. The respondents preferred to have the wind farm located at least 2 km away from residential areas, have more wind turbines and more jobs created.
There was heteroscedasticity in preference for jobs among the underprivileged respondent group. This heteroscedasticity was explained by gender. The preference for the jobs attribute was similar for individuals of the same gender.
The number of new jobs created by the wind farm development was an important indicator of choice for the underprivileged respondent choices. This job creation potential needs further investigation as there may be job losses as well, caused by discouragement of affluent resident settlement in the area or lost recreational value.
Notes
1. An average household uses ± 1.1 MWh per month (Eskom, 2011) or 12.12 MWh per annum (In one year the Red Capp investments wind energy development will generate approximately 657 000 MWh (300MW x 24 x 0.25 x 365), which can supply approximately 54 200 households with electricity each month.
References
Alvarez-Farizo, B. and Hanley, N. (2002). USING conjoint analysis to quantify public preferences over the environmental impacts of wind farms. An example from Spain. Energy Policy 30:107-116. [ Links ]
Bateman and Willis (1999). Valuing Environmental Practices: Theory and Practice of the contingent valuation method in the US, EU and developing countries. Oxford University Press. [ Links ]
Baskaran, R., Cullen, R. & Wratten, S. (2009). Estimating the Value of Agricultural Ecosystem Service: A Case Study of New Zealand Pastoral Farming - A Choice Modelling approach. Australasian Journal of Environmental Management, 16: 103-112. [ Links ]
Bergmann, A., Hanley, N. & Wright, R. (2006). Valuing the attributes of renewable energy investments. Energy Policy 34:1004-1014. [ Links ]
Binopoulos & Haviaropoulos. Environmental Impacts of Wind Farms: Myth and Reality. Centre for Renewable Energy Sources (CRES) (2010). [ Links ] [Online] Available at:< www.cres.gr/kape/.../CRESTRAN-SWINDENVIRONMENT.doc> [Accessed 24 June 2011].
DEA, Department of Environmental Affairs (2011). South Africa's Second National Communication under the United Nations Framework Convention on Climate Change. [ Links ] [Online] Available at: http://unfccc.int/resource/docs/natc/snc_south_africa_.pdf [Accessed: 6 June 2015].
DME, Department of Minerals and Energy (2003). White Paper on the Renewable Energy Policy of the Republic of South Africa. South Africa. Government Gazette. Vol. 466, No. 26169. [ Links ]
Dimitropoulos, A. & Kontoleon, A. (2008). Assessing the Determinants of Local Acceptability of Wind Farm Investment: A Choice Experiment in the Greek Aegean Islands. Cambridge Department of Land Economy Discussion Paper Series, Number 35.2008. [ Links ]
EDF. South Africa: The World's carbon markets: A case study guide to emissions trading (2014). [ Links ] [Online] Available at: http://www.ieta.org/assets/EDFCaseStudyMarch2014/south%20africa%20case%20study%20march%202014.pdf [Accessed: 6 June 2015].
Edkins, M., Marquard, A. & Winkler, H. (2010). South Africa's renewable energy policy roadmaps. United Nations Environment Programme Research Project. UCT. Cape Town. [ Links ]
Ek, K. (2002). Valuing the environmental impacts of wind power: a choice experiment approach. Licentiate Thesis, Luella University of Technology, Sweden. [ Links ] [Online] Available at: <http://epubl.luth.se/1402-1757/2002/40/index-en.html> [Accessed 22 February 2011].
Eskom (2011). Fact Sheet {online}. Available at: <http://www.eskom.co.za/c/25/facts-figures/> [ Links ] [Accessed 14 October 2011].
Gets, A. & Mlanga, R. (2013). Powering the Future: Renewable energy roll-out in South Africa. Greenpeace. [ Links ]
Glasgow, G. A. (1999). Random Parameters Logit Model for Estimating the Impact of Issues on Vote Choice. California: University of California. [ Links ]
Glasgow, G. (2001). Heterogeneity in Discrete Choice Models. University of California. [ Links ] [Online]. Available: http://polmeth.wustl.edu/media/Paper/glasg01b.pdf [Accessed 5/03/2012].
Hanley, N., Mourato, S. & Wright, R. (2001). Valuing the environmental and employment impacts of renewable energy investment in Scotland. Scotecon, Stirling. [ Links ]
Hensher, D. A., Rose, J. M. & Greene, W. H. (2005). Applied Choice Analysis: A primer, Cambridge, UK, Cambridge University Press. [ Links ]
Krohn, S. & Damborg, S. (1999). On public attitudes towards wind power. Renewable Energy, 16:954-960. [ Links ]
Krueger, A. (2007). Valuing Public Preferences for offshore wind power: A choice experiment approach. Ph.D. University of Delaware. [ Links ]
Ladenberg, J. & Dubgaard, A. (2007). Willingness to Pay for Reduced Visual Disamenities from Offshore Wind Farms in Denmark. Energy Policy, 35: 4059-4071. [ Links ]
Lancaster , K. A (1966). New approach to consumer theory. Journal of Political Economy 74, 132-157. [ Links ]
Mazzanti, M. (2001). Discrete Choice Models and Valuation Experiments. An Application to Cultural Heritage. Siep: University of Rome. [ Links ]
Pasqualetti, M.J. (2011). Opposing Wind Energy Landscapes: A Search for a Common Cause. Annals of the Association of American Geographers. PRB, Population Reference Bureau (1998). US in the World. [ Links ] [Online] Available at: http://www.prb.org/pdf/california_southafrica.pdf.
Red Cap Investments (2011). Environmental Impact Assessment for a Wind Farm in the Kouga Local Municipality. Revised Draft Environmental Impact Report. [ Links ] [Online] Available at: <http://projects.gibb.co.za/en-za/projects/kougawind-farmfinaleir/kougafinaleir.aspx> [Accessed: 20 June 2011].
Rosset, P. Patel, R. & Courville, M. (2006). Promised Land: competing visions of agrarian reform. Land Research Action Network. Food First Books. 63. [ Links ]
Siegfried, K. (2014). South Africa's coal fired power stations carry heavy health costs. The Guardian. [ Links ] [Online] Available at: http://www.theguardian.com/global-development/2014/sep/09/south-africas-coal-fired-power-stations-carry-heavy-health-costs.
SAinfo Reporter (2008). SAs Energy Suppy. [ Links ] [online] Available at: http://www.southafrica.info/business/economy/infra-structure/energy.htm [Accessed 22 February 2011].
Slattery, M.C., Johnson, B.L., Swofford, J.A. & Pasqualetti, M.J. The predominance of economic development in the support for large-scale wind farms in the U.S. Great Plains. [ Links ]
South African Government Information. Government Services (2011). [ Links ] [Online] Available at: <http://www.info.gov.za/faq/services.htm#munici-pal> [Accessed: 5 July 2011].
St Francis Bay Residents Association (2010). The proposed Kouga Wind Farm. [ Links ] [Online] Available at: <http://www.sfbresidents.org/news/2010/Windfarm-Feb.html> [Accessed: 20 June 2011].
UNEP (2009). Greenhouse gas emission baselines and reduction potentials from buildings in South Africa. [ Links ] [Online] Available at: http://www.gsb.uct.ac.za/files/PPIAFReport.pdf [Accessed 6 June 2015].
Wolsink, M. (2007). Planning of renewables schemes: Deliberative and fair decision-making on landscape issues instead of reproachful accusations of non-cooperation. Energy Policy 35:2692-2704. [ Links ]
WWEA. World Wind Energy Report 2010. (2011). Germany: World Wind Energy Association. [ Links ]
Received 23 May 2014
Revised 30 July 2015

