


Services on Demand
Article
 English (pdf)
 Article in xml format
 Article references
Indicators

Related links
-
 Cited by Google
 -
 Similars in Google
Share

 Permalink
Journal of Energy in Southern Africa
On-line version ISSN 2413-3051
Print version ISSN 1021-447X
J. energy South. Afr. vol.26 n.2 Cape Town May. 2015
Coherence and time-frequency analysis of impulse voltage and current measurements
Jelena DikunI; Emel OnalII
IElectrical Engineering Department, Klaipeda University, Klaipeda, Lithuania
IIElectrical Engineering Department, Istanbul Technical University, Maslak, Istanbul, Turkey
ABSTRACT
The aim of this paper is to point out the advantages of the use of the time-frequency analysis in the digital processing of waveforms recorded in high voltage impulse tests. Impulse voltage tests are essential to inspect and test insulation integrity of high voltage apparatus. On the other hand, generated impulse currents are used for different test applications such as investigation of high current effects, electromagnetic interference (EMI) testing, etc. Obtained voltage and current waveforms usually have some sort of interferences originated from the different sources. These interferences have to be removed from the original impulse data in order to evaluate the waveform characteristics precisely. When the interference level is high enough, it might not be possible to distinguish signal parameters from the recorded data. Conventional filtering methods cannot be useful for some interference like white noise. In that case, time-frequency filtering methods might be necessary. In this study, the wavelet analysis, which is a powerful time-frequency signal processing tool, is used to recognize the noise of impulse current and voltage data. Thus, the noise sources can be determined by short time Fourier Transform, and a coherence approach is used to determine the bandwidth of noises.
Keywords: impulse voltage, impulse current, overshoot waveform, short-time fourier transform
1. Introduction
An impulse voltage test on high-voltage equipment is a useful application to evaluate the insulation integrity and to identify the ability to withstand over-voltages encountered during operation. The measured waveforms in practice may contain oscillations and overshoots due to the inclusion of different noise sources. One of the major challenges of impulse voltage and current measurements is the existence of the noise that affects the precise identification of impulse parameters. The measurement of lightning impulses with superimposed overshoot or oscillation has been the subject of extensive studies in the last few years in light of results of an important study (IEC 60060-1, 1995; IEEE Standard 4, 1995) with regard to the relationship of the effective peak voltage and the overshoot frequency.
The main findings of the study are the test voltage equation for the determination of the effective peak voltage. The evaluation of the overshoot and the test voltage from an output waveform is performed with the residual filtering method. Basically, the evaluation of the high voltage impulse signals consists of the evaluation of the peak amplitude (Umax) and three time parameters (T1: Front time, T2: Time to half value for full impulse and Tc: Cutoff time). When the level of disturbance in signals is low, computation of these parameters is also quite simple, but when the disturbance level rises, they become much more difficult.
In terms of frequency contents, there are three kinds of disturbance: Oscillation on the test circuit, electromagnetic disturbance and digitizer noise. The results show that those three disturbance types have different frequency characteristics (Angrisani, et al., 1998). The oscillations due to the test circuit have a frequency above 500kHz, the electromagnetic disturbance usually is characterized by frequencies in the range of several hundreds of kilo-hertz (more than 500kHz) up to a few megahertz (less than 10MHz) and the digitizer noise that comes from digitizers used in high voltage test halls, and these frequencies are clearly above 10MHz.
Taking this information into account, the standard states that the evaluation of the high voltage impulse parameters, must be based on the low voltage part of the wave that is really applied to the equipment under test. This means that only the oscillations due to the presence of capacities in the test circuit can be considered. So, all of the disturbances having frequencies above 500 kHz, can be removed from the low voltage part before evaluation of the impulse parameters. For this reason, it is very important to know the sources and eliminate the noises (Garnacho et al., 1997).
In this study, short time Fourier transform is applied to voltage and current measurements in order to define the noise effects on the signals and the coherence relationship between the voltage and current signals. They are used to determine frequencies of low pass filter characteristics. Hence, the frequency range of a band pass filter is found by means of a threshold among the high correlated frequencies components.
2. Time-frequency analysis
In this section, a mathematical background to be used in this application is focused on the Short-Time Fourier Transform (STFT) techniques and coherence analysis, which is presented as cross spectral property between two signals (Harris, 1978).
2.1. Short-time Fourier Transform
The signal to be transformed is multiplied by a window function which is defined for a short time period. Then it is represented by the integral form of the classical Fourier transform by sliding the window function along the time axis. In the application, there are a large number of so many window types, however, one of the most popular one is 'Hanning Type windowing'. The shape of this window function is shown as a Gaussian function at around the zero value. In this manner, Short-Time Fourier Transform of a given signal x(t) is described as below:
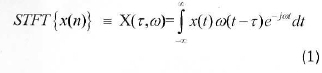
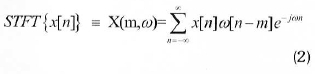
For discrete case, STFT of discrete time domain signal x[n] is given by the following equality
2.2. Coherence and threshold value
The coherence between two time domain signals x(t) and y{t) is defined as similarity degree in the frequency domain. Hence it can be shown as a real-valued function as below:
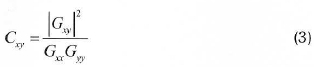
Where, GXy is the cross-spectral density between χ and y. And also, Gxx and Gyyare the auto-spectral densities of χ and y respectively. The magnitude of the spectral density is denoted as | G |. The numerical values of the coherence will always take place between zero and unit. Namely it is given by
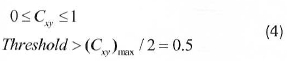
An accepted threshold can be considered as a value greater than 0.5 in coherence variation. It can be chosen as 0.6.
3. Measurement system and data
The lightning impulse voltages used in this study are produced by a 1 MV, 50 kJ, Marx type impulse generator. The voltages are measured by means of a capacitive divider and a HIAS 743 digital oscilloscope with 12 bit real vertical resolution at 120 Mega sample / sec. All measurements of the experimental study are given in IEC standard. This paper is a study of the breakdown strength signal analysis of Sulphur hexafluoride (SF6) with negative impulse voltage. Due to its exceptional insulating and arc-extinguishing properties, Sulphur hexafluoride gas has been widely employed as insulation of high voltage power apparatus. The experimental set-up is seen at Figure 1.
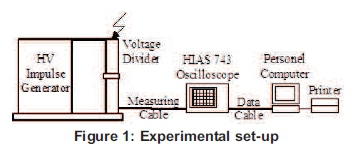
Signals are carried using a sphere-plane electrode with a sphere diameter of 10 mm and electrode gap spacing of 5 cm. The sphere electrode is connected to high voltage while the plane electrode is earthed. Electrodes are mounted in a pressure vessel of 120 mm diameter and 600 mm length.
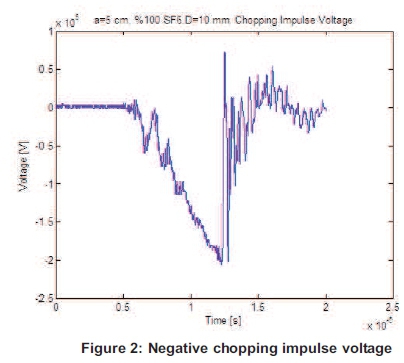
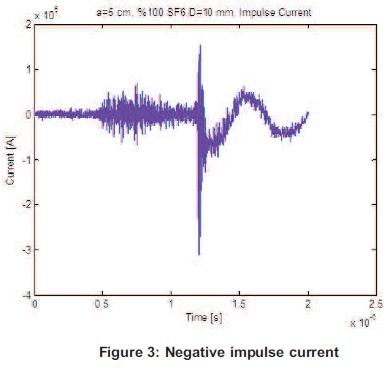
Figures 2 and 3 show the front chopping impulse voltage and impulse current signals, respectively. It is difficult to establish the traceability of the test results and compare them with those of other high-voltage (HV) testing laboratories. In view of such information, the standard states that the evaluation of the HV impulse parameters must be based on the lightning high voltage image of the wave that was actually applied to the equipment under test. This means that only the oscillations due to the presence of capacitances in the test circuit must be considered. All of the disturbances with frequencies above 500 kHz must be removed from the lightning voltage waveform prior to the evaluation of the impulse parameters (Simon et al., 2006; Li and Rungis, 2003; Gamacho et al,, 2002; Lewin et al, 2008).
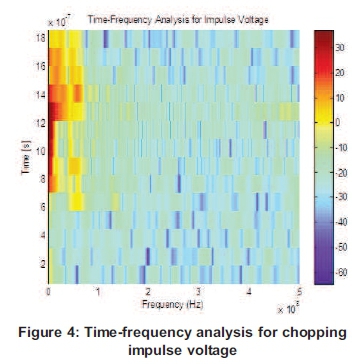
The overshoot can be eliminated or reduced by improving the electric circuit. As seen in Figure 4, the spectrum of the waveform and the expected frequency content of the disturbances are used to determine whether a given frequency component corresponds to a disturbance that should be removed or not. For this reason, the test circuit includes components that may have a large capacitance. Due to the large dimensions of the equipment under test and the components of the test circuit, there is also a significant amount of stray capacitance between components and the test site. The closed loop formed by the test circuit also includes some inductances. Many researchers focused on the disturbances caused by the combination of a high rate of rise of impulses in the stray capacitances and inductances that are present in the circuit. The measuring circuit, as well as the high-voltage generator, should produce or cause oscillations and overshoots as few as possible. Oscillations can only be accepted if it is certain that they are produced by the device under test in connection with the high-voltage generator. In some cases, oscillations come from a generator and measuring device. It is necessary to ensure that they are generated in the measuring system, e.g. in the low voltage arm of the divider.
Generator and measurement circuits are located on high voltage and low voltage area of the laboratory, respectively. Chopped impulse voltage is obtained by adjusting the spherical gaps to spark-over at desired time of the signal. Because the chopping time is dependent on the spherical electrode spacing and the amplitude of voltage, it is necessary to reduce the electrode gap to obtain a wave chopped near to the front, as a result, the ion-ization causing breakdown and the formation of space charges occurs in a shorter time. Electromagnetic interferences radiated from a high voltage impulse generator are mainly caused by the discharges occurring in air gaps, which are used to switching on the impulse generator (Onal et al., 2008; Rungis and Li, 1999; Gockenbach et al., 2001; Altay and. Kalenderli, 2012).
The effect of these interferences with increases of the applied voltage decreases with the secession of the generator. To reduce the interference to a satisfactory level, shielding shall be provided for both to the spark gaps and the electronic circuit. The removal of noise with low frequency is difficult comparing with the removal of noise with high frequency. Removal of high frequency noise from data is simple.
4. Time-frequency and coherence analysis
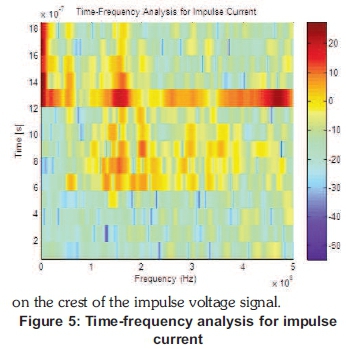
For this study, sampling frequency is 109 Hz. As shown in Figure 4, the maximum frequencies are between 0.8 and 1.4 μs. This time range refers to the front of chopping signal. It starts corona discharge in this area before breakdown. For this signal, the characteristic values taken from oscilloscope according to IEC, max voltage are Up =164.1 kV, T1=0.468 μs.
For impulse current as seen in Figure 5, there is a breakdown approximately at 1.2 μs. This time is nominal value for standard impulse voltage. There is a common frequency area at 1.2 μs up to 500 MHz. This is a breakdown process. As seen in the Figure 4, maximum frequencies are nearly 10 MHz
In this study, coherence analysis is applied to extract the common properties between impulse voltage and current measurements. In this way, highly correlated frequency components between (50-150 MHz) can be determined as frequency characteristics of the corona phenomena comparing with threshold of 0.6.
5. Conclusions and discussions
The electromagnetic interferences in a circuit and the digital recorder quantization noise have been ascertained to the basic causes for error. Stray inductances formed in connection points can cause electromagnetic interference within the frequency of 50 MHz.
The main problem in an impulse generator circuit is the undesired inductive effect that causes ripples in the output waveform and forms an obstacle for a shorter duration of the pulse. This effect is mainly reduced by making relatively short connections between the components and using bus-bars as connection units, rather than wiring. For our electrode system, the peak of frequency of distortions which has above 10 MHz belongs to the digitizers. However as in many practical situations, a transient electromagnetic interference can enter the measuring circuit at the divider low-voltage arm, or penetrate through the coaxial cable sheath and the digital recorder enclosure.
Ideally, all these devices shall be protected by a perfect electromagnetic shield, but in reality shielding, they may effectively mask the measured signal spectrum at a much lower frequency than the limit imposed by the digitizer quantization noise. There are different sources of high frequency interferences on an impulse waveform: stray capacitances and inductances of elements in the generating and measuring circuits; circulation currents or induced currents and voltages on the measuring cable shield or all of the connection as ground and high voltage connections; signals penetrating into the recording instrument via power supply or coming from electromagnetic radiation can cause high frequency undesired signals.
High voltage switching operations and discharge phenomena in the gas gap cause electromagnetic transients. These transients radiate high electromagnetic fields of high frequency and cause interference to sensitive electronic equipment as oscilloscope, voltmeter and PC. Interference of the switch increases with the applied voltage to gap space and decreases with the distance from the source (Custodio et al., 2000). As shown in Figure 6, the peaks of between 50 and 150 MHz are common for voltage and current. Moreover, from the beginning up to breakdown, there are signals having the frequency range of 100-200 MHz. These signals can be the partial discharge phenomena. The reason for these situations can be disturbing depending on electrode system. This caused more distortion peaks due to the corona phenomena before the breakdown. It can be said that corona begins around the sphere electrode. Removing high frequency oscillations is also necessary for detecting overshoot and determining its amplitude and duration. For example, it can be used as digital filter to eliminate between around 50 and 150 MHz distortions for our system. The duration of chopping time is important in terms of the verification of the chopped impulse voltage on high-voltage power transformers. In practical applications, this duration must be known to simulate the impulse spark over between arc horns and it should be correctly adjusted to the range of 2-6 □s. Having these features can be useful both in terms of the calculation of the circuit parameters and the filter design.
Acknowledgment
The authors show their gratitude to Prof. Dr. Serhat Seker from Istanbul Technical University in Turkey, and Prof. Stefan Tenbohlen from IEH Stuttgart University in Germany.
References
Angrisani L., Daponte, P, Dias, C., and Vale A., (1998). Advanced Processing Techniques of High- Voltage Impulse Test Signals' IEEE Trans. on Instrumentation and Measurement, Vol. 47, No. 2, April 1998. [ Links ]
Altay, O. and Kalenderli O. (2012). Interference Removal on Impulse Voltage and current measurements with wavelet analysis - 2012 International Conference on High Voltage Engineering and Application, Shanghai, China, September, 17-20, 2012. [ Links ]
Custodio D. and Almeida do Vale A. (2000). High Performance Digital Processing of High Voltage Impulses based on Time-Frequency Analysis,' 10th Mediterranean Electrotechnical Conference Melecon, pp. 766-769, Vol. 2. [ Links ]
Garnacho, F et al. Evaluation Procedures for Lightning Impulse Parameters in case of Waveforms with Oscillations and/or Overshoot' IEEE Trans. On Power Delivery, Vol. 12, No. 2, pp. 640 - 649, 1997. [ Links ]
Gamacho, F et al. (2002). Evaluation of lightning impulse voltages based on experimental results, Electra, No. 204, pp. 31 - 38. [ Links ]
Gockenbach E., Hackemack K., and .Werle P (2011). A contribution to the evaluation of lightning impulses with oscillations or overshoot near the peak - Intern. Symposium on High Voltage Engineering, Bangalore, Paper No. 7-3. [ Links ]
Harris F (1978). On the Use of Windows for the Harmonic Analysis with the Dicrete Fourier Transform in Proceedings of the IEEE, Vol. 66, No.1, pp. 51-83, January 1978. [ Links ]
IEC 60060-1 (1989). High Voltage Test Techniques - Part 1: General Definitions and Test requirements, Int. Electrotech. Comm. [ Links ]
IEEE Standard 4 (1995). Standard Techniques for High Voltage Testing. [ Links ]
Lewin PL., Tran T.N., Swaffield D.J., and. Hällström J.K. (2008). Zero-Phase Filtering for Lightning Impulse Evaluation: A k-factor Filter for the Revision of IEC60060-1 and -2 - IEEE Trans. on Power Delivery, Vol. 23, No. 1, January 2008. [ Links ]
Li Y. and Rungis J. (2003). Evaluation of parameters of lightning impulses with overshoot,' 13th Int. Symp. High Voltage Engineering, Delft, Netherlands, Aug. 25 - 29, 2003. [ Links ]
Onal, E., Kalenderli O., and .Seker S. (2008). , Multi-Resolution Wavelet Analysis for Chopped Impulse Voltage Measurements and Feature Extraction -IEEE Trans on Dielectrics and Insulations, July 2008. [ Links ]
Rungis J. and Li Y. (1999). Precision digital filters for high voltage impulse measurement systems, IEEE Trans. Power Del., Vol. 14, No. 4, pp. 1213-1220, October 1999. [ Links ]
Simon P Garnacho F, Berlijn S.M., and Gockenbach E. (2006). Determining the test voltage factor function for the evaluation of lightning impulses with oscillations and/or an overshoot, IEEE Trans. Power Del., Vol. 21, No. 2, pp. 560-566, April, 2006. [ Links ]
Received 11 May 2013
Revised 26 March 2015

