


Servicios Personalizados
Articulo
 Inglés (pdf)
 Articulo en XML
 Referencias del artículo
Indicadores

Links relacionados
-
 Citado por Google
 -
 Similares en Google
Compartir

 Permalink
Journal of Energy in Southern Africa
versión On-line ISSN 2413-3051
versión impresa ISSN 1021-447X
J. energy South. Afr. vol.26 no.1 Cape Town feb. 2015
Theoretical investigation of a combined Kalina and vapour-absorption cycle
Mohammad TariqI; Vinod Kumar NemaII
IDepartment of Mechanical Engineering, Shepherd School of Engineering & Technology, SHIATS-DU, Allahabad, U.P. India
IIDepartment of Mechanical Engineering, Motilal Nehru National Institute of Technology, Allahabad, UP, India
ABSTRACT
A program has been developed to calculate enthalpies at the salient points (later referred to as stations) of a combined power and cooling cycle provided pressure, temperature, mixture concentration and condition are known at these points. The ammonia-water mixture, which is taken as the working fluid, may be at one of the following seven conditions namely, superheated vapour mixture, mixture of superheated component of ammonia and pseudo vapour component of water, saturated vapour mixture, wet vapour mixture, saturated liquid mixture, mixture of subcooled water and pseudo liquid ammonia and subcooled mixture of sub-cooled components of ammonia and water. The mixture boiling-point temperature and dew-point temperature, needed to establish the condition of the working fluid, are functions of absolute pressure, critical pressure and critical temperature of the mixture; later two depend on the mixture concentration and the corresponding critical values of water at the given station. Using typical values of the variables as listed above, enthalpies at all stations are predicted. The predicted enthalpies are close (within 3%) to those available in the literature except at two stations where the mixture was weak in ammonia and its temperature was either in the near vicinity of the mixture boiling-point temperature or below the saturation temperature of pure ammonia at the concerned pressure. Using the predicted values of enthalpies, thermal efficiency of the combined power and cooling cycle has been calculated.
Keywords: absorption, ammonia-water mixture, cogeneration cycle, combined power and cooling cycle, energy, refrigeration, Kalina cycle.
1. Introduction
Many combined cycles have been proposed as an alternative to the conventional power cycles for improving the overall energy conversion efficiency. A typical combined cycle consists of a gas turbine operating on a Brayton cycle as a topping cycle. The hot exhaust gases from this cycle provide the energy for the bottoming steam Rankine cycle. The efficiency of the combined cycle is better than the efficiency of each cycle operating alone (Feng and Goswami, 1999). Another method of improving the performance of a thermal power plant is to use a cogeneration cycle which provides heating and power of both or a hybrid thermal power and cooling cycle which combines the Rankine cycle and absorption refrigeration cycle with power generation as primary goal in either case.
The research team of Kalina is recognized for introducing an ammonia-water mixture as the working fluid in power cycles [Kalina, 1984; Kalina and Tribus, 1990; Kalina et al., 1986]. An absorption type power cycle using a mixture of ammonia and water as the working fluid was studied in the early fifties (Maloney and Robertson, 1953). Washam et al. (1994) suggested solar energy as input in the combined cycle to make it economically viable.
Park and Sonntag (1996) and Ibrahim and Klein (1993) analysed the Kalina cycle. Their studies show that the Kalina cycle was advantageous over the conventional Rankine cycle under certain conditions. Although the use of mixed working fluid, such as ammonia-water, provides a big advantage in utilizing a sensible heat source in the boiler, it presents a disadvantage in the condenser. The disadvantage can be overcome if a normal condensation process is replaced by an absorption condensation process (Park and Sonntag, 1996; Zeigler and Trepp, 1984).
The combined cooling and power cycle with power as the primary goal takes advantage of low boiling temperature of ammonia so that its vapour can be expanded to a very low temperature while it is in a vapour state or a high quality two- phase state. This cycle is ideally suited for solar thermal power using low cost concentrating solar collectors with the potential of reducing the capital cost of a solar thermal power plant. This cycle can also be used as a bottoming cycle for any thermal power plant. A thermodynamic cycle proposed by Goswami and Feng (1999) combined the advantages of mixed working fluid and absorption condensation to improve the efficiency of the thermal cycle. Since the proposed cycle uses almost pure ammonia as the working fluid in the turbine, it is expanded to a temperature much below the ambient temperature. The net effects are the production of both the refrigeration effect and power output and the reduction of the effective sink temperature for the cycle.
1.1 Thermodynamic analysis of the combined cycle
The following assumptions have been made while determining enthalpies at various temperature conditions:
- The water and ammonia components form a single system and no chemical reaction takes place.
- In case of vapour mixture, each gas behaves as an ideal gas.
- In the liquid phase, when the mixture temperature is either equal to or less than the boiling point temperature, the enthalpy is calculated using the mixture properties suitable to the ideal solution and then the isothermal departure of the liquid mixture from the ideal solution properties added to it.
There are certain combinations of pressure and temperature at which the mixture is not in equilibrium condition. This occurs when at the given pressure, the mixture temperature lies between the dew point temperature and the saturated temperature of pure water (Tsat2). In this case, ammonia is in the superheated vapour form and water exists in the metastable vapour form. Another situation occurs when at the given pressure, the temperature lies between the boiling point and the saturation temperature of pure ammonia (Tsat1). Here ammonia is assumed to be in the metastable liquid state.
During the whole process of the combined cycle, the mixture may adopt any one of the following states, as shown in Figure 1, which will depend on its temperature relative to two temperatures namely, boiling point and dew point. Boiling point temperature, Tb, is the temperature at which the liquid of known composition and pressure begins to boil and dew point temperature, Td, is the temperature at which a vapour of known composition and pressure begins to condense. The method used to determine them (Feng and Goswami, 1999) is given in the Appendix A.
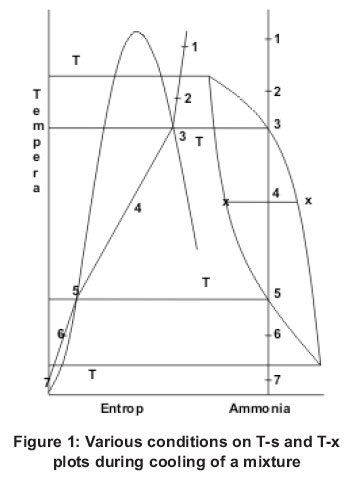
Consider gradual cooling of a mixture, of a given pressure and concentration, from temperature greater than pure water saturation temperature (Tsat2) as shown in Figure 1. It passes through various states (numbered 1 to 7) which are detailed below. Expressions for the related mixture enthalpy in kJ/kg, with suffix 1 for ammonia and 2 for water, have also been provided.
1.1.1 State 1: (T ≥ Tsat2)
In this condition the temperature is above the saturation temperature of water. The mixture then is the superheated mixture of a superheated component of ammonia and a superheated component of water. Its enthalpy is calculated using equations (Siddiqui, 1999) given below.
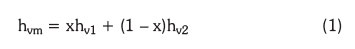
Where x is the mass fraction of ammonia in the mixture and and , the enthalpies of ammonia vapour and water vapour, respectively, are given by
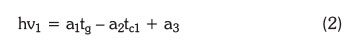
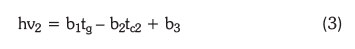
where tg is the temperature of the mixture in 0C and tc the critical temperature of respective component in 0C. Constants in eqns. (2) and (3) are given below.
a1 = 2.3678756;
a2 = 0.72779902;
a3=137908894;
b1 = 1.925;
b2=0.126;
b3=2500.0;
1.1.2 State 2: (Tsat2 > T > Td )
he mixture is considered as the superheated mixture of superheated component ammonia and pseudo vapour component water. Enthalpy is found (Siddiqui, 1999) by linear interpolation with respect to temperature of superheated enthalpy at Tsat2 and saturated vapour enthalpy at Td,
1.1.3 State 3: (T = Td)
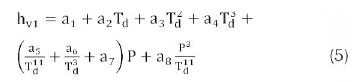
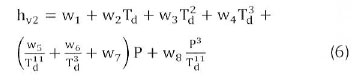
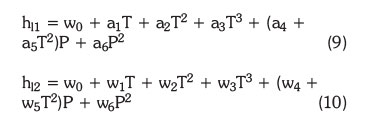
In this condition, the temperature is equal to the dew point temperature of the mixture. For this condition, the enthalpy is calculated using equation (Siddiqui, 1999) given below.
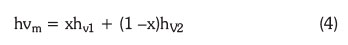
where vapour enthalpies hv1 and hv2 are given by following equations.
and the constants are
a1 = 780.3751592,
a2 = 1.793463444,
a3 = 2.438453,
a4 = 5.887041e-1,
a5 = -3.894205e+4,
a6 = -1.618514e+2,
a7 = -5.123027e-2,
a8 = -5.946927e+2,
w1 = 1995.675063,
w2 = 1.854864237,
w3 = -10194269e-4,
w4 = 3.002761e-7,
w5 = -2.566671e+28,
w6 = -5.850564e+8,
w7 = 90858336e-2,
w8 = 0.0,
where Td is in K and P is in bar.
1.1.4 State 4: ( Td > T > Tb)
In this condition, the temperature lies between the dew point temperature and boiling point temperature and enthalpy of two-phase mixture is calculated (Park and Sonntag, 1996) by:
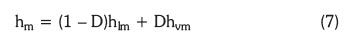
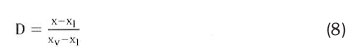
where hlm and hvm denote the enthalpies of the saturated liquid mixture and saturated vapour mixture, respectively and D, the dryness fraction of the mixture, is given by:

where xi and xv are the mass fractions of ammonia in the liquid- and vapour-solution, respectively.
1.1.5 State 5: (T = Tb)
In this condition, the mixture is at the boiling point temperature as a saturated liquid. At this condition the enthalpy is calculated [Siddiqui, 1999] by:
where the constants are listed below:
C0 = -2.25462e+3,
C1 = 884209e+5,
C2 = -1.239222e+8,
C3 = 1.197489e+3,
C4 = 4.686089e-2,
C5 = -9.412826e+5,
C6 = 1.797014e+8,
C7 = -3.701820e+2,
C8 = 2.935257e-3,
C9 = 0.357491e+5,
C10 = 0.122989e+8,
and hl1and hl2 are the enthalpies of saturated liquid ammonia and saturated liquid water component respectively, and are given by the following equations.
where the constants are given by:
a0 = -1477.925379,
a1 = 7.979672715,
a2 = -1.584957e-2,
a3 = 2.357889e-5,
a4 = 1.938836e-1,
a5 = -1.832123e-6,
a6 = -4.370722e-6,
w0 = -1296.803487,
w1 = 5.6052326,
w2 = -4.3682107e-3,
w3 = 4.4796158e-6,
w4 = 0.12685805,
w5 = -3.8716726e-7,
w6 = -2.3459764e-6.
It may be noted that T is in K and P is in bar in the equations (8) through (10). Further xi and xv should be used in place of x in equations (4) and (8), respectively
1.1.6 State 6: (Tb> T > Tsat1)
The mixture is considered as the mixture of sub-cooled water and pseudo- liquid ammonia. At this condition, the mixture enthalpy is calculated (Kalina et al., 1986) by interpolation of enthalpies at temperature Tb and Tsat1 given by the equations, (8) and the forthcoming equation (11), respectively.
1.1.7 State 7: ( T ≤ Tsat1)
In this condition, the temperature falls below Tsat1. The enthalpy for this condition is calculated (Ibrahim and Klein, 1993) by using the equation:
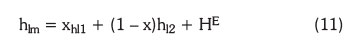
where hl1 and hl2 are the enthalpies of the sub-cooled pure ammonia and the subcooled pure water, respectively to be calculated from eqn. (9) and (10), respectively. HE accounts for the isothermal enthalpy departure from the real solution and is given by
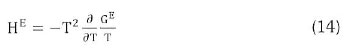
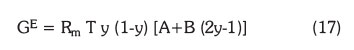
where GE, the Gibb's excess energy for liquid mixtures, accounts for deviation from ideal solution behavior and its value can be obtained from two references (Kalina et al., 1986 and Feng and Goswami, 1999). In reference (Kalina et al., 1986), it is expressed by a Margule-type equation:
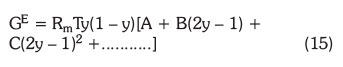
where y is the mole fraction of ammonia and Rm stands for characteristic gas constant of mixture, given by:
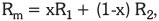
Unfortunately, values of the constants appearing here are not available on the paper. GE in the reference (Feng and Goswami, 1999) and is expressed in terms of reduced pressure and temperature, by the following equation:
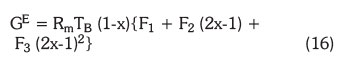
where the constants are given below:
The coefficients F1 F2 and F3 use reduced pressure ( ) and reduced temperature (
 ) which are found with base pressure PB = 10 bar and base temperature TB = 100 Κ and their constants are given below:
E1 = -41.733398,
E2 = 0.02414,
E3 = 6.702285,
E4 = -0.011475,
E5 = 63.608967,
E6 = -62.490768,
E7 = 1.761064,
E8 = 0.008626,
E9 = 0.387983,
E10 = 0.004772,
E11 = -4.648107,
E12 = 0.836376,
E13 = -3.553627,
E14 = 0.000904,
E15 = 24.361723,
E16 = -20.736547.
Gibb's excess free energy (GE) can also be evaluated using reference (El-Sayed and Tribus, 1986):
where
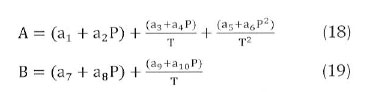
Values of the constants in equations (18) and (19) are given below:
a1 = 18.1901,
a2 = -0.121603,
a3 = -99.5037,
a4 = 0.67809,
a5 = 84.4263,
a6 = -1.02601,
a7 = 2.43329,
a8 = 0.026458,
a9 = -1.28324,
a10 = -0.106125,
where P is expressed in MPa and T is the reduced temperature, T(K)/100 using 100 K as the reference temperature.
Thus, there are three equations namely, equations (15), (16) and (17) which may be used for calculating GE. Equation (15) is not usable because of inadequate information. Equation (16) was tried but it could give values closer to Goswami and Feng (1999) only when the concentration (x) was changed from mass to molar, i.e. to y. Equation (17) also did not give the satisfactory results unless T, was changed from reduced value to base value, TB. Incorporating the proposed corrections in equations (16) and (17), and comparing the predicted values of enthalpies, modified equation (17) gives the results closer to those in reference (Goswami and Feng, 1999). So it was used in the present work. For completeness, it is rewritten as:
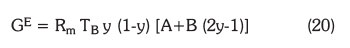
where A and B are the same as given in equations (18) and (19).
2. Calculation of mass flow rates
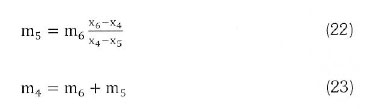
The conservation equations for mixture mass and ammonia concentration in the mixture for absorber may be written as:
and
which lead to
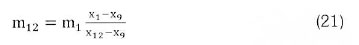
Similarly, for condenser/rectifier
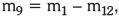
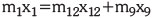
while the constant mass flow rates are obtained at stations (1, 2 and 3) and (6, 7, 8 and 9) i.e.
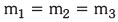
and
where m is the mass flow rate of the mixture with a suffix denoting the station number.
Overall thermal efficiency is calculated as follows:
where
The net work output,
The refrigeration output
The superheat input
The boiler heat transfer
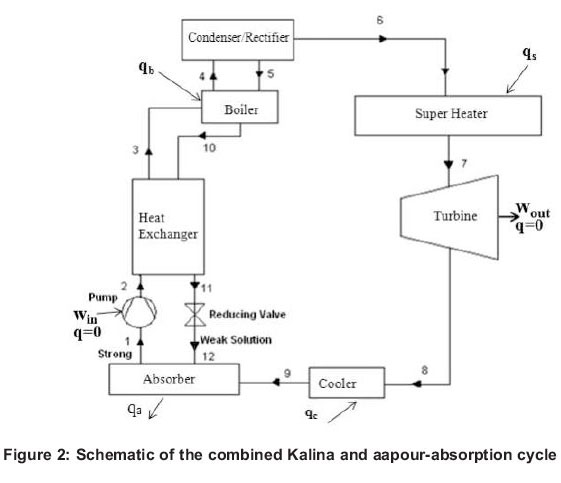
where the suffixes of enthalpy and mass flow rate denote the station numbers as given in Figure 2.
3. Results and discussions
Dew point temperature and boiling point temperature
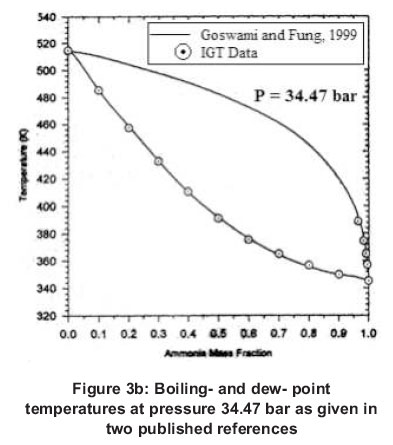
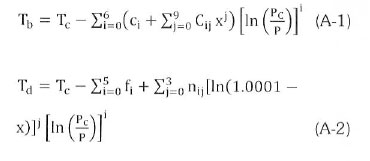
The variations of the dew- point temperature (Td) and boiling-point temperature (Tb), with mixture concentration (x) were calculated at pressure 34.47 bar from equations A-1 and A-2, respectively and have been shown plotted in Figure 3a.
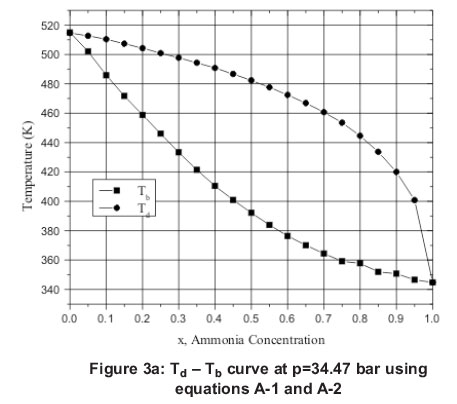
In Figure 3b, Td and Tb variations using the IGT (Institute of Gas Turbine) data is given by circled points and the continuous curves pertain to reference (Goswami and Feng, 1999), as explained in the insert. From Figures 3a and 3b, it is observed that the nature of curves from this work is similar to both of the IGT data and from above mentioned reference.
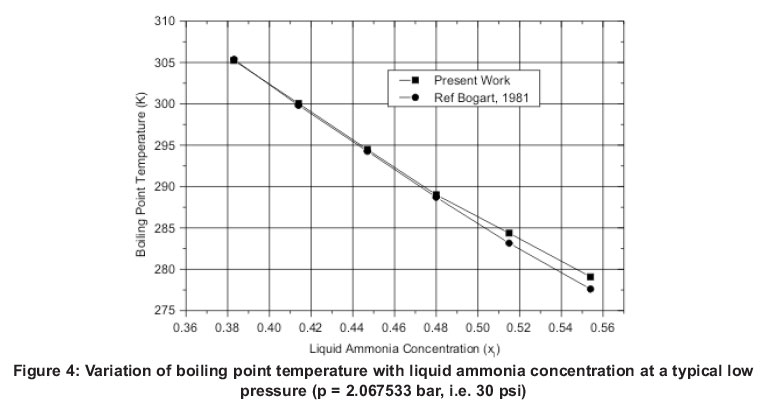
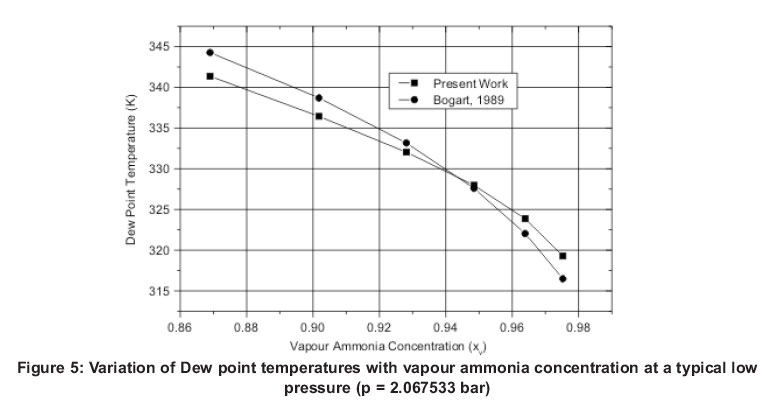
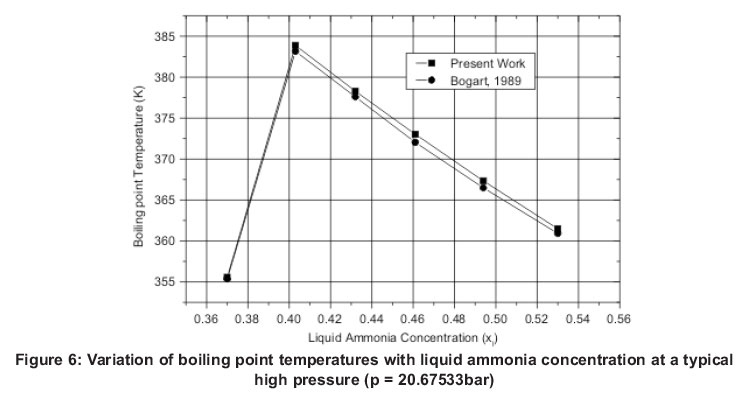
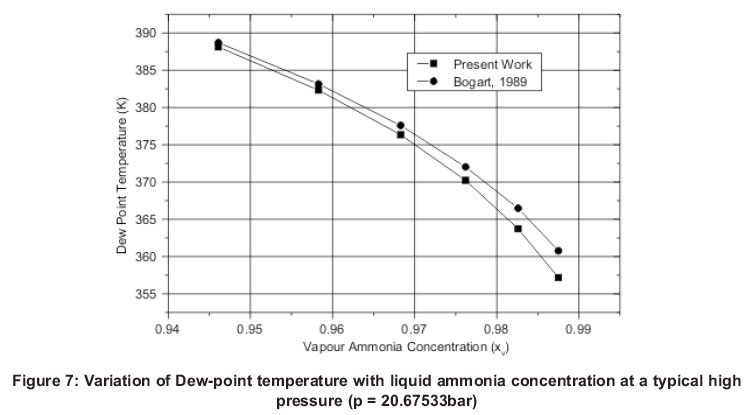
In an effort to have a further verification, the boiling point and dew point temperature, calculated from the methodology at low pressure of 2.067533 bar (30 psi) and other at high pressure of 20.67533 bar (300 psi) are shown in Figures 4, 5, 6 and 7 and compared with the reference (Bogart, 1981). It is observed from these figures that the predicted boiling point temperature and dew point temperature values, at both the typical high and low pressures deviate within ±1%. So the methodology adopted to predict dew point temperature and boiling point temperature gives fairly accurate results.
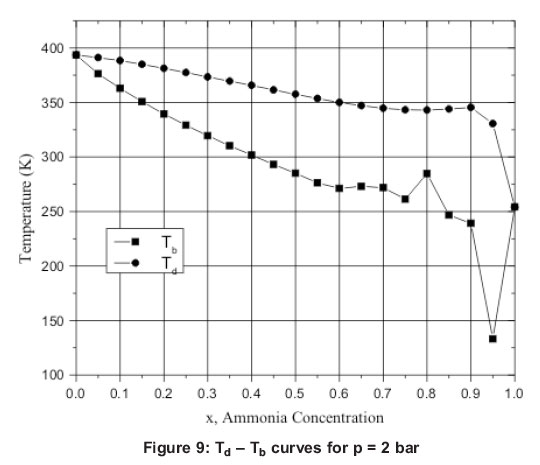
Besides this, the boiling point temperature and dew point temperature for various concentrations have been obtained for the entire concentration range from 0 to 1 for typical high and low pressure values that is 30 bar and 2 bar. This has been plotted in Figures 8 and 9. From these figures, it is found that the calculated boiling point temperature variation for concentration of ammonia beyond 0.8 at a very low pressure (<10 bar) do not join smoothly with the curves which join points for x<0.8. Such condition i.e. x<0.8 does not occur in the cycle, as discussed below,
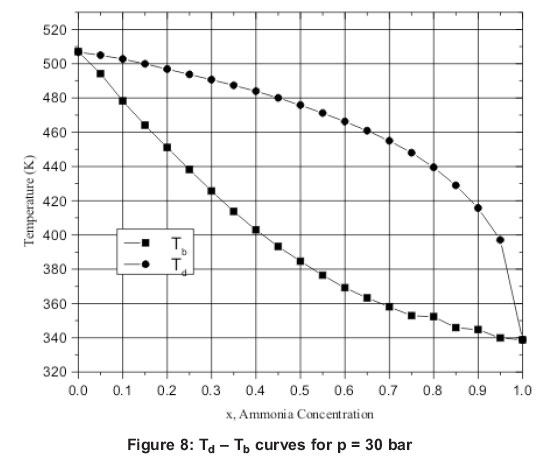
With reference to Figure 2, low pressure exists in the cycle in cooler and absorber i.e. stations 8, 9, 1 and 12. At entrance to the cooler, though the ammonia concentration is quite high (>99%), it is a mixture of saturated liquid and saturated vapour in equilibrium, the saturated liquid concentration becomes much lower than 0.8. At exit from the cooler, mixture temperature increases and exceeds the dew-point temperature so liquid phase is no longer there.
It is absorbed by the weak solution coming from boiler (station 12) via the heat exchanger and reducing valve. So the mixture leaving absorber, this ammonia vapour of high concentration (station 1) reaches in the vicinity of boiling point temperature, yet the concentration is much less than 0.8 due to absorption of ammonia by weak aqua ammonia solution.
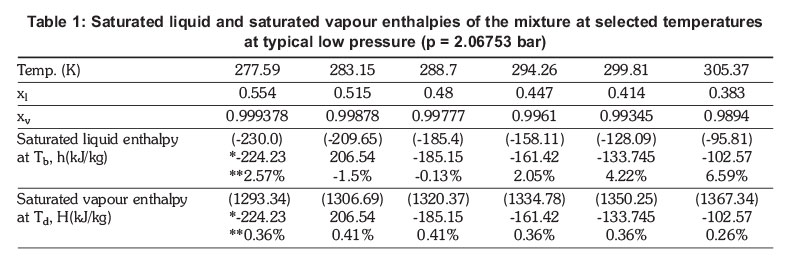
Having verified the application of the equations A-1 and A-2 for Tb and Td, respectively, next to be considered is the enthalpy needed for the analysis of the cycle. At dew- and boiling-point temperatures, the predicted values of enthalpies calculated in this paper are tabulated in Tables 1 and 2 at two typical pressure values 30 psi (2.06753 bar) and 300 psi (20.6753 bar), respectively, because enthalpy values are available at these pressures in reference([Bogart, 1981) for the purpose of comparison.
In these tables, enthalpies within small parentheses are the values predicted using relevant equations, having prefix * represent the values from reference (Bogart, 1981), while those with prefix ** denote % enthalpy deviation from reference (Bogart, 1981).
These tables reveal that:
a. At high pressures, saturated liquid enthalpy values at boiling point temperature, h deviate by maximum 2.28% and saturated vapour enthalpy at dew point temperature, H deviate by a maximum of 1.54%.
b. The saturated vapour enthalpy for low pressure at dew point temperature, H deviate from reference (Bogart, 1981), by a maximum of 0.41% but at boiling point temperature saturated liquid enthalpy, h deviate more, by a maximum of 6.6%. The high value deviations are seen at temperature greater than 300 K.
With reference to the values of enthalpies at stations 2 and 11, where the ammonia exists as a sub-cooled liquid, have been compared with (Goswami and Feng, 1999). Percentage deviations calculated as mixture predicted by equation (20) is reasonably close (< 8%) to the one obtained in reference (Goswami and Feng, 1999). Having arrived at final equations, software was developed for calculating enthalpies at various mixture conditions.
Enthalpies are now compared with those given in (Goswami and Feng, 1999) for the values of pressure, temperature and concentration taken therein. The comparison is given in Table 3. The computed values of the enthalpies are compared with those tabulated in reference (Goswami and Feng, 1999) for the same typical operating conditions. The percentage deviations defined by
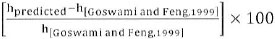
are within 4% at all stations except 11 and 12. The value of enthalpy deviates by 7.9% at station 11 and by 15.5% at station 12. It means that the constants in the equations for determining enthalpy of the mixture still need revision where the mixture was weak in ammonia and it is at a temperature in the near vicinity of or much below the saturation temperature of ammonia at the concerned pressure.
4. Conclusions
Equations have been reviewed for calculating boiling point and dew point temperatures for the given mixture pressure and concentration and in turn the mixture enthalpy at various mixture states. After establishing the condition of the mixture from mixture temperature and boiling- and dew-point temperature, the procedure calculates the mixture enthalpy at the salient stations of a combined power and cooling cycle. The enthalpy values, so predicted are found close to those reported in the reference (Goswami and Feng, 1999), except at station numbers 11 and 12, where the mixture was weak in ammonia and it is at a temperature in the near vicinity of or much below the saturation temperature of pure ammonia at the concerned pressure. The deviations are 7.9% and 15.5%, respectively. This would require revision of the constants used for evaluating enthalpies under the said conditions. Thermal efficiency of the combined cycle is found reasonably accurate (20.68% against the published values of 23.54%). The efficiency is calculated from turbine work, pump work, superheater heat input and refrigeration/cooling effect. The latter are the functions of mass flow rates and enthalpies at the characteristic stations of the cycle. The mass flow rates, if not known, can be obtained from the mass and concentration conservation equations. Thus, the software is capable of predicting the performance of a combined power and cooling cycle, satisfactorily.
Acknowledgement
We are very thankful to Dr D. Yogi Goswami, Department of Mechanical Engineering, University of Florida, Gainesville, FL 32611, USA, for supporting us. He has sent us a number of research papers regarding the topic, without whose cooperation this paper could have not been produced.
References
Ballaney P L., (2002). Refrigeration and Air Conditioning, Delhi: Khanna Publishers. [ Links ]
Bogart M., (1981). Ammonia Absorption refrigeration in Industrial Process, Houston: Gulf Publishing Company. [ Links ]
El-Sayed Y M. and Tribus, M. (1986). Thermodynamic Properties of Water Ammonia Mixture: Theoretical Implementation for Use in Power Cycle Analysis, ASME Special Publication; AES (1): p. 89-95. [ Links ]
Feng Xu. and Goswami D. Y. (1999). Thermodynamic Properties of Ammonia-Water Mixtures for Power Cycle Applications, Energy (24) 525-536. [ Links ]
Goswami D. Yogi and Feng Xu (1999). Analysis of a New Thermodynamic Cycle for Combined Power and Cooling Using Low and Mid Temperature Solar Collectors, ASME Journal of Solar Energy Engineering May 1999; (121): 91-97. [ Links ]
Ibrahim O. M. and Klein, S. A. (1993). "Thermodynamics Properties of Ammonia Water Mixture", ASHRAE Trans Symposia, pp 1495-1502. [ Links ]
Kalina A. I. (1984). Combined Cycle System with Novel Bottoming Cycle, ASME Journal of Engineering for gas turbines and power 1984; (106): 737-742. [ Links ]
Kalina A. I. and Tribus, A. M. (1990a). Advances in Kalina cycle technology Part 1 Development of a practical cycle Energy for the Transaction age, Proceedings of the Florence World Energy Research Symposium, Firenze, Italy, Vol. 97,1990a. pp 111-124. [ Links ]
Kalina A. I. et al., (1986). A Theoretical Approach to the Thermophysical Properties of Two Miscible Component Mixture for the Purpose of power Cycle Analysis, Dec. 7-12, 1986 ASME winter annual meeting, Anaheim, California. (86). Exergy Incorporation Houston, Texas: WA/HT-54. p. 1-8. [ Links ]
Koremenos D. A. et al.,. Cogeneration with Combined Aqua Ammonia Absorption Cycle, Thermodynamic and the Design, Analysis and Improvement of Energy Systems, R. J. Drane Ed., AES Vol. 33, pp231-238. [ Links ]
Maloney J. D. and Robertson R. C., (1953). Thermodynamic Study of Ammonia-Water Heat Power Cycles, ORNL Report CF-53-8-43, Oak Ridge, TN. [ Links ]
Maskara P N. and Satish Chand, (1987). Tables and Charts on Refrigerants & Psychometric Properties, Allahabad: Technical Publishers of India. [ Links ]
Moran J. M. and Howard N. S. (2000). Fundamentals of Engineering Thermodynamics", Singapore: 4th Edition John Wiley & Sons (ASIA) Pvt. Ltd. [ Links ].
Park Y. M. and Sonntag, R. E. (1990). "Thermodynamic Properties of Ammonia Water Mixture: A Generalized Equation of State Approach", Vol. 97, ASHRAE Transactions, .p. 150-159. [ Links ]
Rogdakis E. D. and Antonopoulos K. A. (1991). A High Efficiency NH3-H2O Absorption Power Cycle, Heat Recovery System 1991; (II): 263-275. [ Links ]
Siddiqui Altamash M. Analysis of Some Simple and Advanced Absorption Cycle, M. Tech. thesis submitted to Department of Mechanical Engineering, India: I.I.T. Kanpur Mechanical Engineering Department. [ Links ]
Tariq M. (2003). Computer Simulation of the Combined Cycle for Power and Cooling, M. Tech. Thesis submitted to India: M.N.N.I.T. Allahabad, Mechanical Engineering Department. [ Links ]
Washam B. et al., (1994). Integrated Solar Combined Cycle Systems (ISCS) Utilising Solar Parabolic through Technology-Golden Opportunities for the 90's. Presented at the 1994 Annual Meeting of the American Solar Energy Society, Paper available from Spencer Management Associates, Diablo, California: 1994. [ Links ]
Yadav R. (2001). Thermodynamics and Heat Engines", Allahabad: Central Publishing House. [ Links ]
Zeigler B. and Trepp C. (1984). Equation of State for Ammonia-water Mixtures, Refrigeration 7(2):101- 106. [ Links ]
Received 29 April 2013
Revised 9 January 2015
Where
It may be noted that P is in psia and T in 0F for equations A-1 through A-4. The values of constants are listed below.
c[0] = 153.634521459,
c[1] = -13.0305543892,
c[2] = -1.14845282991,
c[3] = 0.550358094447,
c[4] = -.0753450148427,
c[5] = 0.0048111666267,
c[6] = -0.000120433757177,
a[0] = 205.8889,
a[1] = 280.930556,
a[2] = -317.0138889,
a[3] = 263.194444,
b[0] = 0.368105523897,
b[1] = -3.6679548875,
b[2] = 46.6000470809,
b[3] = -262.921061996,
b[4] = 732.99536936,
b[5] = -1076.0613489,
b[6] = 797.948078048,
b[7] = -235.903904222,
C[0][0] = -462.460321366,
C[0][1] = 2373909986309,
C[0][2] = -194504.35292,
C[0][3] = 639383.528867,
C[0][4] = -523748.057636,
C[0][5] = -2328271.47551,
C[0][6] = 7562418.53499,
C[0][7] = -9668295.89504,
C[0][8] = 5922081.87086,
C[0][9] = -1432405.52125,
C[1][0] = 421.443122208,
C[1][1] = -14560.354925,
C[1][2] = 53051.4495633,
C[1][3] = 382763.793582,
C[1][4] = -583589.86875,
C[1][5] = 12243265.3815,
C[1][6] = -22307970.0156,
C[1][7] = 22896656.8499,
C[1][8] = -12483324.8091,
C[1][9] = 2813311.71633,
C[2][0] = -248.783804168,
C[2][1] = 4807.07241098,
C[2][2] = 13565.1003309.
C[2][3] = -466407.780832,
C[2][4] = 2827083.44764,
C[2][5] = -8469715.15799,
C[2][6] = 14459588.8962,
C[2][7] = -14281087.5331,
C[2][8] = 7596403.59678,
C[2][9] = -1684002.64482,
C[3][0] = 126.965580728,
C[3][1] = -2090.45270574,
C[3][2] = 1993.17101166,
C[3][3] = 100706.510396,
C[3][4] = -687388.808612,
C[3][5] = 2132412.46959,
C[3][6] = -3699199.65914,
C[3][7] = 3688365.22546,
C[3][8] = -1975122.39296,
C[3][9] = 440201.446068,
C[4][0] = -33.5343446156,
C[4][1] = 601.878586689,
C[4][2] = -3064.82070658,
C[4][3] = 71.7954752052,
C[4][4] = 51780.666659,
C[4][5] = -209714.899856,
C[4][6] = 405011.985355,
C[4][7] = -428310.461566,
C[4][8] = 238153.698326,
C[4][9] = -54497.0973336,
C[5][0] = 3.97454953787,
C[5][1] = -77.026846469,
C[5][2] = 541.19105807,
C[5][3] = -1696.60270972,
C[5][4] = 1713.45942707,
C[5][5] = 4019.01019872,
C[5][6] = -14844.7928004,
C[5][7] = 19481.0094551,
C[5][8] = -12107.0794501,
C[5][9] = 2966.92804386,
C[6][0] = -0.170806170177,
C[6][1] = 3.48182859299,
C[6][2] = -27.7957587743,
C[6][3] = 113.762064546,
C[6][4] = -258.750496922,
C[6][5] = 311.002585218,
C[6][6] = -123.917993454,
C[6][7] = -123.480627492,
C[6][8] = 154.375042114,
C[6][9] = -48.5083828701,
f[0] = 153.17055346,
f[1] = -11.7705687461,
f[2] = -1.78126355957,
f[3] = 0.647385455059,
f[4] = -0.0719950751898,
f[5] = 0.00285423950786,
n[0][0] = 194.793913463,
n[0][1] = 74.236124188,
n[0][2] = 9.84103819552,
n[0][3] = 0.436843852745
, n[1][0] = -74.3508283362,
n[1][1] = -3.2941879809,
n[1][2] = -4.78866918581,
n[1][3] = -0.225416733476,
n[2][0] = 13.0175447367,
n[2][1] = 6.1586564117,
n[2][2] = 0.789740337141,
n[2][3] = 0.0321510834958,
n[3][0] = -0.90857587517,
n[3][1] = -0.356752691147,
n[3][2] = 0.0238067275502,
n[3][3] = 0.00495593933952,
n[4][0] = -0.00071863574153,
n[4][1] = -0.0251026383533,
n[4][2] = -0.0191664613304,
n[4][3] = -0.0017014253867,
n[5][0] = 0.00195441702983,
n[5][1] = 0.00280533348937,
n[5][2] = 0.0013899436563,
n[5][3] = 0.000116422611616.
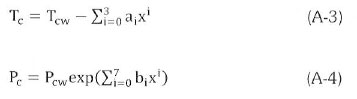
Saturation temperature (Tsat) of pure components is given by:
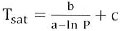
where P and Tsat are in bar and K, respectively. Values of the constants, with subscript 1 for pure ammonia and 2 for pure water, are listed below:
a1 = 10.77584068,
a2 = 11.73544221,
b2 = 3861.6302,
b1 = 2324.262496,
c1 = 23.624144,
c2 = 43.66924.

