


Services on Demand
Article
 English (pdf)
 Article in xml format
 Article references
Indicators

Related links
-
 Cited by Google
 -
 Similars in Google
Share

 Permalink
Journal of Energy in Southern Africa
On-line version ISSN 2413-3051
Print version ISSN 1021-447X
J. energy South. Afr. vol.26 n.1 Cape Town Feb. 2015
Performance of an autonomous solar powered absorption air conditioning system
Tatenda J Bvumbe; Freddie L Inambao
Department of Mechanical Engineering, University of KwaZulu-Natal, South Africa
ABSTRACT
The demand for air conditioning is increasing due to changing architectural trends and increased standards of living and indoor comfort conditions. Coupled to this, refrigerants used in conventional refrigeration systems have detrimental effects on the environment. As a result, there is an urgent need to implement environmentally cleaner ways of satisfying this air-conditioning demand. Absorption cooling systems have shown great potential to do so. In this study, system performance data for an autonomous solar heating and cooling system installed at the Vodafone Site System Innovation Centre, at the Vodacom Campus in Midrand was collected and analysed. The system comprises a 116 m2 vacuum tube collector array, a 6.5 m3 hot water storage tank, a 35 kW LiBr-Water absorption chiller, 1 m3 of cold water storage, a dry cooler for the chiller, and two underground thermal stores to pre-cool the supply air to the building and the dry cooler respectively. System performance data was collected from the beginning of December 2011 to the end of January 2012 and used to estimate the system long term performance. The chiller has an average coefficient of performance (COP) of 0.51 whilst the solar COP has an average value of 0.24. The total installation cost is R2 822 436.89, with an annuity of R225 949.75 and a cost per kWh of R28.88.
Keywords: solar powered absorption cooling, LiBr-water, system performance, economic performance
1. Introduction
Heating Ventilation and Air Conditioning (HVAC) contributes approximately 5 400 MW to electricity demand, which is roughly 15% of the peak load demand. In total, every year HVAC systems utilize 4 000 GW of electricity in South Africa (Eskom, n.d.). Due to the prevailing electricity shortages and ever increasing energy prices, there is now an increased need for cooling systems that use working cycles that can be driven by renewable energy such as solar, wind, geothermal and biogas, whilst at the same time, having minimum impact on the environment. The solar radiation levels in South Africa are among the highest in the world. As a result, solar energy has the potential to supply a sizeable percentage of the cooling energy demand. The annual 24-hour solar radiation average for South Africa is 220 W/m2. Most of the interior geography of the country receives an average insolation in excess of 5 kWh/m2/day with some parts of the Northern Cape averaging 6 kWh/m2/day (Haw and Hughes, 2007). In general, solar cooling is an attractive idea because the cooling loads and availability of solar energy are approximately in phase.
The most common type of thermally driven technology used globally to produce chilled water is absorption cooling. The absorption cooling system is characterized by high reliability, silent operation, long service life, simple capacity control and low maintenance costs. This makes it a genuine candidate for efficient and economic use of solar energy for cooling applications. Absorption systems use low temperature thermal energy collected from the sun without converting it into mechanical energy as is the case in vapour compression systems. The basic physical process in an absorption system consists of at least two chemical components, one of them serving as the refrigerant and the other as the absorbent. For air-conditioning applications, absorption systems commonly use lithium bromide-water or ammonia-water working pairs. LiBr-water absorption units are the most appropriate for solar applications since low cost solar collectors may be used to power the generator of the machine. The NH3-water machine requires high generator temperatures in the range of 125-170oC (Duffie and Beckman, 2006). This temperature requires the use of medium concentration ratio parabolic collectors, which have increased maintenance requirements. The LiBr-water machine requires a temperature in the range 75-120oC, which is easily achieved using flat plate or evacuated tube collectors. The LiBr-water machine has a higher coefficient of performance (COP) than that of the NH3-water machine and costs less (Duffie and Beckman, 2006; Mittal, Kasana and Thakur, 2006; Henning, 2005; Hang, Qu and Zhao, 2011; Agyenim, Knight and Rhodes, 2010; Casals, 2006). One of the reasons the NH3-water machine is more expensive is because it requires a rectifier to prevent any water vapour entering the evaporator.
In this study, we monitor a solar powered HVAC system and report on its performance and cost.
2. System description
The Vodacom Campus is located in Midrand (within greater Johannesburg) at a latitude of 25o58'14"S and a longitude of 28o7'37". This area receives on average of 3 128.3 hours sunshine a year. The key weather parameters for Johannesburg are presented in Table 1.
The Vodafone Site Solution Innovation Centre (Vodafone SSIC) is the first 6 Green Star SA accredited building in South Africa. In this building, two types of solar technologies are used: a photovoltaic (PV) system to generate electricity and a solar thermal system that provides heating and cooling through a solar absorption system. This study focuses on the solar powered absorption system. This is a solar autonomous thermal heating and cooling system to maintain room temperature at comfortable levels throughout the year. Two rock storage facilities are located under the building: one pre-cools the supply air to the building so that the cooling load is reduced and the other pre-cools the supply air to the dry cooler at ambient air temperatures to facilitate heat rejection.
The system also includes a 116 m2 evacuated tube collector array, a 6.5m3 hot water storage tank, Yazaki WFC10 absorption chiller with a dry cooler for heat rejection, a 1m3 cold storage tank, a thermally activated slab and a dehumidification system.
3. Building loads
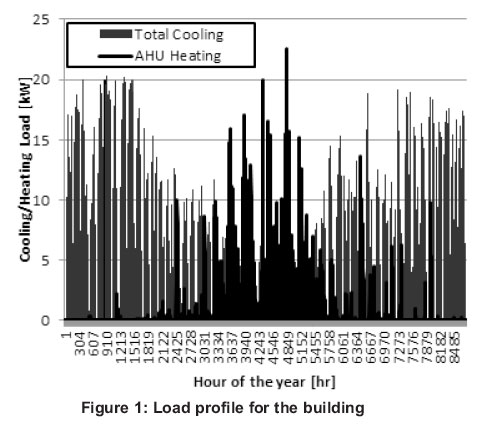
In Johannesburg, the average ambient temperatures are highest in the period from November to April and the cooling requirements follow the same pattern. During this period, the temperatures fall to about 15oC after midnight and these mild temperatures are responsible for the observed low heating requirements. The outside ambient temperatures start falling below 10oC in April and hence the heating loads for the building start steadily increasing reaching their peak in July. The load profile for the office building in this study is shown in the Figure 1. The maximum cooling load is around 20 kW and is experienced during the period November to February whereas the maximum heating load is 22.5 kW and is recorded in July. The annual cooling demand is 18.4 MW and the annual heating demand is 3.2 MW.
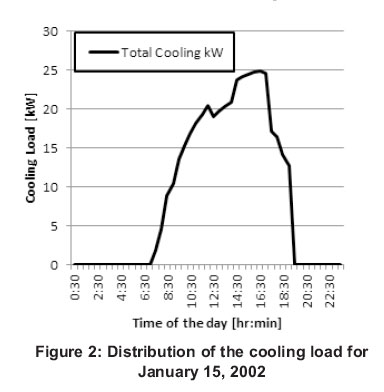
The peak sizing for the cooling system was based on January 15, 2002. The cooling for the building increases steadily from morning as the ambient temperature and incident solar irradiation increases. The peak cooling load occurs later in the day instead of around midday when the solar energy is at its maximum. This delay is due to conduction of the incident solar energy by the walls, roof and windows of the building. This heat energy is transferred to the cooling space by convection. The peak load is 24.87 kW and occurs at 16:30 and the average load is 8.86 kW. This particular day experienced an average dry bulb temperature of 24.4oC, with a maximum of 30oC being recorded at 15:00. The distribution of the cooling for this day is shown in Figure 2.
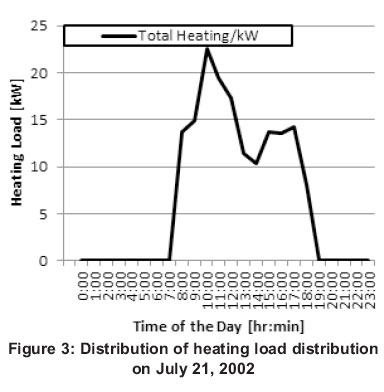
In winter, the system provides heating for the building. A three-way valve is used to bypass the chiller in winter so that hot water can be delivered from the hot water storage tank directly to the air handling unit and the thermally active slab. The heating energy demand rises quickly in the morning and reaches its peak before midday. The high demand in the morning can be attributed to lower temperatures and incident solar irradiation in the morning. As the day progresses and this ambient temperature and incident solar radiation increases the building energy demand steadily decreases. In the summer of 2002 the highest heat demand experienced was July 21, with a maximum heating load of 22.5 kW and an average of 6.64 kW.
The distribution of the heating load on that day is shown in Figure 3.
4. Solar array performance
The collector had an average useful energy output of 31.43 kW with a maximum value of 143.7 kW on January 31, 2012, as shown in Figure 4.
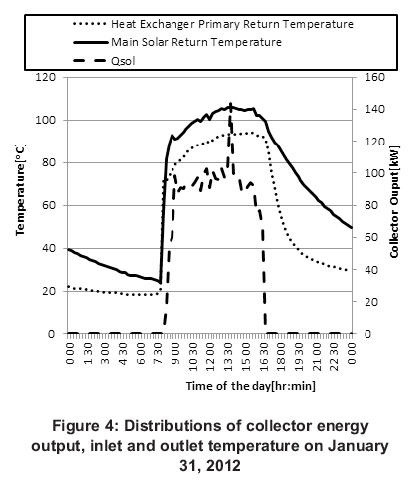
There is a rapid rise in both the collector outlet and inlet temperatures at 7:45 because that is the time when the primary solar pump is switched on and starts to circulate water in the collectors that have already been warmed up by the early morning sun. The collector inlet is slightly greater than the outlet at the beginning which is why no useful energy is supplied by the collector. Once the outlet temperature becomes greater than the inlet then useful energy starts being supplied. The useful energy produced increases rapidly in the first hour and then stays approximately constant throughout the day. The graph shows that there is a fairly constant change in these parameters throughout the day.
The evacuated tube collectors that are used in this system are defined by the following equation:
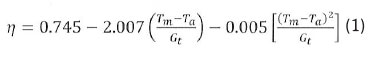
Where
Ta Ambient temperature
Tm Collector average temperature
Gt Incident solar energy
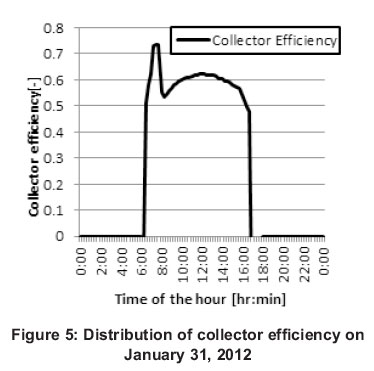
The third term on the right hand side of equation (1) can be neglected without any significant effect on the collector efficiency. In the morning, the collector average temperature is approximately equal to the ambient temperature so that the collector efficiency is equal to the nominal efficiency of 0.745. There is a rapid increase in the difference between the average collector temperature and the ambient temperature and hence the sharp decrease in the collector efficiency. As the incident solar energy increases, the efficiency starts increasing with a distribution similar in shape to the solar energy distribution and reaches its peak around midday. The incident solar then steadily decreases after midday and consequently the collector efficiency does the same. The distribution of the collector efficiency given by the above equation is shown in Figure 5.
5. Absorption chiller performance
The distribution of the temperature streams going in and out of the chiller is presented in Figure 6. The chiller can be operated using water with a temperature of between 70oC and 95oC, but the system control strategy states that the chiller will only start producing cooling energy if the hot water temperature that is being delivered into the generator exceeds 80oC. The system performance values were recorded at 15 minute intervals and there are 96 data points for January 31, 2012. As shown in Figure 6, 35 of the recorded values, representing 36.5%, were above 70oC. This means that the chiller could have run for 36.5% of the time period if required. The generator inlet temperature exceeds the threshold value of 80oC for 28 of the recorded values representing 29.2% of the time period.
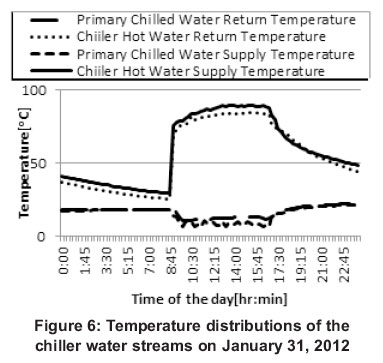
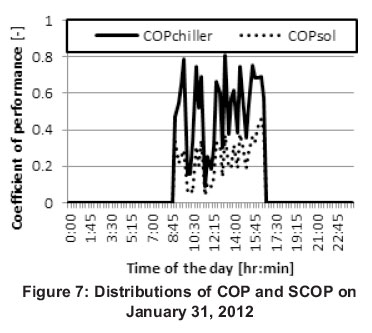
It can be seen that the hot water stream temperatures rise sharply when the chiller is switched on at 9:00 after which they become fairly constant before gradually falling after the chiller is switched off at 17:00. The chilled water return temperature starts gradually decreasing at chiller switch on, and then evens out as the day progresses. This is different from the chilled water supply temperature, which shows an up and down trend. This is because the system control strategy requires that the chiller switches off if the chilled water supply temperature falls below 7oC. The same distribution is also seen in the variation of the chiller COP and solar COP as seen in Figure 7.
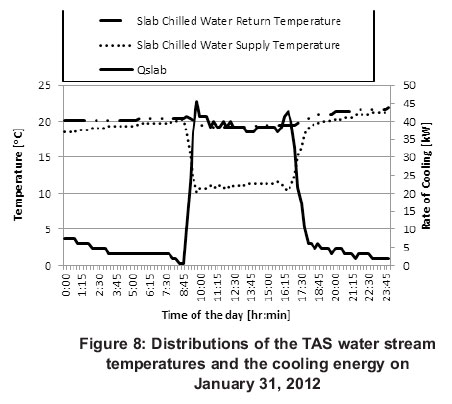
6. Thermally activated slab
Concrete Core Tempering also known as Thermally Activated Building Systems (TABS) is a method of introducing heating or cooling into a concrete structure by means of embedding a series of pipes in the concrete floor or cooling slab (REHAU Polymer Limited, n.d.).. The cooling energy produced is used to substitute the heating or cooling energy generated by a central air-conditioning system. The TABS acts by reducing the building cooling load through radiant and convective cooling as the cold water travels in the embedded pipes underneath the floor. On January 30, 2012 the thermal store provided an average energy output of 15.74 kW with a maximum of 45.52 kW. As a result of this large amount of cooling energy generated, the AHU had a cooling rate of 3.96 kW which is approximately 15.3% of the total cooling capacity. The thermal store satisfies the bulk of the cooling demand. The energy is generated from the moment that the slab pumps are switched on and the energy generation proceeds at a rate that is approximately constant. The input and outlet temperatures of the TABS are also fairly even throughout the day. The variations of these temperatures and the cooling energy produced are shown in Figure 8.
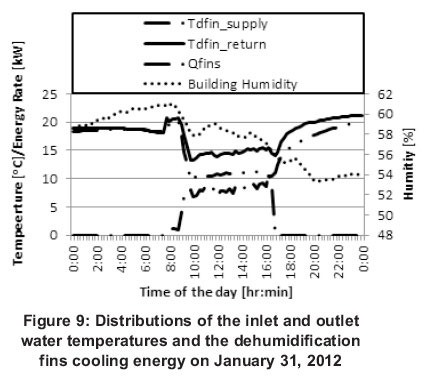
7. Dehumidification fins
The TABS lowers the air temperature when the air comes in contact with the cooled slab hence condensation of water vapour takes place on the floor. To solve this problem, a dehumidification system is integrated with TABS. The functions of the dehumidification fins are to maintain the building humidity in the range 30-65%. There is a control system that automatically switches the dehumidification fins on at 8:00 and switches them off at 17:00. The dehumidification is achieved by passing the air over a refrigerated coil. This cools the air below dew point and the moisture is condensed and drained out. The cold air produced is introduced into the building airspace and this produces a cooling effect. The fins provided an average cooling capacity of 2.6 kW with a maximum of 11.1 kW. The variations are shown in Figure 9.
8. Building environment
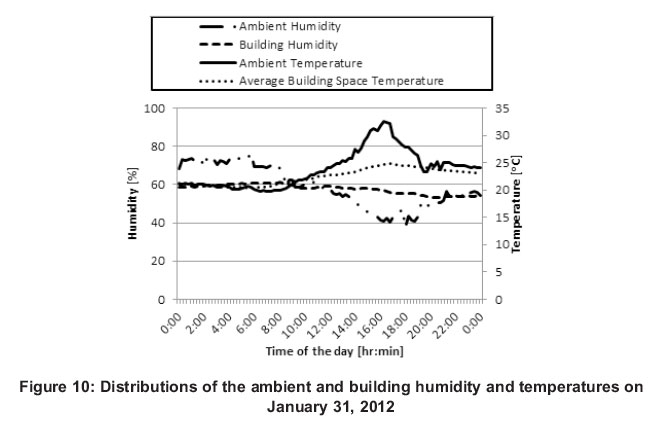
The system was designed to keep the building airspace temperature between 20oC and 25oC. The ambient conditions determine the amount of work that the system has to perform for these desired conditions to be maintained. On 31 January, 2012 there was an average ambient temperature of 23.82oC with a maximum temperature of 32.5oC. The ambient humidity had an average of 58.82% and a maximum of 76.6% as shown in Figure 10. The solar cooling system was able to maintain the temperature within the desired limits throughout the day; the average building temperature had a mean value of 22.47oC, a maximum of 24.9oC and a minimum of 20.4oC. The humidity had an average value of 57.6% with maximum and minimum values of 61.15 and 53.3% respectively.
9. Economic analysis
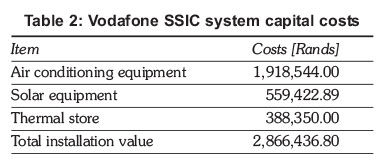
The costs of a solar powered cooling system can be broken down into capital costs, operating costs and costs for energy. The capital costs for the Vodafone SSIC system are shown in Table 2.
To measure economic performance we use the total cost of the cooling system. We make use of the annuity method, where all cash flows are connected into a series of annual payments of equal amounts. The annuity is found by first calculating the net present value (NPV) of all costs occurring at different times during the project, i.e. by discounting all costs to the time when the investment takes place. The NPV is the total present worth of the gains from the solar system compared to the electricity only system. The capital value of the investment is made up of the initial investment costs and any further investments for component exchange in subsequent years. This is calculated using the rate of inflation and the basic interest rate (Pietruschka, 2010). The capital value is given as:
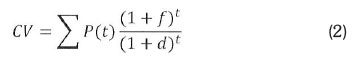
Where:
CV Capital value
p(t) Investment at time t
t Time
d Basic interest rate
f Inflation rate
The prime interest rate set by the South African Reserve Bank as of May 2012 was 5.75% and the inflation rate was 9% (South African Reserve Bank, 2012). With these values the CV is found as R1 934 844.90.
The annual expenses for maintenance and plant operation, which occur regularly during the life time of the plant, are discounted to the present value by multiplication of the expenses with the present value factor (PVF). The PVF is given by the following equation:
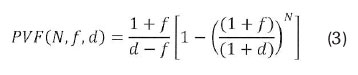
Where:
PVF (N,f,d) The present value factor
N Life time of the plan
f 5.75
d 9
N 20
The PVF is calculated to be 2.08.
In the case of solar cooling plants, no annual income is generated (Pietruschka, 2010; Edwards, 2011; Sakellari, 2005; Li and Sumathy, 2002). As a result, the NPV is simply obtained from the sum of discounted investment costs and the discounted annual expenses. It is defined here with a positive sign to obtain annuity values:
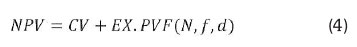
Where: EX Annual expenses
The annual expenses include maintenance costs, energy and water costs. The maintenance costs over the lifetime of the system are taken as 2% of the initial capital investment and the average life of the system is taken as 20 years (Pietruschka, 2010). The annual expenses (EX) are found to be R57 328.74. This consequently results in the NPV for the system being equal to R2 054 088.64.
To obtain the annuity, the NPV is multiplied by a recovery factor rf which is calculated from the discount rate and the life time of the plant.
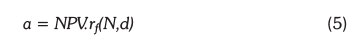
Where:
rf Recovery factor and is given as:
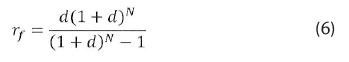
The recovery factor rf is calculated and found to be 0.11. The annuity for the system is R225 949.75.
The cost per kWh of cooling energy produced is the ratio of the annuity divided by the annual cooling energy produced (Sakellari, 2005). The cost per kWh is R28.88.
10. Conclusions and recommendations
The use of solar energy to provide building cooling energy using the absorption cycle has been demonstrated. The costs of the installation and hence the cost per kWh of energy produced is very high. This is because the system is oversized to cater for periods when the incident solar energy is low. It is recommended that solar powered absorption systems should be installed in combination with conventional vapour powered system so as to reduce the initial costs of the solar system. Further research should be geared towards cost reduction and the government can also introduce a rebate in order to encourage uptake of solar powered absorption systems.
Acknowledgements
The authors would like to acknowledge the assistance provided by Voltas Technologies, particularly Messrs Frank Major and Hartmut Martin, and financial support from the Centre for Engineering Postgraduate Studies (CEPS) and the DVC-Research, Prof Nelson M. Ijumba.
Nomenclature
CV Capital value
d Basic interest rate
f Inflation
Gt Incident solar energy
N Life time of the plan
PVF(N,f,d) The present value factor
P(t) Investment at time
t Time
Ta Ambient temperature
Tam Collector average temperature
References
Agyenim, F, Knight, I. and Rhodes, M. (2010). Design and experimental testing of the performance of an outdoor LiBr-water solar thermal absorption cooling system with a cold store, Solar Energy, 84(5): 735744. doi:10.1016/j.solener.2010.01.013 [ Links ]
Casals, X. G. (2006). Solar absorption cooling in Spain: perspectives and outcomes from the simulation of recent installations. Renewable Energy, 31(9): 1371-1389. [ Links ]
Duffie, J. A. and Beckman, W. A. (2006). Solar engineering of thermal processes. 3rd edition. New York: John Wiley. [ Links ]
Edwards, C. (2011). Performance assessment of solar absorption cooling for Ontario housing, MASc Thesis, Carleton University, Ottawa, Ontario, Canada. [ Links ]
Eskom. (n.d.) Demand side management: air conditioning facts [Online]. [ Links ] Available: www.eskom.co.za. (Accessed July 20 2012).
Hang, Y., Qu, M. and Zhao, F (2011). Economical and environmental assessment of an optimized solar cooling system for a medium-sized benchmark office building in Los Angeles, California: Renewable Energy, 36(2), 648-658. [ Links ]
Haw, M. and Hughes, A. (2007). Clean energy and development for South Africa: Background Data. Report 1 of 3. Energy Research Centre, University of Cape Town. [ Links ]
Henning, M. (2005). Solar assisted air-conditioning of buildings - an overview. Proceedings of the Heat-SET 2005 Conference 5-7 April, Grenoble, France. Grenoble: Editions-GRET. [ Links ]
Li, Z. F. and Sumathy, K. (2002). Performance study of a partitioned thermally stratified storage tank in a solar powered absorption air conditioning system. Applied Thermal Engineering, 22(11):1207-1216. [ Links ]
Mittal, V, Kasana, K.S. and Thakur, N.S. (2006). Modelling and simulation of a solar absorption cooling system for India. Journal of Energy in Southern Africa, 17(3) 65-70. [ Links ]
New, M., Lister, D., Hulme, M. and Makin, I. (2002). A high-resolution data set of climate over global land areas. Climate Research, 21:1-21. [ Links ]
Pietruschka, D. (2010). Model based control optimisation of renewable energy based HVAC systems: solar driven absorption and open dessicant evaporative cooling. Ph.D Thesis: De Montfort University and University of Applied Sciences Stuttgart. [ Links ].
REHAU Polymer Limited. (n.d. [ Links ]). [Online] Available: http://www.rehau.co.za/094B4D9CA7EFB95BC12579590058BFFE _33BE485874AD15A0C12570EB002C8401.shtml. (Accessed 30 May 2012).
Sakellari, D. (2005). Modelling the dynamics of domestic low temperature heat pump heating systems for improved performance and thermal comfort - a systems approach. PhD Thesis: Royal Institute of Technology, Sweden. [ Links ]
South African Reserve Bank. (2012). [ Links ] [Online] Available: www.resbank.co.za. (Accessed 1 June 2012).
Received 10 January 2012
Revised 21 January 2015

