


Servicios Personalizados
Articulo
 Inglés (pdf)
 Articulo en XML
 Referencias del artículo
Indicadores

Links relacionados
-
 Citado por Google
 -
 Similares en Google
Compartir

 Permalink
Journal of Energy in Southern Africa
versión On-line ISSN 2413-3051
versión impresa ISSN 1021-447X
J. energy South. Afr. vol.26 no.1 Cape Town feb. 2015
Assessing possible energy potential in a food and beverage industry: Application of the IDA-ANN-DEA approach
Oludolapo A OlanrewajuI; Josiah L MundaI; Adisa A JimohII
ICentre for Energy and Electric Power, Tshwane University of Technology
IIDepartment of Electrical Engineering, Tshwane University of Technology
ABSTRACT
In the food and beverage industry, where growing, processing, packaging, distribution, storage, preparation, serving and disposing of food is the order of the day; energy consumption becomes an important input. Various energy models have been developed since the early 1970s, the period when energy caught the attention of policymakers due to the sudden price increase. Among the models are the index decomposition analysis (IDA), artificial neural network (ANN) and data envelopment analysis (DEA). The purpose of this study is to combine the strengths of these models, i.e., IDA, ANN and DEA, to allow biases in one model to offset biases in the other, so as to examine the effectiveness of energy management policies in a particular food and beverage industry. The integrated model applied to the food and beverage revealed that approximately 11% of energy consumed could be saved.
Keywords: IDA; ANN; DEA; integrated model; food and beverage industry
1. Introduction
A thorough analysis on how energy is consumed in an industry is important as it investigates the possibility of potential energy saving in the industry. Factors responsible for the consumption of energy are the activity, structure and efficiency changes. Understanding these factors will give insight into whether energy is used efficiently and the possibility of its saving.
Energy-saving is an important task today and in the future. The implementation of energy-saving policies can promote the structural adjustment of industries and products, and affect the enhancement of energy efficiency in production and processing (He et al., 2011). The analyses of consumption patterns and the assessment of feasible energy conservation possibilities show that the potential for energy conservation in the industrial sector and in all sectors is substantial (Yang and Mingguang, 2011).
From energy studies, different tools have been successfully used to analyse the consumption of energy. These include index decomposition analysis (IDA), structural decomposition analysis (SDA), regression analysis, artificial neural networks (ANNs) and data envelopment analysis (DEA). The aim of this study is to combine the strengths of various energy research tools to analyse energy consumption and to assist in formulating sustainable policies for industries in the energy arena. The strengths of IDA, ANN and DEA are integrated for this study. The integration of these models has been successfully applied to Canadian industries (Olanrewaju, Jimoh & Kholopane, 2012), and South African industries (Olanrewaju, et al., 2013). However, its application to a specific industry as opposed to a set of industries is yet to be carried out. This study focuses on a particular food and beverage industry, as a case study.
The rest of this paper is organized as follows: the next section introduces the literature review on studies regarding energy analysis. A description of the general integrated method based on IDA, ANN and DEA is presented. Details of the proposed method are discussed in section three. These include use of: the LMDI (Logarithmic Mean Divisia Index) for decomposition of the various factors responsible for energy consumption, the ANN model for prediction; regression analysis for authentication; and, the DEA sub-model for energy optimization. The integrated model is applied to a particular food industry and beverage industry. Results and discussion are presented, as well as the conclusion on the case study, in the last section.
2. Literature review
IDA and SDA are similar, but differ in the fact that IDA is developed from index theory of economics, while SDA is based on an input-output table from statistics (Fengling, 2004). These decomposition methods make it possible to evaluate the relative contributions of various factors to changes in energy consumption, energy intensity and CO2 emissions (Mairet and Decellas, 2009). Many studies have successfully carried out their investigation using decomposition analysis. Among the studies are APERC (APERC, 2001), where second decomposition analysis was conducted taking into account the composition of the service sector. It was discovered that activity and intensity effects were responsible for the changes in energy consumption compared with other effects. Golove and Schipper ((1997) found that the activity effect was the major factor affecting energy demand and drove energy consumption upward in their study to analyse changes in energy consumption in the United States from 1960 to 1963 using a decomposition method based on the Laspeyres index.
Gonzalez and Suarez (2003) studied the changes in electricity intensity in the Spanish industry by decomposition to explain the factors that contribute to the changes. Combined with electricity price analysis, the results of their study indicate poor contribution of structural change to substantial reductions in aggregate electricity intensity. Factors affecting the trends in energy efficiency in South Africa from 1993 to 2006 were examined by Inglesi-Lotz and Pouris (2012). It was determined that structural changes of the economy have played an important and negative role in the increasing economy-wide energy efficiency whereas the energy usage intensity was a contributing factor to the decreasing trend of energy efficiency.
Planning and conducting necessary measures to attain specified objectives is made possible by reliable prediction techniques. These techniques include regression analysis and neural networks, though the soft computing techniques (the neural networks) have proved to be superior to the conventional method (i.e., regression analysis). These techniques have been applied to energy studies successfully. Sozen and Arcaklioglu (2007) used artificial neural network to predict the net energy consumption of Turkey in order to determine the future level of the energy consumption and make correct investments. In their study, three neural network models were developed (Sozen and Arcaklioglu, 2007). South Korea's heavy dependence on imported energy sources led Geem and Roper (2009) to efficiently estimate the country's energy demand using ANN. The result of the ANN model proved superior to the regression and exponential models compared with Geem and Roper (2009).
ANN model has been successfully used to predict energy use in wheat production (Safa and Samarasighe, 2011). Several direct and indirect factors were considered in the study to create the ANN model, and it predicted energy use with an error margin of (+/-) 12% in the Canterbury farms. Ekonomou (2010) successfully used ANN to predict Greek long-term energy consumption for the years ahead, exploiting its computational speed, ability to handle complex non-linear functions, robustness and great efficiency even in cases where full information for the studied problem is absent.
DEA, an application of linear programming, has the ability to give a single index of performance, usually called the efficiency score, synthesizing diverse characteristics of decision making units (DMUs) (Azadeh et al., 2008). Among the energy related studies approached by DEA are the studies of Hu and Kao (2007) and Liu et al.., (2010). Hu and Kao (2007) set the energy-savings target using DEA for APEC economies without lowering their maximum potential gross domestic product in any year. It was found that China was in the lead with energy-saving goals. The operational performance of thermal power plants in Taiwan using data envelopment analysis was assessed by Liu et al., (2010). The power plants investigated achieved acceptable overall operational efficiency from 2004-2006, with the combined cycle power plants being the most efficient.
From the literature review, it can be concluded that the decomposition tools focus on analysing and understanding historical data. Prediction techniques on the other hand serve as an aid for recommending and specifying opportunities to reduce irrational energy use (Kljajic et al., 2012). DEA from various studies determines the efficiency and optimization capabilities.
IDA, ANN and DEA models are all powerful analytical tools as presented in this section, but have their weaknesses and limitations. Based on our survey, these models could be helpful to researchers in energy issues like identifying the relative contributions of different factors to changes in energy demand, prediction and forecasting of energy consumption for short- and long-term planning. Benchmarking performance to determine the potential of energy that could be saved has also been explored among the various industries. This research underlines the gaps of the individual energy models as far as energy analysis is concerned, and highlights the reasons why integration of the right models is necessary.
3. Proposed method
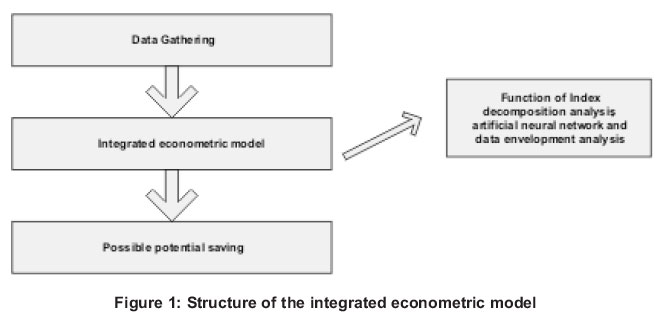
Use of combined approaches is beneficial as these techniques seem to be able to take advantage of the best characteristics of all the techniques which comprise the combination. Combining different approaches allows biases in one technique to offset biases in other techniques (Bhattacharyya, 2011). The integrated econometric model developed for this investigation is an analytical tool to estimate how much energy saving could have been saved expressed by some variables that were given to the model. The model is a function of index decomposition analysis, artificial neural network and data envelopment analysis as depicted in Figure 1.
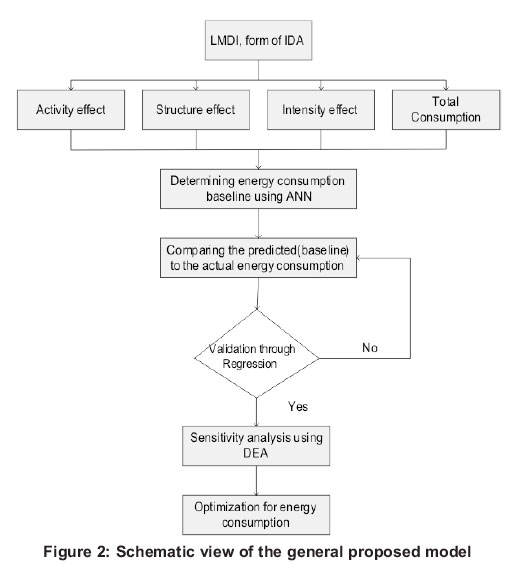
This study employs an integrated approach based on IDA, ANN and DEA for total energy efficiency assessment and optimization of energy consumption in the food industry. The model's conceptual framework is shown in Figure 2. Steps to be followed in the generic proposed model can be summarized as follows:
1. An IDA based on LMDI is performed to assess the respective contributions of activity, structural and intensity effects on the food industry.
2. Energy consumption baseline is predicted using ANN. Activity, structure and intensity effects are selected as the ANN inputs, while the observed energy consumption is the output indicator.
3. The predicted baseline result is verified and validated using regression analysis.
4. With the aid of a super-efficient DEA sub-model, energy consumption is calculated using a sensitivity-analysis approach.
5. Suggestions for optimization of energy consumption are proposed to be applied in the food industry.
3.1 LMDI
There are various IDA methods, but the most preferred IDA is the LMDI, similar to other IDA methods, and can adopt either a multiplicative or an additive mathematical form in a time-series or base-year method. The differences between the time-series and the base-year method can be found (Granel, 2003) and (Ma and Stern, 2006). For our study, the time-series for both multiplicative and additive mathematical forms are adopted. The reason behind the use of additive form is to be able to understand easily the factors responsible for the consumption of energy, while multiplicative form is to assist in the integration model because of its non-negativity, especially when it concerns DEA application. The multiplicative and additive decomposition form decompose from the relative growth of an indicator I into determinant effects (Hoekstra and Bergh, 2003).
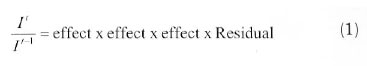
The residual term for LMDI decomposition is always unity. Where energy consumption is the indicator for this study, equation (1) can be rewritten as:
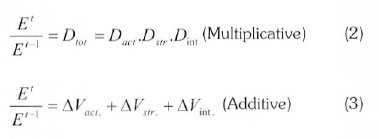
The LMDI (multiplicative) takes the following form
Where
The LMDI (additive) takes the following form
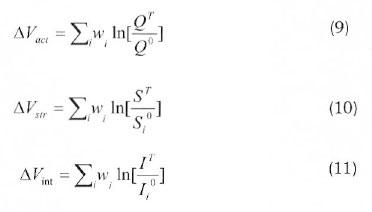
Where
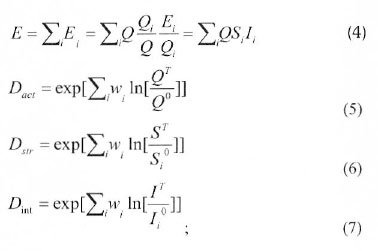
The variables used for the decomposition analysis
Ei - Total energy consumption in sector i
E - Total energy consumption 
Qi - Value of production in sector i 
Q - Total value of production 
Si - Production share of sector
Ii- Intensity of energy consumption in sector 
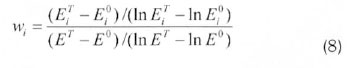
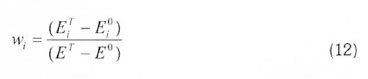
Where Dtotand ∆Vtot represent the total energy consumption, Dact and ∆Vact, the activity involved, Dstr and ∆Vstr, the structural change and Dint and ∆Vint, the change in intensity. The derivation of the above equations can be found in (Ang, 2008).
3.2 ANN
ANNs are well-known massive, parallel computing models which exhibit excellent behaviour in solving problems associated with engineering, economics, etc. The most commonly applied network is the multilayer perceptron with the error backpropaga-tion learning algorithm (Mata, 2011). For the neural network methodology, we refer interested readers to the paper (Rumelhart et al., 1986) for details of the methodology.
3.2.1 Problem formulation
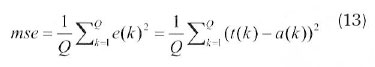
The objective function chosen for this problem is the mean square error (MSE) between the outputs from the neural network and the target value which is the energy consumption. The inputs are applied to the network; and similarly the network output is compared to the target. The error is calculated as the difference between the target output and the neural network output. The goal is to minimize the average of the sum of these errors.
The least mean square error (LMS) algorithm adjusts the weights and biases of the linear network so as to reduce the mean square error. The architecture of this network comprises of three layers namely the input, hidden and output layers, with each layer having one or more neurons, in addition to the bias neurons connected to the hidden and output layers. The computational procedure of the network is described below (Hsu and Chen, 2003):
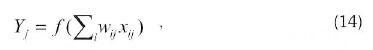
where Yj is the output of node j, the transfer function, wij the connection weight between node j and node i in the lower layer, and Xj the input signal from node in the lower layer. The backpropagation is based on the steepest descent technique with a momentum weight (bias function) which calculates the weight change for a given neuron. It is expressed as follows (Hsu and Chen, 2003, Huang et al., 2002): let

denote the synaptic weight connecting the output of neuron i to the input of neuron j in the pth layer at iteration The adjustment  to
to  is presented as:
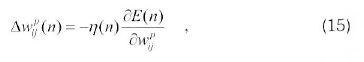
where η (n) is the learning-rate parameter. By applying the chain rule of differentiation, the weight of the network with the backpropagation learning rule is updated, using the following formulae:
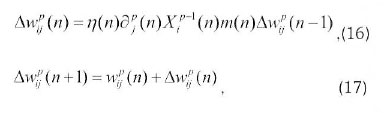
where  is the nth error signal at the jth neuron in the pth layer,
  is the output signal of neuron i at the layer below and m is the momentum factor.
3.3 Linear regression analysis
Performance of neural networks can be measured to some extent by the sum squared error, but it is useful to investigate the response in more detail. One of the options is to perform a regression analysis between the network response and the corresponding targets (Gonzalez, 2008).
According to Gonzalez (2008), the validation analysis leads to 3 parameters. The first two m and b correspond to the slope with the y-intercept of the best linear regression, relating targets to neural network outputs. To ensure a perfect fit (outputs exactly equal to targets), the slope would be 1, and the y-intercept would be 0. The third parameter is the correlation coefficient (R-value) between the outputs and targets. There is a perfect correlation between the targets and outputs if the R-value is equal to 1.
3.4 DEA
This study makes use of the input-oriented Charnes-Cooper-Rhodes (CCR) model of a DEA. The input model reduces the inputs while satisfying the lowest given output (Liu et al., 2010). The efficiency scores obtained from the input-oriented model for inefficient months/years (DMU) deal with the potential of conservation in the observed energy consumption.
The model to the CCR is given below (Liu et al., 2010; Emmanuel, 2001):
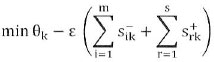
subject to:
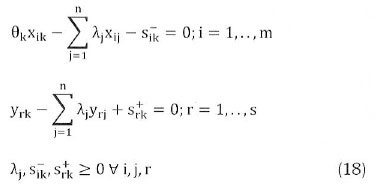
where θkis the measure of efficiency of DMU 'k, the DMU in the set ofj = 1,2,..n DMUs rated relative to the others; ε an infinitesimal positive number used to make both the input and output coefficients positive; s-ikslack variables for input constraints, which are all constrained to be nonnegative; s+jk slack variables for output constraints, which are all constrained to be non-negative; and λj the dual weight assigned to DMUs.
3.4.1 'Sensitivity analysis and optimization' using the DEA sub-model
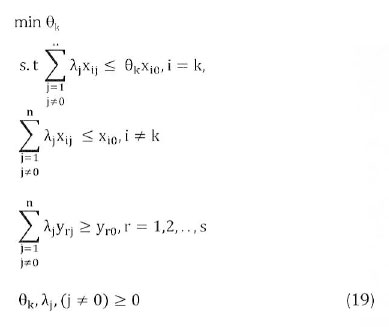
The input-oriented, measure-specific super-efficiency DEA model proposed by Zhu (2003) was adopted for the sensitivity analysis. Constant return to scale (CRS) was assumed. In the model 19, the kth input is given priority to change to its value.
The sensitivity analysis result for an efficient DMU will assist in determining the increase in energy consumption, yielding an inefficient DMU. It can be assumed that the decrease in energy consumption could make an efficient DMU of an inefficient DMU.
3.4.2 Optimization of energy consumed
The optimal value of a DEA sub-model shown in model 18 (θ*) for an inefficient DMUo, is the minimum reduction in energy consumption that causes DMUo to be a best-practice DMU and an efficient DMU on the frontier for the observed energy consumption (input). When xi0is the energy consumption of DMUo, θ*xi0is the amount of potential reduction in energy consumption that can be compared to the best observed DMU. The potential of a saving in energy consumption decreases as the optimal value of the energy consumption in model 18 increases. The reduction (θ*xi0) in the input is the optimal reduction in energy consumption that makes DMUo an efficient DMU.
3.5 Case study
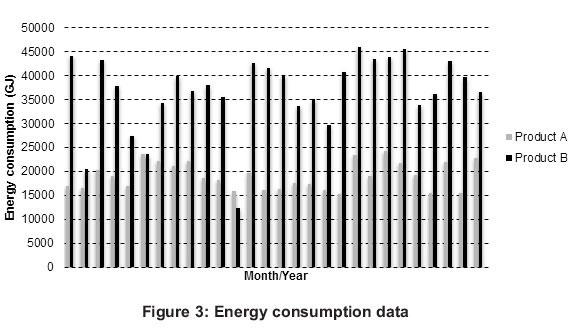
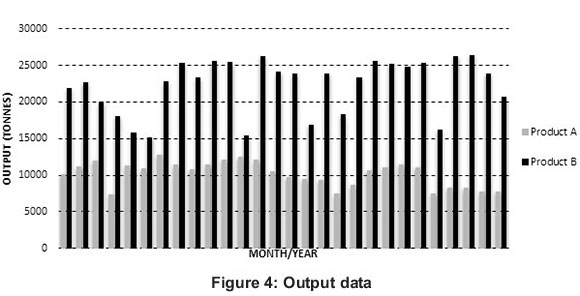
In this paper, we analyse a specific food and beverage industry for the possible energy potential that could be saved between January 2010 and April 2012 of one of the South African industrial sectors. Data used; Figures 3 and 4 are the energy consumption and output production data used for products A and B in the particular industry. The productions (Products A and B) are all given in tonnes and the energy consumption in gigajoules.
3.6 Results and discussion
3.6 1 LMDI Decomposition analysis Both additive and multiplicative decomposition were employed for this case study because of the negativity result in energy consumption from additive decomposition. To be able to employ data envelopment analysis, the data inputted into the DEA model must be non-negative. Additive decomposition was employed to be able to understand the factors responsible for the consumption of energy in a simplified fashion. Multiplicative decomposition was employed because of the non-negativity result.
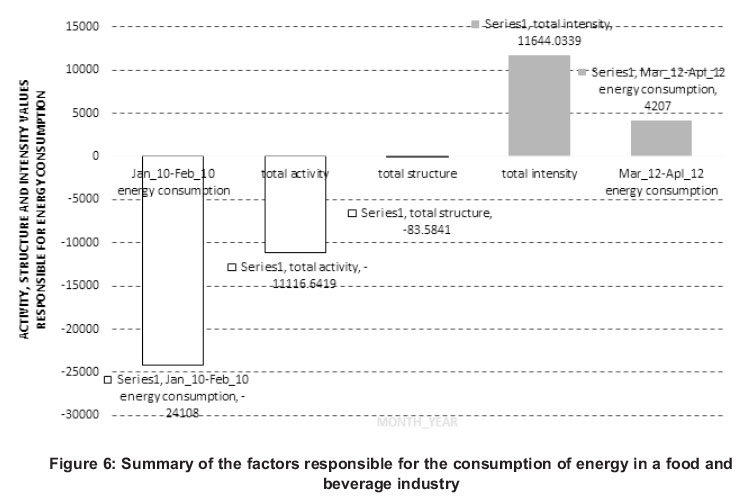
Factors responsible for the consumption of energy are the activity, structure and intensity changes. Understanding these factors give insight as to whether energy is used efficiently and the possibility of its saving. Figures 5 and 6 depict the effect of these factors.
The intensity effect measures improvements in energy efficiency, changes in technology, fuel mix changes, efficient energy management practice as well as any other factor which is not related to volume of output or composition. If this effect is positive, then it implies a worsening energy efficiency scenario. A negative intensity effect points to improvements in energy use. From Figure 5, the intensity effect gained unswerving positivity in February 2010 - April 2010, July 2010 -September 2010, December 2010 - March 2011, and from April 2011 - June 2011. The structural effect measures the changes in composition. In general, if the structural effect is positive, there is a movement towards more energy intensity. From Figure 5, the structural effect gained unswerving positivity in March 2010 - June 2010, October 2010 - December 2010, January 2011 - March 2011, July 2011 - September 2011 and February 2012 - April 2012. The activity effect is positive when more output can be produced with the same energy use. This effect implies an improvement in energy efficiency when positive. From Figure 5, the activity effect gained unswerving positivity in June 2010 - August 2010, September 2010 - November 2010, June 2011 - September 2011 and December 2011 - February 2012. Figure 6 summarizes the total effects of these factors.
From Figure 6, the consumption of energy increased by 673% from the period January 2010-February 2010 and to the March 2012-April 2012 period. For activity effect, changes in the level of activity between 2010 and 2012 are considered, keeping the intensity and share of food industry in value addition unchanged in the initial year values. This implies that if activity would have changed alone, the energy demand for the food industry activities considered would have reduced by 11116.6 GJ.
For the structure effect, the structural change within the period is considered while keeping the other two factors unchanged. This suggests that the share of the food industry's activities in the industrial output has reduced and if this only had changed, the energy demand would have reduced 83.58GJ.
Finally for the intensity effect, we look at the changes in energy intensity within the period under investigation and keep the other two factors at their initial values. This suggests that the intensity in the food industry has increased and their intensity would have increased the energy demand by 11644GJ between 2010 and 2012 if other things did not change. It can be concluded that from the period under investigation, energy has not been consumed efficiently from Figure 6.
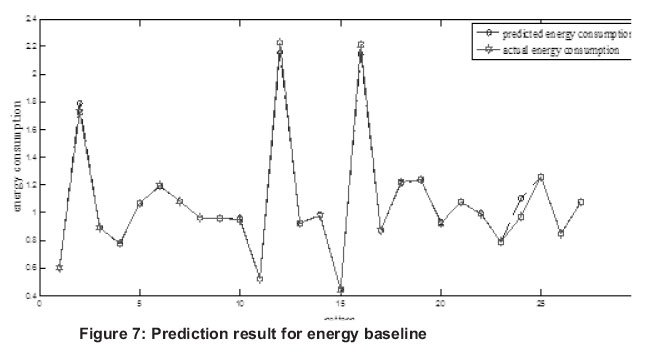
3.6.2 ANN results
To attain the specified objectives of the study, the baseline was predicted using a reliable prediction technique, ANN. For the prediction technique; activity, structure and intensity were the inputs while the actual energy consumption was the output. It was discovered that a strong correlation exists between the baseline (predicted energy consumption) and the actual energy consumption. Figure 7 presents the results. For the prediction, '5' hidden neurons was used, with activation functions of tan-sig and purelin. Trainlm was used under Matlab 2010a software.
3.6.3 Regression analysis
To confirm and validate the ANN's result, linear regression analysis is a likely confirmation method to the neural network model between the predicted and corresponding energy consumption values. The analyses lead to a line y=a +bx where y is the output (predicted energy consumption) and x is the input (observed energy consumption), b is the coefficient of the input (the gradient) and a is the slope with a correlation coefficient of R2. A perfect prediction would give, b=1 and R2 = 1.
A graphical output provided by this confirmation analysis is depicted in Figure 8. The predicted energy consumption was plotted against the actual energy consumption. From Table 1 and Figure 8, the neural network can be seen to predict correctly. It should be noted that b and R2 are very close to 1 respectively from Table 1.

3.6.4 DEA results
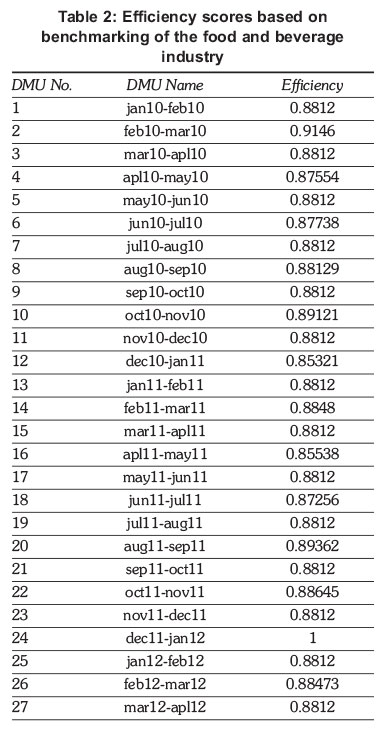
To be able to determine the possible energy saving for the period of study, DEA analysis was carried out. DEAFrontier software package on Excel has been employed to carry out the DEA analyses. The observed energy consumption was selected as the input whereas the predicted energy consumption was selected as the output data for the analyses. The efficiency scores of the food and beverage industry in different months/years (DMUs) are shown in Table 3. These efficiency scores are relative to the best performing months/years.
With internal benchmarking based on the month/year of consumption of energy, December 2011 - January 2012 was discovered to have performed better and can serve as the only benchmark to the other periods considered. Table 2 presents the efficiency score based on the comparison of the months/years following the CRS assumption. For this case study, the DMU was considered to have low energy consumption in comparison to the others. The inefficient DMUs should consider the efficient DMU as a peer to enable them to be efficient. To be able to register the energy consumption that will enable the inefficient years optimal in the DEA analyses, they must try to emulate the efficient month/year. The efficiency score of each DMU is a coefficient that indicates the amount of potential savings possible in energy consumption. The potential of energy consumption improvement can best be derived from the results of optimization analyses.
3.6.5 Optimization of energy consumed
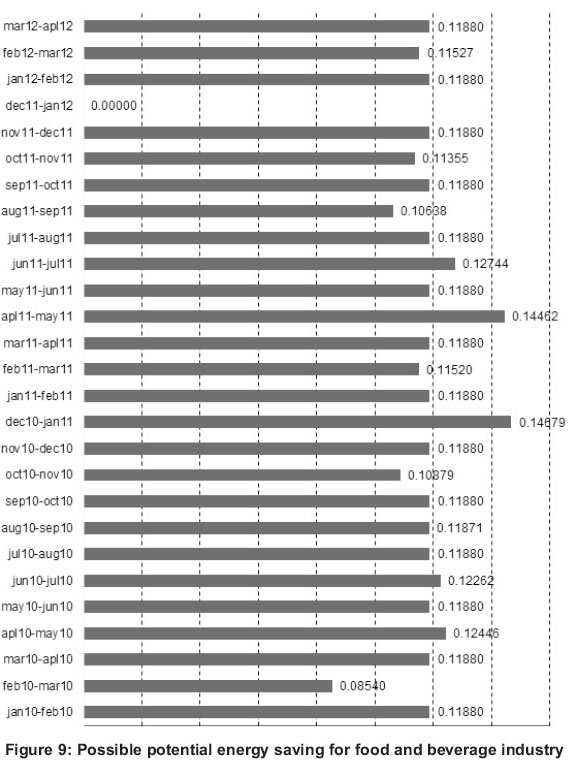
Optimization with the aid of model 19 has been applied. For example, industrial sectors in January 2010-Feruary 2010 will encounter a potential savings of (100-88.12 = 11.88) % in energy consumption compared to the best practice in December 2011-January 2012. Industrial sectors in January 2010-February 2010 can reduce their energy consumption by 11.88% and be an efficient industrial sector. Figure 9 relates the consumption to the percentage amount of energy that would have been saved if the periods emulated December 2011 -January 2012 practice. In summary, the amount of energy that could have been possibly saved is 11% of the total energy consumed for the whole period under study, which is equivalent to 171,533.78GJ.
4. Conclusion and discussion
Energy is a priority in the food industry. The food and beverage industry researched has plans in place to optimize the utilization of equipment to alleviate unnecessary running to reduce its energy consumption. To ensure the further reduction of its energy consumption, it becomes critical to conduct energy efficiency investigation to realize its dreams. Accordingly, to assess its energy efficiency potential, this investigation employed IDA-ANN-DEA approach. It was argued that seasonal effects could be the reason for the efficient period, i.e. December 2011-January 2012, though couldn't be confirmed. The seasonal effect argument is false as productivity is not the measure of output but the ratio of output to input. Considering the result obtained; other similar period, i.e. December 2010-January 2011 which is similar with the operations performed as the efficient period was inefficient, this simply nullifies the argument of seasonal effects. The result of the analyses identified factors responsible for the industry's energy consumption, baseline for energy consumed and possible potential saving. This study discovered possible potential saving of 171,533.78GJ during the period of investigation. Following the study carried out, existing energy efficiency strategies, energy conservation schemes and policies for the industry should be evaluated. The case study shows that energy intensity is an informative and practical indicator. Energy-conservation policy can be improved by considering the information from the analysis of the energy intensity. There is need for assistance in developing energy management capability and policy package to promote energy efficiency as required. It is required that the food and beverage industry needs a more aggressive energy-conservation policy to reduce its energy consumption.
5. Limitation and future research
Following the integrated model employed for this study, it should be noted that index decomposition analysis was performed on the Matlab 10.0 platform, artificial neural network o the Matlab 10.0 platform, and data envelopment analysis on the Excel platform (DEAFrontier). It is recommended that a programme that can integrate the three models on the same platform should be considered and this is ongoing for future research, as this will increase the simplicity of the system proposed.
References
Ang, B. W. (2008). Index Decomposition Analysis Using LMDI: A Simple Guide. [ Links ]
APERC (2001). Energy Efficiency .ndicators - A study of Energy Efficiency Indicators in APEC Economics, APERC, Tokyo. [ Links ]
Azadeh, A., Ghaderi, S. F & Maghsoudi, A. (2008). Location optimization of solar plants by an integrated hierarchical DEA PCA approach. Energy Policy, 36, 3993-4004. [ Links ]
Bhattacharyya, S. C. (Ed.). (201)1. Energy Economics. Concepts, Issues, Markets and Governance: Springer-Verlog London Limited. [ Links ]
Ekonomou, L. (2010). Greek long-term energy consumption production using artificial neural networks. Energy, 35, 512-517. [ Links ]
Emmanuel, T. (ed.) (2001). Introduction to the Theory and Application of Data Envelopment Analysis: A Foundation Text with Integrated Software, Norwell, Massachusetts: Kluwer Academic Publishers. [ Links ]
Fengling, L. (2004). Decomposition Analysis Applied to Energy: Some methodological issues. A thesis submitted for the degree of Doctor of Philosophy. National University of Singapore. [ Links ]
Geem, Z. W. & Roper, W. E. (2009). Energy demand estimation of South Korea using artificial neural network. Energy Policy, 37, 4049-4054. [ Links ]
Golove, W. H. & Schipper, I. J. (1997). Restraining carbon emissions and measuring energy use and efficiency in the USA. Energy Policy, 25, 803-812. [ Links ]
Gonzalez, P. F. & Suarez, R. P. (2003). Decomposing the variation of aggregate electricity intensity in Spanish industry. Energy, 28, 171-184. [ Links ]
Gonzalez, R. L. (2008). Neural Networks for Variational Problems in Engineering., Technical University of Catalonia. [ Links ]
Granel, F. (2003). A Comparison Analysis of Index Decomposition Methods. Masters Degree, National University of Singapore. [ Links ]
He, Y X., Zhang, S. L., Zhao, Y. S., Wang, Y. J. & Li, F R. (2011). Energy-saving decomposition and power consumption forecast: The case of Liaoning province in China. Energy Conversion and Management, 52, 340-348. [ Links ]
HoekstrA, R. & Bergh, J. J. C. J. M. V. D. (2003). Comparing structural and index decomposition analysis. Energy Economics, 25, 39-64. [ Links ]
Hsu, C.-C. & Chen, C.-Y. (2003). Regional load forecasting in Taiwan-applications of artificial neural networks. Energy conversion and Management, 44, 1941-1949. [ Links ]
Hu, J.-L. & Kao, C.-H. (2007). Efficient energy-savings targets for APEC economies. Energy Policy, 35, 373-382. [ Links ]
Huang, H., Hwang, R. & Hsieh, J. (2002). A new artificial intelligent peak power load forecaster based on non-fixed neural networks. Electric Power Energy Syst, 24, 245-50. [ Links ]
Inglesi-Lotz, R. & Pouris, A. (2012). Energy efficiency in South Africa: A decomposition exercise. Energy, 42, 113-120. [ Links ]
KljajiC, M., Gvozdenac, D. & Vukmirovic, S. (2012). Use of Neural Networks for modeling and predicting boiler's operating performance. Energy, in press. [ Links ]
Liu, C. H., Lin, S. J. & Lewis, C. (2010). Evaluation of thermal power plant operational performance in Taiwan by data envelopment analysis. Energy Policy, 38, 1049-1058. [ Links ]
Ma, C. & Stern, D. I. (2006). China's Changing Energy Intensity Trend: A Decomposition Analysis. Rensselaer Working Papers in Economics. [ Links ]
Mairet, N. & Decellas, F. (2009). Determinants of energy demand in the French service sector : A decomposition analysis. Energy Policy, 37, 2754-2744. [ Links ]
Mata, J. (2011). Interpretation of concrete dam behaviour with artificial neural network and multiple linear regression models. Engineering Structures, 33, 903-910. [ Links ]
Olanrewaju, O.A., Jimoh,A.A., & Kholopane PA. (2013). Assessing the energy potential in the South African industry. A combined IDA-ANN-DEA (Index Decomposition Analysis-Artificial Neural Network-Data Envelopment Analysis) Energy, 63, 225 - 232. [ Links ]
Olanrewaju, O.A., Jimoh,A.A., & Kholopane PA. (2012). Integrated IDA-ANN-DEA for assessment and optimization of energy consumption in industrial sector. Energy, 46, 629 - 635. [ Links ]
Rumelhart, E., Hinton, G. E. & Williams, R. J. (eds.) (1986). Learning Internal Representations by Error Propagation in Parallel Distributed Processing 1, Cambridge, MA: MIT Press. [ Links ]
Safa, M. & Samarasighe, S. (2011). Determination and modelling of energy consumption in wheat production using neural networks: 'A case study in Canterbury province, New Zealand'. Energy, 36, 5140-5147. [ Links ]
Sozen, A. & Arcaklioglu, E. (2007). Prediction of net energy consumption based on economic indicators (GNP and GDP) in Turkey. Energy Policy, 35, 4981-4992. [ Links ]
Yang, G. & Mingguang, L. (2011). Analysis on the degree of the industrial structure's impact on the energy consumption - Based on empirical study of Guangdong Province. Energy Procedia, 5, 1488-1496. [ Links ]
Zhu, J. (ed.) (2003). Quantitative models for Performance Evaluation and Benchmarking, Netherlands: Kluwer Academic Publishers. [ Links ]
Received 3 January 2013
Revised 17 February 2015

