


Servicios Personalizados
Articulo
 Inglés (pdf)
 Articulo en XML
 Referencias del artículo
Indicadores

Links relacionados
-
 Citado por Google
 -
 Similares en Google
Compartir

 Permalink
Journal of Energy in Southern Africa
versión On-line ISSN 2413-3051
versión impresa ISSN 1021-447X
J. energy South. Afr. vol.26 no.1 Cape Town feb. 2015
Decomposition analysis of energy-related CO2 emissions in South Africa
Ming Zhang; Shuang Dai; Yan Song
China University of Mining and Technology, Xuzhou, P.R. China
ABSTRACT
South Africa has become one of the most developing countries in the world, and its economic growth has occurred along with rising energy-related CO2 emission levels. A deeper understanding of the driving forces governing energy-related CO2 emissions is very important in formulating future policies. The LMDI (Log Mean Divisia Index) method is used to analyse the contribution of the factors which influence energy-related CO2 emissions in South Africa over the period 1993-2011. The main conclusions drawn from the present study may be summarized as follows: the energy intensity effect plays the dominant role in decreasing of CO2 emission, followed by fossil energy structure effect and renewable energy structure effect; the economic activity is a critical factor in the growth of energy-related CO2 emission in South Africa.
Keywords: CO2 emission; LMDI method; South Africa
1. Introduction
Currently, global warming is considered among the most important environmental problems. Accelerating use of fossil fuels cause a significant increase in the anthropogenic greenhouse gases (GHG), which lead to global warming? Among six kinds of GHG, the largest contribution to the greenhouse effect is carbon dioxide (CO2), and its share of the greenhouse effect is about 56% (IPCC, 2014). Thus, the acceleration of CO2emission with regard to ever-increasing energy consumption has raised the concern of energy analysts and policy makers.
South Africa has become one of the most developing countries in the world, and its economic growth has occurred along with rising energy-related CO2 emission levels. It took the bold step at the end of 2009 to commit itself to the Secretariat of the United Nations Framework Convention on Climate Change (UNFCCC) in taking all the necessary actions to decrease the country's greenhouse gas emissions by 34% to below the 'business-as-usual' scenario by 2020 (Winkler et al., 2010). A deeper understanding of the driving forces governing energy-related CO2 emission is very important in formulating future policies. To accomplish this purpose, a robust approach is to decompose the evolution of energy-related CO2 emission into possible affecting factors.
Nowadays, the Index Decomposition Analysis (IDA) technique has been used successfully to quantify the impact of different factors on the change of energy consumption and CO2 emission. In the literature, two well-known IDA decomposition techniques, namely the Laspeyres index decomposition analysis and the Divisia index decomposition analysis, have been widely applied (Wang et al. 2011). So far many researchers have utilized the IDA method to identify the driving factors influencing the variation of energy consumption or related CO2emission. Based on the Laspeyres index decomposition analysis, an analysis had been made of energy consumption, efficiency and savings in China in the period 1980-94 by Sun (1998). The Laspeyres index decomposition analysis is also utilized by Reddy and Ray (2010) to study energy consumption and energy intensity in Indian manufacturing industries. Wang et al. (2005) applied the logarithmic mean Divisia index approach to study the influencing factor of the energy-related CO2emission. The LMDI technique was also utilized by Tan et al. (2011) to examine the driving forces for reducing China's CO2emission intensity between 1998 and 2008.
The IDA method has been generalized to a different method, but there is no consensus among all IDA methods as to which is the "best' decomposition method. Ang (2004) compared various methods and their advantages and disadvantages and concluded that the LMDI method was the preferred method, due to its theoretical foundation, adaptability, ease of use and result interpretation, along with some other desirable properties in the context of decomposition analysis.
Currently, several studies have focused on energy consumption in South Africa. For example, Inglesi-Lotz and Blignaut (2011) conducted a sectoral decomposition analysis of the electricity consumption for the period 1993-2006 to determine the main drivers responsible for its increase. Inglesi-Lotz and Pouris (2012) examined the factors affecting the trends in energy efficiency in South Africa from 1993 to 2006 and particularly the impact of structural changes and utilization efficiency of the country's energy intensity. So far no study has been devoted to decomposing the energy-related CO2 emission in South Africa. To deeper understand the driving forces governing energy-related CO2emission, this paper serves as a preliminary attempt to apply the LMDI method to analyse the contribution of the factors which influence energy-related CO2emission in South Africa over the period 1993-2011.
The remainder of this paper is organized as follows. The next section presents the methodologies of the study and related data. The decomposition results of CO2emission is presented in section 3. Finally, we conclude this study.
2. Methodology and data
In the first place, the method of estimation of CO2emission is presented in this section. Then we give the definition of effect factor and LMDI model formulation. In this paper, economic activity is measured by GDP (Gross Domestic Product), which is collected from SJGDP (2013).
The symbol definitions are as follows.
Ct: total CO2 emission in year t (in Million tons (Mt));
Cti :total CO2 emission based on fuel type i in year t;
Eti :total energy consumption of the fossil fuel type iin year t;
Etf: total fossil energy consumption in year t;
Et: total energy consumption in year t;
EFti=  carbon emissions factor of the ith fuel in year t;
Oi: the fraction of carbon oxidized based on fuel type i;
M: the molecular weight ratio of carbon dioxide to carbon (44/12);
GDPt: the value added in year t;
EIt =  : the energy intensity in year t;
ESti =  : the share of ith energy form to total energy consumption in year t;
FSt =  : the share of fossil energy share to total energy consumption in year t.
2.1 Estimation of CO2 emission
Following the method given by the IPCC (2014), total CO2 emission from fuel combustion is estimated based on energy consumption, carbon emission factors by fuel as follows.

The carbon emission factors for different fuel type are calculated based on the data given by IPCC, as listed in Table 1. These carbon emission factors have changed over time because of a change in grade of fuel. Because the study period 1993-2011 analysed in this paper is relatively short term, this paper assumes that the carbon emission factors of all energy forms are constant. Only three fuel types are considered in this paper, namely Oil, Coal, and Natural gas. The unit for energy is million ton oil equivalents (Mtoe). All energy data is collected from Statistical Review of World Energy (2012).

2.2 LMDI model formulation
The energy-related CO2emission in year () can be expressed as Eq. (2)
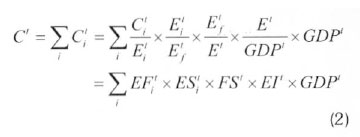
According to the LMDI method given by Ang (2004), the change of C02 emission between a base year 0 and a target year t, denoted by ∆Cttot, can be decomposed into the following determinant factors:
(i) The economic activity effect (denoted by ∆Ctgdp), which is defined as the total produced value added (GDP) from South Africa (measured in ZAR), reflecting changes in the development of economy (namely the theoretical C02 emission caused by economic activities).
(ii) The energy intensity effect (denoted by ∆Ctei). which is defined as the ratio of energy consumption to produced value added, reflecting changes in some variables like energy prices, energy conservation and energy-saving investments.
(iii) The fossil energy structure effect (denoted by ∆Ctes), which is defined as the ratio of fossil energy forms to total fossil energy consumption, reflecting changes in the relative shares of different fossil energy type:
(iv) The renewable energy structure effect (denoted by ∆Ctfs). which is defined as the ratio of total fossil energy consumption to total energy use, reflecting changes in the relative shares of renewable energy use;
(v) The emission-factor effect (denoted by ∆Ctef ). which is defined by the ratio of CO2 emission and energy consumption, reflecting changes in the fuel substitution, fuel quality and the installation of abatement technologies.
Thus, based on the LMDI method developed by Ang(2004), the difference ∆Cttot, is decomposed into its components in additive form, as illustrated in Eq. (3):
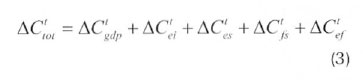
Each effect in the right hand side of Eq. (5) can be computed as follows:

Because this paper assumes that the carbon emission factors (EF) of all energy forms are constant during the study period. The value of following formula (3e) is 0.

Here, 
In the index number, we form

3. Results and discussion
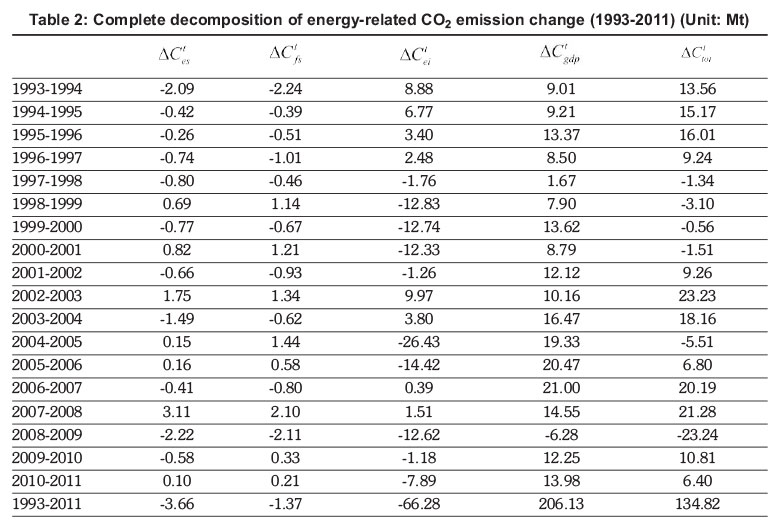
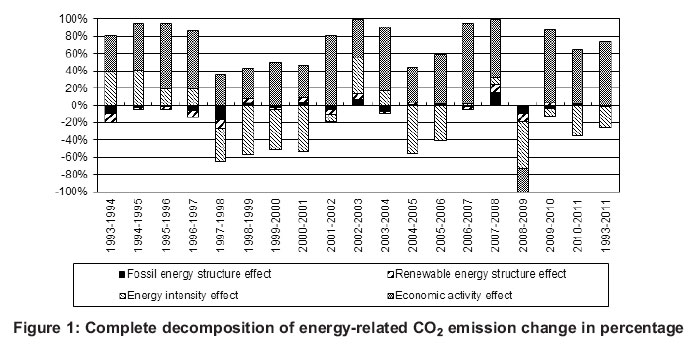
Findings obtained from the decomposition analysis are shown in Table 2 and Figure 1. The components of the decomposition analysis, i.e. ∆Ctgdp (economic activity effect), ∆Ctes (fossil energy structure effect), ∆Ctei(energy intensity effect), ∆Ctfs (renewable energy structure effect) and ∆Ctef (emission-factor effect) are calculated as given in Eqs. (3a-e), respectively. Our results show that energy intensity effect, fossil energy structure effect and renewable energy structure effect are the factors in decreasing energy-related CO2 emission in South Africa. However, the economic activity effect plays a positive impact on the growth of energy-related CO2 emission.
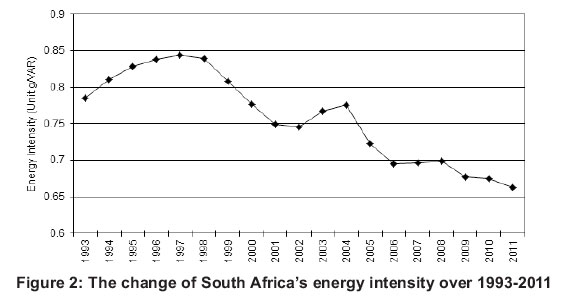
During the study period, the energy intensity effect played the dominant role in decreasing of CO2 emission, followed by energy structure effect and fossil energy structure effect. The accumulated (period-wise) effect is a decrease of 66.28Mt, which accounts for 49.16% of the total change in absolute value. The change of South Africa's energy intensity for the study period is presented in Figure 2, illustrating a general decrease in energy intensities. The trend of energy intensity has three stages. The first stage is 1993-2002; in this stage the trend of energy intensity shows an inverted U-shape, and the energy intensity reached the highest in 1997. The next stage is 2002-2005, that trend also shows a small inverted U-shape. The third stage is 2005-2011, the energy intensity decreased continuously in this stage. The decreasing trend of energy intensity can be due to the use of new process, new technologies and new equipment, especially the extensive application of energy-saving technologies and the advancement of management level (Inglesi-Lotz and Pouris; 2012). The above reason can explain why the energy intensity effect decreased CO2emission over 1993-2011.
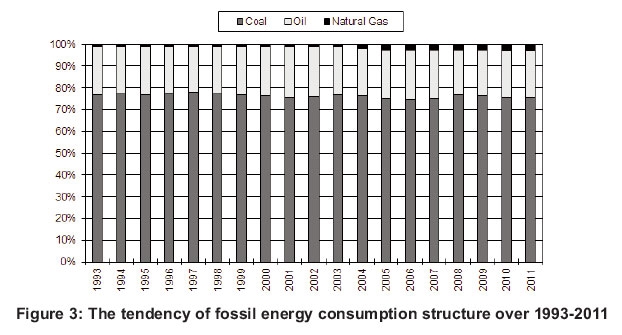
As shown in Table 2, the fossil energy structure effect was another factor decreasing CO2emission over the study period. The accumulated effect is a decrease of about 3.66Mt CO2 emissions, which only accounted for 2.72% of the total CO2emission change in absolute value. The tendency of fossil energy consumption structure over time is shown in Figure 3. There is a substitution between the increasing share of natural gas (from 1.13% in 1993 to 3.12% in 2011) and a decreasing share of coal (from 76.90% in 1993 to 75.58% in 2011) (authors' calculation based on Statistical Review of World Energy, 2012). The use of natural gas increased from 0.92Mtoe in 1993 to 3.84Mtoe in 2011, following an annual growth rate of 8.21%. However, the share of natural gas to total fossil energy consumption accounted for less than 3.2% over the period 1993-2011. During the study period, more than 75.0% fossil energy was coal in South Africa, which can explain why the energy structure effect on CO2emissions was relative small.
Table 2 also indicates that the renewable energy structure effect played a very minor role in decreasing CO2 emissions in 11 out of 19 years. The accumulated effect is a decrease of about 1.37Mt CO2 emission, which only accounted for 1.02% of the total CO2 emission change in absolute value. The tendency of the share of fossil energy consumption and renewable energy consumption over the period 1993-2011 is presented in Figure 4. During the study period, renewable energy consumption (including hydro power, nuclear power and other renewable energy) increased from 1.76Mtoe in 1993 to 3.39Mtoe in 2011, representing an annual average growth rate of 3.72%. That growth rate is faster than that of fossil energy (2.27%). Figure 4 also shows that the share of the fossil energy to total energy consumption declined from 97.89% in 1993 to 97.30% in 2011 (authors' calculation based on Statistical Review of World Energy, 2012). Though renewable energy increased quickly over 1993-2011, the decrease of the share of fossil energy was very small, which is the reason for the minor impact of renewable energy.
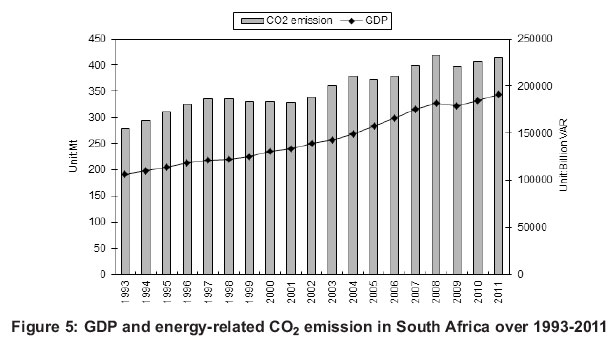
Our results show that economic activity is the critical factor in the growth of energy-related CO2 emissions in South Africa. During 1993-2011, the economic activity effect made a continual increase of CO2 emission except 2008-2009, as shown in Table 2. The accumulated (period-wise) effect is an increase of 206.13Mt, so accounts for about 152.89% of the total change in absolute value. The economic activity of South Africa (GDP) and energy-related CO2 emissions are presented in Figure 5, which show an upward trend both in CO2 emissions and GDP over this period. South Africa has experienced stable economic growth, with its GDP increasing at an average annual rate of about 3.27% over 1993-2011. Along with the economic development, energy -related CO2 emission rose from 278.13Mt in 1993 to 414.32Mt in 2011, representing an annual average growth rate of 2.23%.
4. Conclusions
Global warming is considered among the most important environmental problems. How to relieve CO2 emissions has become an urgent task of each country. South Africa has become one of the most developing countries in the world. Studying the driving forces governing energy-related CO2 emissions may help to draw energy saving and a carbon reduction policy. Thus, the LMDI method is used to analyse the contribution of the factors which influence energy-related CO2 emissions in South Africa over the period 1993-2011. The main conclusions drawn from the present study may be summarized as follows:
1. The energy intensity effect plays the dominant role in decreasing of CO2 emissions, followed by the fossil energy structure effect and renewable energy structure effect; the economic activity is the critical factor in the growth of energy-related CO2 emission in South Africa.
2. The change of South Africa's energy intensity illustrated a general decrease tendency during the study period, which also presented three different stages.
3. The tendency of the fossil energy consumption structure presented a substitution between the increasing share of natural gas and a decreasing share of coal during the study period. During the study period, renewable energy consumption increased faster than that of fossil energy.
4. During the 1993-2011, South Africa has experienced significant economic growth. Along with the economic development, energy-related CO2 emission rose from 278.13Mt in 1993 to 414.32Mt in 2011.
Acknowledgments
The authors gratefully acknowledge the financial support from the Fundamental Research Funds for the Central Universities (2013W04).
References
Ang, B.W., (2004). Decomposition analysis for policy-making in energy: which is the preferred method? Energy Policy 32, 1131-1139. [ Links ]
BP (British Petroleum), (2012). BP Statistical Review of World Energy June 2012. Available from: www.bp.com. [ Links ]
Inglesi-Lotz, R., and Blignaut, J.N., (2011). South Africa's electricity consumption: A sectoral decomposition analysis. Applied Energy 88: 4779-4784. [ Links ]
Inglesi-Lotz, R., and Pouris, A., (2012). Energy efficiency in South Africa: A decomposition exercise. Energy 42:113-120. [ Links ]
IPCC, (2014). Greenhouse gas inventory: IPCC Guidelines for National Greenhouse Gas Inventories. United Kingdom Meteorological Office, Bracknell, England. [ Links ]
Reddy, B. S., and Ray, B.K., (2010). Decomposition of energy consumption and energy intensity in Indian manufacturing industries. Energy for Sustainable Development 14, 35-47. [ Links ]
SJGDP (2013). http://www.sjgdp.cn/show.php?id=168. [ Links ]
Sun, J.W., (1998). Accounting for energy use in China, 1980-94. Energy 23, 835-849. [ Links ]
Wang, C., Chen, J.N., and Zou, J., (2005). Decomposition of energy-related CO2 emission in China: 1957-2000. Energy 30, 73-83. [ Links ]
Tan, Z.F, Li, L., Wang, J.J., and Wang, J.H., (2011). Examining the driving forces for improving China's CO2 emission intensity using the decomposing method. Applied Energy 88, 4496-4504. [ Links ]
Wang, W.W., Zhang, M., and Zhou, M., (2011). Using LMDI method to analyse transport sector CO2 emissions in China. Energy 36(10): 5909-5915. [ Links ]
Winkler, H., Jooste, M., and Marquard, A., (2010). Structuring approaches to pricing carbon in energy and trade-intensive sectors: options for South Africa. Conference 2010 putting a price on carbon: economic instruments to mitigate climate change in South Africa and other developing countries. Energy Research Centre, University of Cape Town. p. 65. [ Links ]
Received 16 June 2013
Revised 24 December 2014

