


Services on Demand
Article
 English (pdf)
 Article in xml format
 Article references
Indicators

Related links
-
 Cited by Google
 -
 Similars in Google
Share

 Permalink
Journal of Energy in Southern Africa
On-line version ISSN 2413-3051
Print version ISSN 1021-447X
J. energy South. Afr. vol.26 n.1 Cape Town Feb. 2015
SAURAN: A new resource for solar radiometric data in Southern Africa
Michael J BrooksI; Sven du ClouI; Wikus L van NiekerkII; Paul GauchéII; Corli LeonardII; Michael J MouzourisII; Riaan MeyerIII; Nic van der WesthuizenIII; Ernest E van DykIV; Frederik J VorsterIV
IDepartment of Mechanical Engineering, University of KwaZulu-Natal, Durban, South Africa
IICentre for Renewable and Sustainable Energy Studies, Stellenbosch University, South Africa
IIIGeoSUN Africa (Pty) Ltd, Stellenbosch, South Africa
IVCentre for Energy Research, Nelson Mandela Metropolitan University, Port Elizabeth, South Africa
ABSTRACT
A new resource for sun strength data in Southern Africa has been established with the commissioning of a regional network of solar monitoring stations. The Southern African Universities Radiometric Network (SAURAN) is an initiative of Stellenbosch University and the University of KwaZulu-Natal (UKZN), and consists of an initial set of ten ground stations equipped with secondary standard thermopile radiometers. SAURAN's aim is to provide a long-term record of sun strength in a region that shows excellent potential for the deployment of solar energy technologies. Instruments measuring direct normal irradiance (DNI), diffuse horizontal irradiance (DHI) and global horizontal irradiance (GHI) feed time-averaged data over 1-minute, hourly and daily intervals to a central archive from where they are accessible to the public via a website interface. Meteorological data is also provided by most of the stations. This paper gives a brief background to the SAURAN project and describes the network's operation, coverage and future expansion. Examples of solar energy irradiance plots are also provided to illustrate the information available from the SAURAN database.
Keywords: solar resource assessment, Africa, direct normal irradiance, diffuse irradiance, global irradiance
1. Introduction
The solar resource is exceptionally good over most of Southern Africa. Several of South Africa's provinces receive annual direct normal radiation levels high enough to implement concentrating solar power (CSP) projects (Fluri, 2009) and the Northern Cape has among the best resources of any region globally. South Africa's neighbours are also well-placed to exploit high levels of solar radiation. The Namibian government has recognized the untapped potential of solar energy (Namibia Ministry of Mines and Energy, 1998) and now subsidizes off-grid systems such as solar cookers and water-pumps. Botswana has identified solar energy as a key resource for reducing dependence on imported power (Mzezewa, 2009).
South Africa's Integrated Resource Plan for Electricity mandates the installation of 17.8 GW of renewable energy-based generating capacity by 2030 (Department of Energy, 2010). Of this, 8.4 GW is dedicated to photovoltaics (PV) and 1.0 GW to CSP. At present, 200 MW of CSP and 1048 MW of PV capacity are under development (Giglmayr et al., 2014), with an emphasis on local content during construction to stimulate the development of an indigenous solar energy industry.
The roll-out of CSP and PV systems across Southern Africa, together with off-grid initiatives such as solar water heater programmes, has raised the need for reliable solar resource data with which to plan projects and assess their performance. In some cases, this can be met with satellite models, however, their uncertainties are high when compared to ground stations. Vignola et al. (2007) reported root mean square errors (RMSE) ranging from 12 to 38% for hourly GHI data obtained from the GOES 8 satellite when compared to stations in the US Pacific Northwest. Myers (2013) lists RMSE values from a number of studies that fall between 18.3 and 36.1%. Although satellite-derived measurements offer greater spatial coverage, ground-based sensors will remain an essential component of integrated resource assessment programmes for the foreseeable future.
Although the Republic of South Africa (SA) has a history of sporadic radiometric monitoring campaigns, there has been no coordinated deployment of high-quality ground measurement stations for some years. From the 1980s to the mid-90s the South African Weather Bureau, now the Weather Service (SAWS) maintained a network of thermopile sensors, however, this fell into disrepair and its rehabilitation is only recently getting underway. SAWS archived data is not freely available to the public. Ciolkosz (2009) presented results from a network of silicon-based sensors operated by the Agricultural Research Council, however, these do not output research-grade data nor is the archive easily accessible.
In the last fifteen years, several universities have started radiometric measurement and research programmes, including Mangosuthu University of Technology (Brooks, 2005; Zawilska and Brooks, 2011), Stellenbosch University and the University of KwaZulu-Natal (Lysko, 2006; Brooks and Roberts, 2009; Kunene et al., 2013). Given the potential for expanding these efforts, and considering the lack of a long-term, coherent record of sun strength in Southern Africa, Zawilska et al. (2012) argued for the establishment of a formal radiometric network utilizing instrumentation at universities and elsewhere.
2. Solar monitoring networks
Although there are many solar monitoring stations operated throughout the world by government agencies, weather services, research institutes and universities, there are relatively few formal networks dedicated to the provision of data for public use. Some of these are national initiatives in which the operating agency owns the measurement stations and others are clearing houses for data obtained from instrumentation that is owned by others. Stoffel et al. (2010) provide a useful summary of data sources, including satellite-derived measurements.
Examples of ground-based solar monitoring initiatives are given in Table 1. Networks are important to research and to the success of solar energy programmes because they centralize the management of the data gathering effort, institute systematized maintenance programmes for sensors and apply quality controls that regulate the standard of data, enhancing its usefulness. They also broaden public access to data, encourage the standardization of measurement techniques and promote sound methods of data analysis.

The Baseline Surface Radiation Network (BSRN) is an initiative of the World Climate Research Programme and gathers data from over 50 stations located on seven continents. Rigorous quality checks are performed on the data (Zhang et al., 2013) before it is made available to the public free of charge, via a website. The World Radiation Data Centre (WRDC) is based in Russia and publishes measurements from over 1 000 stations, mainly as daily totals of global irradiance (Stoffel et al., 2010). The Surface Radiation Network (SURF-RAD) operates seven stations across the continental United States and is funded by the National Oceanic and Atmospheric Administration. The Atmospheric Radiation Measurement (ARM) programme is oprated by the US Department of Energy and has instruments located mainly in the USA, with three sites in the Western Pacific. The University of Oregon's Solar Radiation Monitoring Laboratory (SRML) operates a regional network of ground stations across five states of the Pacific Northwest. The data record extends back to 1977 for certain of the locations. The Bureau of Meteorology in Australia maintains a network of 10 active stations across the continent and makes historical data available to the public from several more.
In 2014 the Southern African Radiometric Network (SAURAN) was established to address the regional lack of publicly accessible, long-term, high-quality solar data of high-temporal resolution. The network is an initiative of the Centre for Renewable and Sustainable Energy Studies (CRSES) at Stellenbosch University and the Group for Solar Energy Thermodynamics at the University of KwaZulu-Natal in Durban. This paper describes the coverage and operation of the network, which offers analysts and researchers an online source of meteorological and sun-strength data from instrumentation that is carefully maintained in a centrally coordinated monitoring programme.
3. The SAURAN network
3.1 Spatial coverage
SAURAN is being implemented over several phases as monitoring stations are acquired and commissioned. In its initial phase, SAURAN consists of ten ground stations across South Africa, marked in black in Figure 1. Each station is given a three-letter identification code that forms part of the filename when data is downloaded. Six stations are located on university campuses in the cities of Stellenbosch (SUN), Port Elizabeth (NMU), Durban (KZH and KZW), Pretoria (UPR) and Bloemfontein (UFS). Four are on farms in rural areas near the towns of Vanrhynsdorp (VAN) in the Western Cape, Vryheid (VRY) in KwaZulu-Natal, Graaff-Reinet (GRT) in the Eastern Cape and near Alexander Bay in theRichtersveld region of the Northern Cape (RVD).
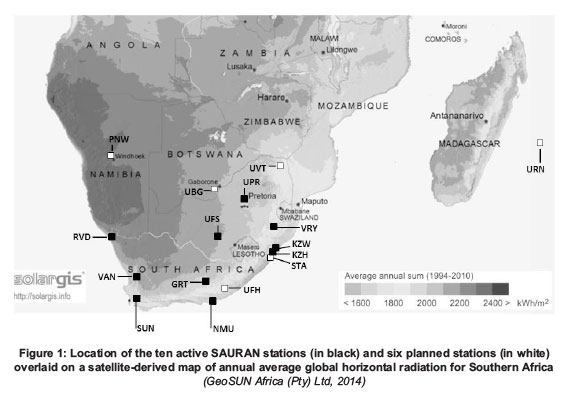
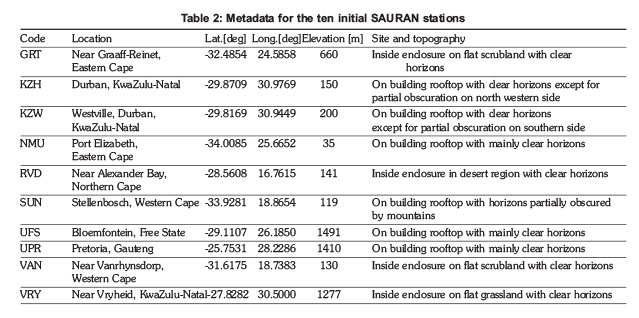
The location of the ten sites covers a range of climate and vegetation conditions, from desert through to coastal sub-tropical. Some of the stations, including SUN, KZH, KZW and NMU are existing facilities that have also contributed historical data to the archive that predate the SAURAN project. Table 2 gives the geographic coordinates of the ten SAURAN stations and a brief description of each location's surrounding topography.
In the project's second phase, stations are planned in the far northern province of Limpopo (UVT), near the town of Alice in the Eastern Cape (UFH) and at the Mangosuthu University of Technology (STA) south of Durban. Further stations are planned in the Namibian capital city of Windhoek (PNW), at Gaborone in Botswana (UBG) and on the Indian Ocean island of Reunion (URN). Subsequent phases will see the expansion of the network into Southern Africa so as to fill gaps in the network's coverage.
3.2 Instrumentation
The primary aim of the SAURAN initiative is to build a high-quality, long-term dataset of high temporal resolution for public use. To this end, the ten initial stations use research-grade secondary standard thermopile radiometers that are properly maintained and cleaned regularly. All sites measure direct normal, diffuse and global irradiance independently so that cross-checking of the radiometric components at a given location is possible through the closure equation:

where E, Ebn and Ed are measured values of GHI, DNI and DHI respectively. The responsibility for maintaining sensors belongs to the partner universities that own the stations. Data is provided to website users as 1 minute, hourly and daily averages from sensor scans conducted at sub-6 second intervals, and the time base for all readings is South African Standard Time (SAST). Users who wish to conduct further analysis of SAURAN data, such as cross-checking component values using equation (1), must supply solar vector information, such as the zenith angle. This should be adjusted to accommodate for the difference between SAST and solar time in the download files.
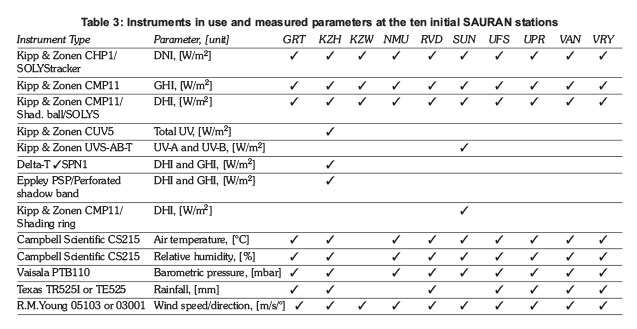
A list of the instruments in use at each of the initial ten stations is given in Table 3. Some of the sites host additional radiometers for research purposes. Stellenbosch University (SUN) operates a CMP11 under a shading ring to provide additional diffuse measurements and UVS-AB-T sensor for recording ultraviolet radiation in the wavelength ranges of 280 to 315 nm and 315 to 400 nm. UKZN Howard College (KZH) has a CUV5 sensor for UV radiation in the 280 to 400 nm range. The KZH station also hosts instruments for parallel research projects, including a Delta-T SPN1 pyranometer and an Eppley Precision Spectral Pyranometer fitted with a perforated shadow band (Brooks, 2010).
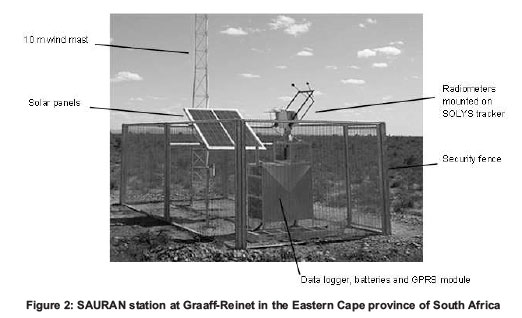
Figure 2 shows the SAURAN GRT installation located on a farm outside the town of Graaff-Reinet in the Eastern Cape Province of South Africa. As with most stations in the network, the Kipp & Zonen radiometers are mounted on a SOLYS tracker, including a CHP1 measuring DNI, a CMP11 under a shading ball measuring DHI and an exposed CMP11 for GHI. Radiometric and meteorological data, typically including air temperature, barometric pressure, wind speed, wind direction and humidity, are recorded by a CR1000 logger housed inside a waterproof enclosure and cage. All of the SAURAN stations are secured against interference and most are powered by photovoltaic systems to ensure continuity of operation and independence from the electrical grid. The GRT station is powered by two 125 W solar panels with excess energy stored in four 102 Ah batteries. The communications system includes a GPRS module that connects the station to its university-operator via the cellular telephone network.
Stations in the SAURAN network either use a similar remote communications setup or are connected directly to a local university network. Operators communicate with the stations using Loggernet software to monitor instrumentation output, battery voltages and tracker operation. This is done independently of the SAURAN database infrastructure, which is managed separately and harvests data from the stations multiple times daily to maintain the archive.
Meteorological measurements such as wind, temperature and pressure are provisioned for as supporting data to the radiometric data. While the additional measurements are recorded with good quality instruments, they are not all installed in typical meteorological measurement locations and the data is not intended for use other than to support the radiometric data. Stations located on rooftops, typically on university campuses, will record wind and temperature data only relevant to the immediate proximity of the station. The more remote stations such as GRT (near Graaff-Reinet) have meteorological stations that are more typical with 10 m mast height for wind speed and direction.
3.3 Database infrastructure and website
The information flows and architecture of the SAURAN network are represented schematically in Figure 3. The archive resides on the UKZN research server cluster to provide data security, automatic backups and an uninterruptable power supply. Radiometric data is retrieved from station loggers using Loggernet software according to a download schedule that limits the drain on storage batteries at remote locations. Most stations use modems operating on the Global System for Mobile Communications (GSM) standard. Measurements are first stored in a primary database as three tables per station; one each for minute-, hour-, and day-averaged readings. The primary database is isolated from the secondary SAURAN archive that serves the website whenever a user downloads measurements. This is to protect the primary data record. The SAURAN database is generated using custom code that automatically transfers new measurements from the primary archive at regular intervals. The website does not offer real-time data, but the time lags are typically less than 10 hours.
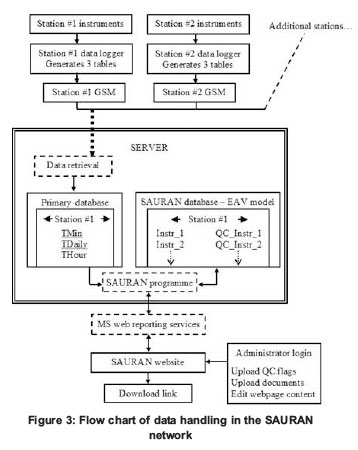
The SAURAN database is structured according to the entity-attribute-value (EAV) model, where the station is the entity, each instrument (Instr) is an attribute and the measurements constitute the values. This permits commonality of instrument names across the network and the structured ordering of columns in download files, regardless of their position in logger tables. In addition, the model facilitates data manipulation and allows administrators to add or remove instruments and quality control flags at specific stations.
The website user interface includes a map of Southern Africa with radio buttons for accessing each station in the network. Users can also access data through a list of stations that includes an updated record of the years and months containing measurements. Each station's page includes a photograph of the installation, the geographic coordinates, a list of the measurements available at the site, downloadable supporting documents and the data download tool. Supporting documents include a description of the quality control flags, acronyms and instrument calibration dates.
The data download tool packages measurements as a radiometric time-series in an ASCII text file for a specified date range at a particular station. The downloaded file is named according to the format YYYYMMDD_***_T.dat, where YYYY is the year, MM is the month and DD is the start date of the time series. To facilitate file handling, the three letter station code (***) is embedded in the filename with the averaging period (T) designated as M for minute, H for hour or D for day. Quality control flags are downloaded if the appropriate checkbox is selected. The website also provides administrative access for configuring new stations, editing instrument names and managing quality control data flags.
3.4 Data quality control
Initially, SAURAN offers a limited quality control feature in the form of downloadable flags for minute-interval measurements at selected stations. The flags are intended to warn users of potential problems in the archive and are similar to those employed by Jacovides et al. (2006). A flag, denoted as '1' in the data file, is triggered when any one of the following conditions is met:
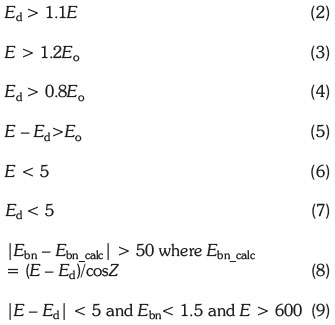
In the above, Eois the extra-terrestrial global horizontal irradiance. Equations (2) to (5) identify non-physical limits for DHI, GHI and DNI. Equations (6) and (7) eliminate night values and data close to sunrise or sunset where the cosine effect compromises pyranometer readings. Equation (8) uses the measurement redundancy of the station to identify egregious discrepancies between the calculated DNI and its measured equivalent. Equation (9) can be used to identify problems with the tracking system. In the event of a tracker failure, the misaligned pyrheliometer will read zero and the shading ball will no longer occlude the sun, such that Ed ≈ E. Fulfilment of the third condition in equation (9) suggests a non-zero DNI-component, discounting normal occlusion of the radiometers by cloud and triggering the flag for possible tracker malfunction.
In addition to the above, a quality control flag is triggered when the time difference between successive measurements is not equal to 1 minute. This identifies data gaps or anomalies related to the logger clock time. A manual flag is also provided to indicate any other known station malfunction that does not affect data in the normal way. It should be noted that the flag system is for alarm purposes only and SAURAN users are advised to run their own quality checks on all data from the site.
4. SAURAN data examples
Data can be downloaded for any period of time in minute-averaged, hour-averaged or day-averaged format. It should be noted that the selection of minute-averaged data can lead to significant volumes of data being downloaded, for example, a single day will result in 1 440 lines of information. The following examples illustrate some of the functionality and value of the SAURAN network in graphical form.
Figure 4 plots DNI measured at the Vanrhynsdorp (VAN) station on 1 May 2014. Hour-averaged DNI is superimposed on the finer resolution minute-averaged DNI data. The break in DNI during the day illustrates the differences between the average values and the range of values during that period. In order to appropriately represent that data, the hour-averaged values are shifted 30 minutes earlier, representing the mid-point of the elapsed hour.
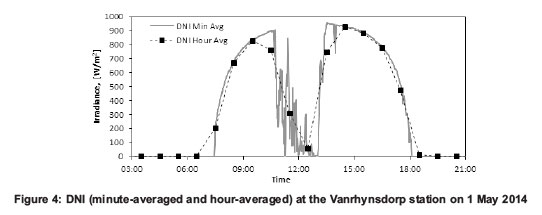
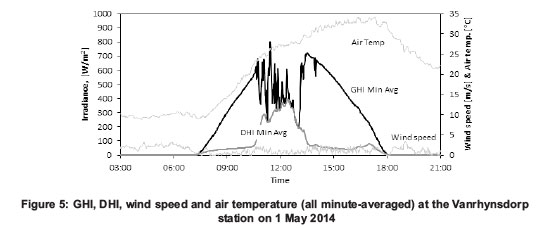
Figure 5 additionally plots GHI, DHI, wind speed and air temperature for the same location and timeframe in order to illustrate further the value of measured minute-averaged data. Not shown are other typical measurements such as relative humidity and wind direction. The value of SAURAN as a network of stations is perhaps best demonstrated by the graphical representation of solar data at five stations on 8 May 2014 in Figure 6.
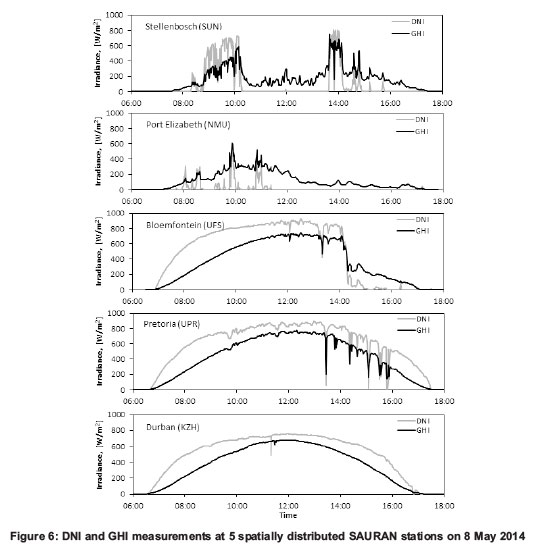
The five SAURAN stations (SUN, NMU, UFS, UPR, KZH) are more-or-less ordered from west to east and from south to north. It is clear that as the day progresses, one or more weather events causing significant degradation of DNI occur. The western and southern regions experience poor weather early. This poor weather is not experienced in Bloemfontein (central region) until early afternoon. Only Durban on the east coast shows no signs of these weather systems on that day.
Many other examples could be shown including quality control flag cases, longer time series, data validation and calibration.
5. Conclusion
The SAURAN network offers solar resource analysts simplified access to research-grade radiometric ground data in a region sparsely served by monitoring stations. Apart from its usefulness to commercial developers, agricultural planners, municipal energy departments and researchers, the database can also be used to refine satellite models of the solar resource over Southern Africa.
SAURAN measurements can be utilized with other data streams in the region for climate studies and atmospheric research. For example, aerosol optical depth (AOD) data are available from the Council for Scientific and Industrial Research in Pretoria through the Aerosol Robotic Network (AERONET). These can be used with irradiance data from the UPR station to verify and develop radiometric transmittance models. SAURAN's spatial coverage will be enhanced through further expansion of the network. It is hoped that the database will be used extensively by researchers to promote sustainable energy initiatives in sub-Saharan Africa.
Acknowledgements
The authors appreciate the support of the Deutsche Gesellschaft fur Internationale Zusammenarbeit (GIZ), the eThekwini Municipality, the United States Agency for International Development (USAID), Eskom and the National Research Foundation. We also thank Dr. Alan Matthews, Paulene Govender, Jason Freeman, Kai Broughton, Donald Fitzgerald and CS Africa for their support and assistance.
References
Brooks, M.J., (2005). The development and impact of an outdoor solar thermal test facility. Journal of Energy in Southern Africa 16:4, 67-71. [ Links ]
Brooks, M.J., (2010). A perforated shadow band for separation of diffuse and direct components from global irradiance. Solar Energy 84:12, 2179-2194. [ Links ]
Brooks, M.J., & Roberts, L.W., (2009). Establishment of a broadband radiometric ground station on the South African east coast. In: Proceedings: SPIE Conference on Optical Modelling and Measurements for Solar Energy Systems III, 7410-1, San Diego. [ Links ]
Kunene, K.R., Brooks, M.J., Roberts, L.W. &, Zawilska, E., (2013). Introducing GRADRAD: The greater Durban radiometric network. Renewable Energy, 49, 259-262. [ Links ]
Ciolkosz, D., (2009). SASRAD: An hourly-timestep solarradiation database for South Africa. Journal of Energy in Southern Africa 20:1, 25-34. [ Links ]
Department of Energy, (2010). Integrated resource plan for electricity (IRP) 2010-2030: Update report. Government of South Africa. [ Links ]
Fluri, T.P., (2009). The potential of concentrating solar power in South Africa. Energy Policy 37, 5075-5080. [ Links ]
GeoSUN Africa (Pty) Ltd, Accessed on 21 March 2014. http://geosun.co.za/solar-maps/. [ Links ]
Giglmayr, S., Brent, A., Gauche, P, & Fechner, H., (2014). Utility-scale PV power and energy supply outlook for South Africa in 2015. In proceedings: 2nd South African Solar Energy Conference (SASEC), Port Elizabeth. [ Links ]
Jacovides, C.P, Tymvios, FS., Assimakopoulos, V.D., & Kaltsounides, N.A., (2006). Comparative study of various correlations in estimating hourly diffuse fraction of global solar radiation. Renewable Energy 31, 2492-2504. [ Links ]
Lysko, M., (2006). Measurement and Models of Solar Irradiance. PhD Thesis, Norwegian University of Science and Technology. [ Links ]
Myers, D.R., (2013). Solar Radiation: Practical Modelling for Renewable Energy Applications, Taylor and Francis. [ Links ]
Mzezewa, C.T., (2009). National Energy Policy for Botswana: Final draft. [ Links ]
Namibia Ministry of Mines and Energy, (1998). Energy Policy White Paper. [ Links ]
Stoffel, T., Renné, D., Myers, D., Wilcox, S., Sengupta, M., George, R., & Turchi, C., (2010). Best practices handbook for the collection and use of solar resource data. National Renewable Energy Laboratory, NREL/TP-550-47465. [ Links ]
Vignola, F., Harlan, P., Perez, R., & Kmiecik, M., (2007). Analysis of satellite derived beam and global solar radiation data, Solar Energy 81, 768-772. [ Links ]
Zawilska, E., & Brooks, M.J., (2011). An assessment of the solar resource for Durban, South Africa. Renewable Energy 36:12, 3433-3438. [ Links ]
Zawilska, E., Brooks, M.J., & Meyer, A.J., (2012). A review of solar resource assessment initiatives in South Africa: The case for a national network, In Proceedings: The World Renewable Energy Forum, Denver, Colorado. [ Links ]
Zhang, T., Stackhouse Jr, PW., Gupta, S.K., Cox, S.J., Mikovitz, J.C., & Hinkelman, L.M., (2013). The validation of the GEWEX SRB surface shortwave flux data products using BSRN measurements: A systematic quality control, production and application approach, Journal of Quantitative Spectroscopy & Radiative Transfer 122, 127-140. [ Links ]
Received 30 May 2014
Revised 6 February 2015

