


Services on Demand
Article
 English (pdf)
 Article in xml format
 Article references
Indicators

Related links
-
 Cited by Google
 -
 Similars in Google
Share

 Permalink
Journal of Energy in Southern Africa
On-line version ISSN 2413-3051
Print version ISSN 1021-447X
J. energy South. Afr. vol.25 n.4 Cape Town Nov. 2014
Hybrid electromechanical-electromagnetic simulation to SVC controller based on ADPSS platform
Lin XuI; Yong-Hong TangII; Wei PuII; Yang HanII
ISichuan Electric Power Research Institute; Sichuan Electric Power Company; State Grid Cooperation of China, Chengdu, China
IIDepartment of Power Electronics, School of Mechanical, Electronic and Industrial Engineering, University of Electronic Science and Technology of China, Chengdu, China
ABSTRACT
To test the dynamic performance and damping features of a static var compensator (SVC) controller accurately in large-scale interconnected AC/DC hybrid power systems, it is of vital significance to build the detailed electromagnetic transient model. However, it is unrealistic and time-consuming to build the detailed models of all the devices in the actual large-scale power grid. Utilizing the hybrid simulation function in the advanced digital power system simulator (ADPSS) and by dividing the large-scale power grid into the electromagnetic transient sub-grids and electromechanical sub-grids, the computation speed of real-time simulation is remarkably enhanced by the parallel computational capabilities of digital simulator. The SVC controller and the nearby substation are modelled in the electromagnetic transient sub-grid, and the residue subnetworks are modelled in the electromechanical sub-grid. This paper focuses on the mechanism of the hybrid electromechanical and electromagnetic simulation, the detailed modelling and the ADPSS-based digital closed-loop test methodologies of the SVC controller. Eventually, the validity and effectiveness of the modelling and control methods are confirmed by the experimental results.
Keywords: advanced digital power system simulator, Hhybrid eectromechanical-Eelectromagnetic simulation, static var compensator, Phillips-Heffron model.
1. Background
The electric power grid in China has entered an era of large area interconnected ultra-high voltage (UHV) AC and DC networks. The transmission capacity of UHV AC and DC transmission systems is more than 200GW. The network connects the Northwest, North China, Central China and East China Power Grid, and a large power base and load centre of UHV power grid is formed (Qian et al., 2011).
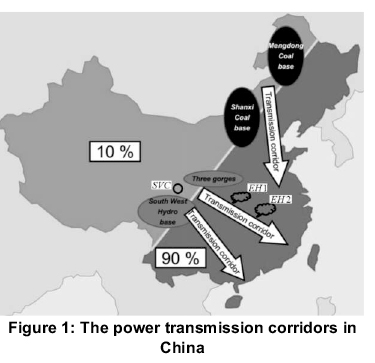
Figure.1 shows the three major electric power transmission corridors which connect the energy bases of the western regions with the industry bases of the eastern regions. The upper transmission corridor utilizes the ultra-high voltage AC transmission (UHVAC) lines to transmit the electric power from Shanxi and Meng-Dong coal bases to the Yangtze Delta region in Shanghai. The middle corridor is characterized by the high voltage DC transmission (HVDC) lines to connect the Three Gorges Hydroplant with the south eastern provinces. The lower corridor adopts the ultra-high voltage DC transmission (UHVDC) lines to transmit the electric power generated by the Southwest hydro base to Guangdong, Hong Kong, and Macao (Long et al., 2007).
On the other hand, the static var compensator (SVC) is a shunt device, of the Flexible AC Transmission Systems (FACTS) family, using power electronics to control power flow and improve transient stability on power grids (Rstamkolai et al., 1990). The SVC regulates voltage at its terminals by controlling the amount of reactive power injected into or absorbed from the power system. When the system voltage is low, the SVC generates reactive power (SVC capacitive). When system voltage is high, it absorbs reactive power (SVC inductive). These power electronic devices improve the stability of the paralleled-connected AC line, increase the transmission capacity and improve the reliability and flexibility of the interconnected system. However, the response time of the various electric components in the power system dynamics due to the voltage and frequency variations ranges from a few microseconds, milliseconds to a few minutes, or even hours (Dickmander et al., 1992). Facing such a large range of time-domain dynamic process simulation, system analysis using small time constants would result in high computational complexity and inefficiency (Schauder et al., 1995).
At present, the power system simulation methods can be categorized into three types, namely, the electro- magnetic transient simulation, the electromechanical transient simulation, and medium-and long-term dynamic process simulation. Electromagnetic transient simulation adopts complex and precise mathematical models. The differential equation solving process is complicated, so the simulation scale is limited, and the simulation step-size is selected as 20~200us. The commonly used simulation programs are: EMTP PSCAD-EMTDC, NETOMAC, PSIM, SABER, SPICE, PSPICE, etc. Electromechanical transient simulation is used for transient stability analysis under large disturbance and static stability analysis under small perturbation. The fundamental frequency phasor theory is applied for analysis and calculation, and the calculation step-size is about 10ms (Hingorani and Gyugyi, 2000). The popular programs for electromechanical simulation are: PSASP BPA, PSS/E, SIMPOW, etc. The dynamic process of the medium-and long-term analysis focuses on the large-scale system disturbances, arising from the active and reactive power generation and consumption imbalance (Erickson and Maksimovic, 1997).
With the progress of the National Ultra HighVoltage grid construction as well as the formation of the national interconnected grid, the existing physical models, the dynamic models and the mixed analogue-digital simulation are unable to meet the need of the actual power grid due to the limitations of laboratory equipment. Currently, the China Electric Power Research Institute (EPRI) has developed an integrated power system simulation platform - Power System Analysis Software Package (PSASP). On the one hand, the PSASP electromechanical transient simulation can provide the large-scale grid simulation and ten thousand nodes scale grid simulation can be realized. By using PSASP electromagnetic transient simulation, the voltage and current transient process of the power system components can be achieved.
Meanwhile, by using the inverse-matrix method of sub-network parallel algorithms, the difficulty of real-time digital simulation of large-scale electric grid is resolved. The fully digital real-time simulation of power system simulator (advanced digital power system simulator, ADPSS) was developed by China EPRI. Several innovative techniques were adopted in the ADPSS platform to achieve real-time simulation of large-scale power systems, such as the electromechanical transient sub-network parallel computing method, the split AC-DC parallel realtime simulation, the mechanical and electrical hybrid parallel simulation method.
Inter-process synchronization and real-time control are used to achieve electromechanical and electromagnetic mixed transient simulation of large-scale power systems, and system scale and simulation accuracy can also be ensured. The external physical control equipment is connected to the physical interface of the ADPSS, and the operating characteristics of the actual grid are simulated without network equivalent simplification. Hence, the behaviour of the test device in a large grid scale and its effect on the grid dynamic characteristics can be fully investigated (Chang et al., 2013).
This paper is organized as follows. Section 2 presents a brief review of the static var compensator (SVC). Section 3 presents the power system modelling with the SVC controller. Section 4 presents the principles of the power swing damping controller (PSDC). Section 5 presents the network interfacing methodology between the electromagnetic and electromechanical transient programs. Section 6 presents the implementation issues of the SVC controller on the ADPSS platform. Section 7 concludes this paper.
2. A brief review of the static var compensators (SVCs)
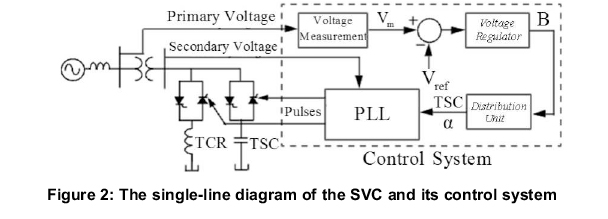
Figure 2 shows the single-line diagram of a static var compensator and its control system. The variation of the reactive power is performed by switching three-phase capacitor banks and inductor banks connected on the secondary side of a coupling transformer. Each capacitor bank is switched on and off by three thyristor switches (Thyristor switched capacitor, TSC). Reactors are either switched on and off (Thyristor switched reactor, TSR) or phase-controlled (Thyristor controlled reactor) (Hingorani and Gyugyi, 2000).
The control system consists of the following aspects:
1. A measurement system to detect the positive-sequence voltages and currents;
2. A Fourier-based measurement system using a one-cycle running average method;
3. A voltage regulator that uses the voltage error (difference between the measured voltage Vm and the reference voltage Vref) to determine the SVC susceptance B needed to keep the system voltage constant;
4. A distribution unit that determines the TSCs (and eventually TSRs) that are switched on and off, and computes the firing angle of TCRs;
5. A synchronizing system using a phase-locked loop (PLL) synchronized on the secondary voltages and a pulse-generator that sends appropriate pulses to the thyristors.
The SVC can be operated in two different modes: In voltage regulation mode (the voltage is regulated within limits as will be explained). In var control mode the SVC susceptance is kept constant. When the SVC is operated in voltage regulation mode, it implements the following V-I characteristic (Figure 3) (Hingorani and Gyugyi, 2000).
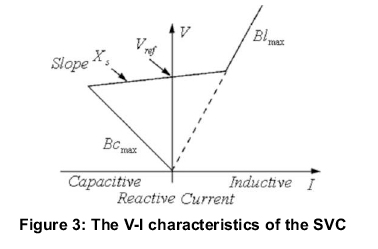
As long as the SVC susceptance (B) stays within the maximum and minimum susceptance values imposed by the total reactive power of capacitor banks (Bcmax) and reactor banks (Blmax), the voltage is regulated at the reference voltage Vref. However, a voltage drop is normally used (usually between 1% and 4% at maximum reactive power output), and the V-I characteristic has the slope indicated in Figure 3 The V-I characteristic is described by the following three equations:
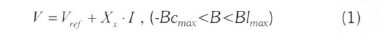
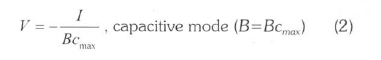
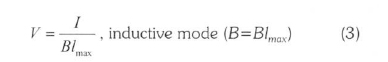
where V denotes the positive sequence voltage (p.u.); I denotes the reactive current (p.u./Pbase) (I>0 indicates an inductive current): X s denotes the slope or droop reactance (p.u./Pbase): Bcmax denotes the maximum capacitive susceptance (p.u./Pbase) with all TSCs in service, no TSR or TCR; Bl madenotes the maximum inductive susceptance (p.u./Pbase) with all TSRs in service, or TCRs at full conduction, without TSC.
When the SVC is operating in voltage regulation mode, its response speed to a change of system voltage depends on the voltage regulator gains (proportional gain Kpand integral gain Ki), the droop reactance Xs, and the system strength (short-circuit level). For an integral-type voltage regulator (Kp=0), if the voltage measurement time constant Tmand the average time delay Tddue to valve firing are neglected, the closed-loop system consisting of the SVC and the power system can be approximated by a first-order system having the following time constant:

where Tcrepresents the closed-loop time constant. Kirepresents the proportional gain of the voltage regulator, Xs represents the slope reactance, and Xn represents the equivalent power system reactance.
3. Power system modelling with static var compensator (SVC)
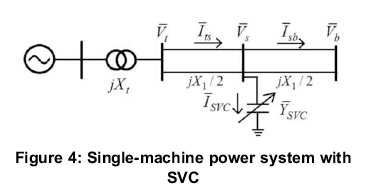
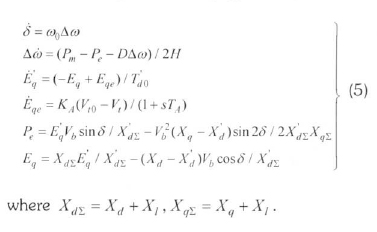
Figure 4 shows the single-machine power system with the SVC connected to an infinite bus. The nonlinear differential equations from which the Phillips-Heffron linear model without an SVC is derived as (Hingorani and Gyugyi. 2000):
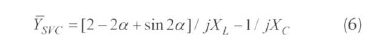
The equivalent admittance of a thyristor-controlled reactor and fixed-capacitor type SVC with voltage control is:
From the circuit diagram, we get:
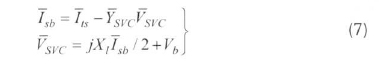
Hence,  , where
C = 1+jXtYSVC /2 and X = Xl(1+1/C)/2 .
Similarly, on the d-q axis we obtain:

By linearizing these equations around the steady-state operating point of the power system, the extended Philips-Heffron model of the power system with SVC can be obtained as:
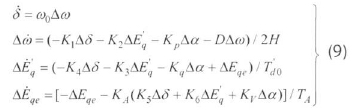
where:

4. Power swing damping control (PSDC) -principles and solutions
Oscillations in power systems are caused by various disturbances. If the system is not series-compensated, the typical range of oscillation frequencies extends from several tenths of 1 Hz to nearly 2 Hz. Several modes of oscillation may exist in a complex, interconnected power system. The behaviour of the generator oscillations is determined by two torque components: the synchronizing torque and the damping torque.
The synchronizing torque ensures that the rotor angles of different generators do not drift away following a large disturbance. (In other words, the synchronizing torque binds the different generators into synchronism, assuring transient stability.) In addition, the magnitude of the synchronizing torque determines the oscillation frequency. Meanwhile, the damping torque influences the decay time of oscillations. Even if a power system is stable, the oscillations may be sustained for a long period without adequate damping torque (Hingorani and Gyugyi, 2000).
Referring to the system in Figure 4, the SVC regulates the middle point voltage V,. Let:
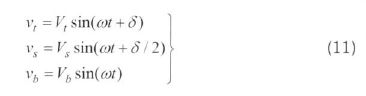
For the sake of simplicity, it is assumed that V, = Vb=V. The electrical power Petransmitted across the line can be derived as follows for a sending-end voltage magnitude:
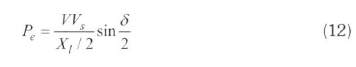
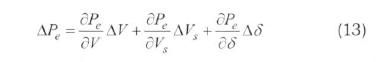
The incremental change in the electrical power can be derived by linearizing Eq.(12) as:
It is further assumed that the sending-end voltage is constant, thus ΔV =0. Besides, swing equation of the system can be written as:
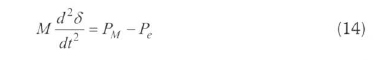
where PMdenotes mechanical power, M denotes the mechanical torque. For small-signal analysis, the Eq. (14) is linearized as:
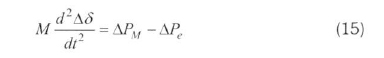
The mechanical power is assumed to be constant during the time of analysis, hence we get:
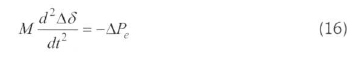
Therefore, we get:
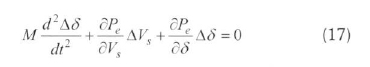
Equation (17) describes the small-signal dynamic behaviour of the system, in which the effect of the SVC is represented by the middle term δPeΔVs/δVs . If the SVC is operated to maintain the midpoint voltage Vs strictly constant, as is done for voltage control, ΔVsbecomes zero, in which case Eq.(17) reduces to:
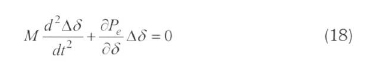
The roots of the characteristic equation result in un- damped oscillations in the rotor angle with a frequency of:
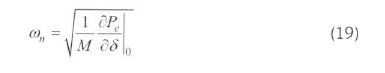
where δPe/δδ denotes the synchronizing power coefficient. Obviously, an SVC operating on a pure- voltage control mode is unable to provide any system damping. However, the SVC can contribute to system damping if it is allowed to modulate the middle voltage instead of maintaining it strictly constant. Specifically, the
midpoint voltage can be modulated as a function of d(Δδ)¡dt, that is,
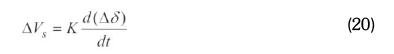
where K is a constant. Substituting Eq. (20) in Eq. (17) results in a modified incremental-swing equation:
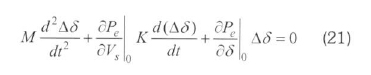
Therefore, the damping ratio can be derived as:
With the introduction of voltage-modulating control, the SVC transforms the power system into a positively damped system. Hence, any oscillations in the rotor angle will decay with time. Such an additional control feature is termed supplementary control, or power-swing damping control (PSDC) [Mahdad et al., 2009].
5. Interface methodology for the electromechanical-electromagnetic transient simulation
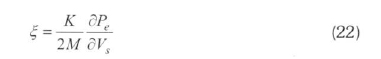
a. Equivalent networks for the electromagnetic and electromechanical subsystems
Figure 5 shows the equivalent representations of the electromagnetic and electromechanical transient networks. According to the multi-port Thevenin principle, the electromagnetic and electromechanical transient networks are solved separately. The electromechanical transient network is denoted by the Thevenin equivalent network when computing the electromagnetic transient parameters. Similarly, the electromagnetic transient network is represented by the Norton equivalent network when computing the electromechanical parameters.
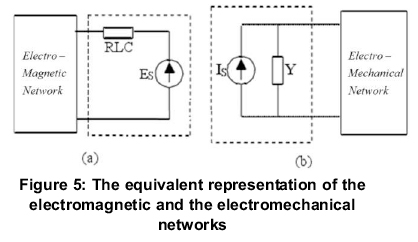
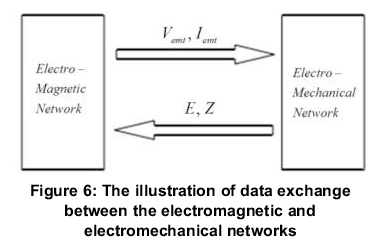
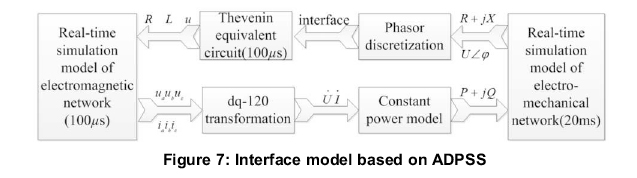
Figures 6 and 7 show the data exchange model and interface model respectively, between the electromechanical and electromagnetic sub-networks. In the initialization process, the positive sequence, negative sequence and zero-sequence equivalent impedance matrix Z of the electromechanical network are sent to the electromagnetic transient simulation program. At each interface point, the positive, negative sequence and zero sequence current Iemt, and voltage Vemt at boundary points of the electromagnetic transient program are sent to the electromechanical transient program. Meanwhile, the positive, negative and zero sequence equivalent potential (E) at the boundary points of the electromechanical transient program is sent to the electromagnetic transient program. The simulation step-sizes of the electromagnetic network and the electromechanical network are 100μs and 20ms.
b. The simulation step-size of the two subnetworks
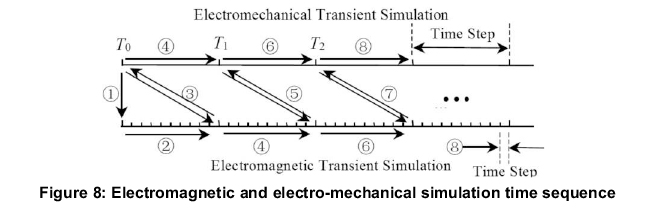
Figure 8 shows the timing-sequence of the electromagnetic and electromechanical simulation programs in the normal operation conditions. The step-size of the electromagnetic transient program is selected as 0.01s, and the step-size of the electromechanical transient program is selected as 50 microsecond. The simulation procedure is as follows:
1. Initialization process, the equivalent impedance Z and potential E at the boundary points of the electro- mechanical program are sent to the electromagnetic program;
2. The electromagnetic transient program start calculation during T0 to T1;
3. The fundamental frequency voltages, currents at boundary points of the electromagnetic transient program are sent to the electromechanical transient program, and the new Z and E parameters are acquired from the electromechanical transient program;
4. The electromechanical program starts calculation during T0to T1period and the electromagnetic transient program starts calculation during T1 to T2 period after the Z and E parameters are acquired;
5. The fundamental frequency voltages, currents at boundary points of the electromagnetic transient program are sent to the electromechanical transient program at T2, and the new Z and E parameters sent to the electromagnetic transient program;
6. T=T+ΔtΔt denotes simulation step-size
7. Repeating procedures 4-6, unless the system topology evolves or simulation terminates.
c. Electric network partitioning scheme
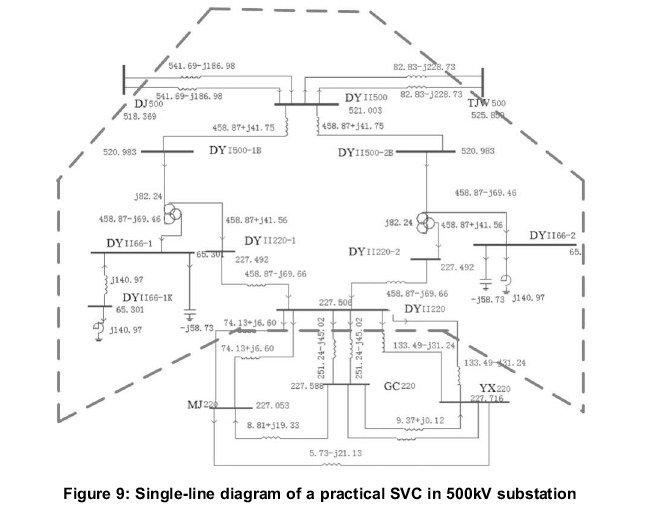
Figure 9 shows the single-line diagram of the practical SVC in the 500kV substation. In order to study the characteristics of SVC controller, a closed-loop control system based on actual controller and ADPSS platform is established. The electric network is simulated in the ADPSS platform, by using parallel computing and hybrid simulation approach, the real-time simulation of the whole system is achieved. Based on the ADPSS platform, the power flow and grid network diagram are set up, the system is divided into twelve electromechanical networks and one electromagnetic network by using the automatic sub-network partitioning functions inherent in ADPSS platform. The individual subnetworks are distinguished and kept in contact through the tie-lines between the sub-networks.
As shown in Figure 9, the electromagnetic subnetwork is encircled by the dotted line, i.e., the region where the SVCs are installed in the 500kV substation. In this region, the detailed electromagnetic simulation through ADPSS hardware device is required. By connecting the PSASP hardware interface with the actual external SVC controller, the closed-loop control of the SVC controller is achieved. Meanwhile, the electromechanical transient simulation is responsible for the area outside the dotted line in Figure 9. The data communication between the sub-networks is achieved by the bus or line information exchange between electromechanical and electromagnetic processes.
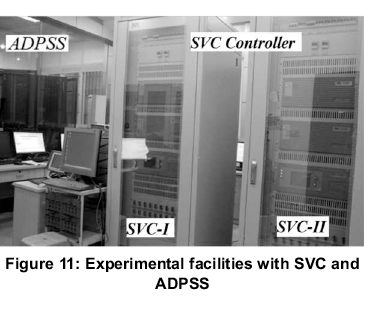
Figure 10 shows the physical interface system (including power amplifier) of two sets of SVC controller with the ADPSS simulation system. Figure11 shows a photo of the experimental facilities with SVC controller and ADPSS in the lab. The ADPSS simulation device provides the desired voltage and current signals to the two sets of SVC controllers and TCR branches through the physical interface (including power amplifier), and also provides the SVC controllers with the switching positions of the filter branches, the parallel capacitors, and the reactors.
As shown in Figure 10, the thyristor trigger signals as well as the opening/closing of each branch switching signals generated by the two sets of the SVC controller are sent back to the ADPSS platform. Furthermore, the SVC controllers acquire the voltage, current and switching position signals of each branch from the physical interface box (including the power amplifier). After the execution of complicated control algorithm, and output trigger pulse signals and the sub-closing signals of the SVC controllers are sent back to the ADPSS platform. Following the last procedure, the closed-loop controller test of the static var compensator (SVC) is realized in the advanced digital power system simulation platform.
6. Implementation of the SVC controller on ADPSS platform
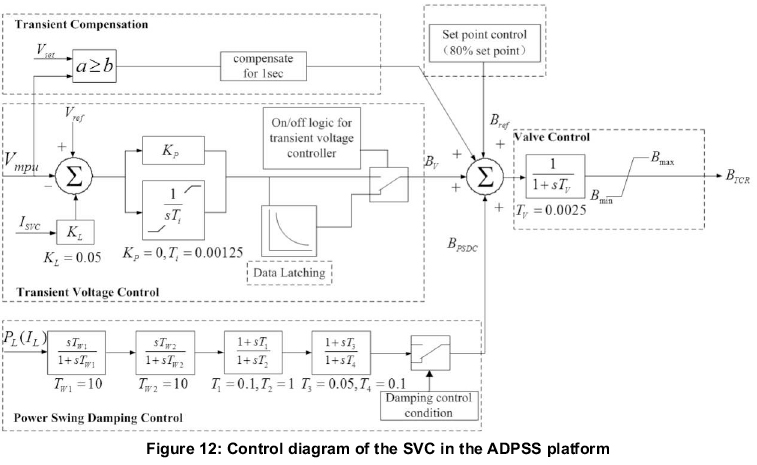
Figure 12 shows the control block diagram of the SVC controller in the ADPSS platform, which consists of three blocks, namely, transient compensation, transient voltage control and power swing damping control. The transient compensation is activated under a severe grid fault, when the voltages of the 500kV substation reduce to 70% of the nominal values. The transient voltage control is activated when the grid voltages of the 500kV substation reduces to 90% of the nominal values and last for 10ms. And the transient voltage control is suspended after the voltages recovers to 94.5% of the nominal values and last for 3s. After the transient control process, the steady-state voltage control is enabled.
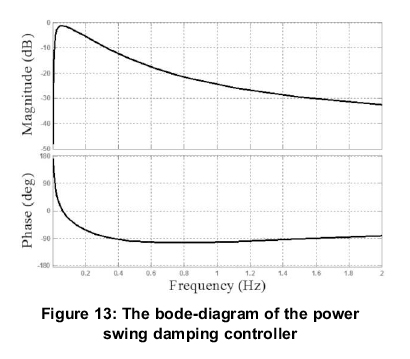
The root-mean-square (RMS) values of the DY-DJ (Figure 9) line currents are utilized as input signals of the power swing damping controller, which is formed by two dc rejection filters and first-order low-pass filters. The bode-diagram of the PSDC is shown in Figure 13. It can be observed that the oscillation frequency is around 0.34Hz, and the phase lagging between the input and output signal is about 90 degree. The PSDC has a phase lag of 90°~105° during the low frequency range of 0.3~2Hz, which achieves effective low frequency oscillation damping.
Dynamic behaviour of the SVC controller
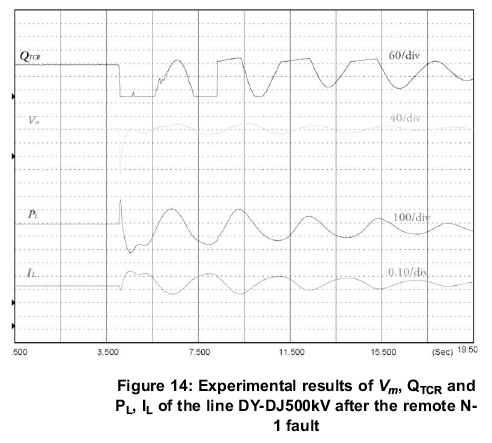
In order to investigate the transient voltage stability and the characteristics of the damping controller, the remote electromechanical sub-network is subjected to the three-phase to ground fault at t = 4.0s, with a zero grounding impedance and a duration of five fundamental cycles. The fault is cleared at t = 4.1s, and the SVC bus voltages and the injected reactive power, line active power and the RMS value of line current are observed.
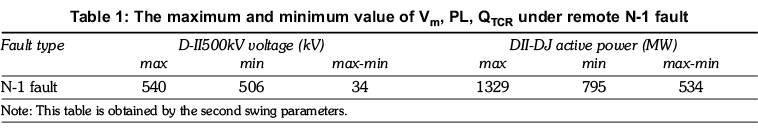
As shown in Figure 14, when the remote N-1 fault occurs, the RMS voltage of the DJ-500kV bus Vmreduces to 0.27 p.u. The TCR brunch of the SVC adjust the equivalent conductance and 144MVar reactive power is released to remarkably enhance the transient stability of the system. Based on the experimental results, Table 1 summarizes the maximum and minimum value of the RMS voltage Vm, the total active power PL of the DY and DJ buses.
Enhancement of system transient stability
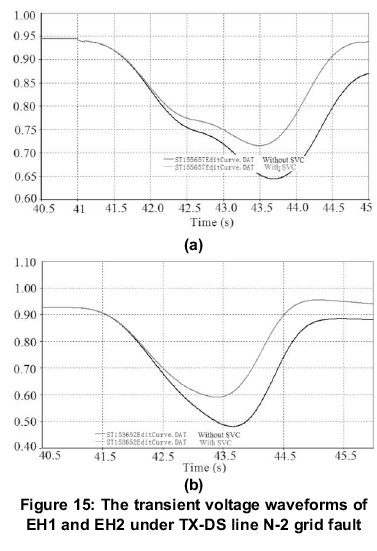
According to the experiment results of several faults, it can be concluded that, when the TX-DS line N-2 grid fault occurs, the ultra-high voltage (UHV) EH1 and EH2 suffer the most serious decline. The islanding conditions of EH1 and EH2 are that: (1) the voltage of EH1 is less than 0.64pu and has 0.15s duration. (2) The voltage of EH2 is less than 0.49pu and has 0.15s duration. Figure 15 shows the voltage waveforms of EH1 and EH2 with or without SVC, where the red line represents with SVC condition, the black line represents without SVC condition. It can be seen that when the SVC controller is not in operation, EH2 has reach the islanding condition, when SVC is enable, the lowest voltage of EH1 and EH2 increase 0.075pu and 0.13418p.u, and EH2 will not break down. Therefore, SVCs can substantially enhance the transient stability of the system, and enhance the support ability of UHV voltage under serious faults.
Enhancement of system damping
Figure 16 shows the real-time simulation results of the power angle curve between ERTAN and the Three Georges hydro-plant under N-1 fault and N-2 fault at DJ-SZ line, respectively. Table 2 summarizes the first swing amplitude and damping ratio comparison results of power angle under different faults with SVC or without SVC. From the test results, it can be observed that the oscillation frequency is about 0.34Hz, the rotor angle increases following a fault, and goes through an over swing. The damping ratio of the power swing angle is substantially increased with SVC controller. It can be concluded that the SVC controller is effective to damp power swing and provides low frequency oscillation damping thus increase system damping ratio.
The experimental results demonstrate that the presented modelling and control strategies, based on the hardware -in-the-loop (HIL) approach is quite effective to study the SVC controller, and the similar analysis can be extended to other FACTS controllers for voltage regulation, oscillation damping and stability enhancement for the large interconnected electrical power systems.
5. Conclusions
The dynamic modelling and power swing damping control of the static var compensator is presented in this paper, using the hardware-in-the-loop approach based on the advanced digital power system simulator platform. Firstly, a brief review of the SVC and Phillips-Heffron model of the power system with the SVC controller are presented.
To enhance power system damping and mitigate low frequency oscillation, the power swing damping control is designed. The interfacing methodology between the electromagnetic and the electromechanical transient programs is proposed. The closed-loop control strategy of the SVC controller on the ADPSS platform is presented to analyse the dynamic control behaviour of the SVC. Finally, the validity and effectiveness of the devised modelling and control methodologies are confirmed by the experimental results.
Acknowledgement
This work is financially supported by the research project 'Research on the key technologies and practical application of the 110kV hybrid SVC controllers' from the State Grid Corporation of China (SGCC) under grant No. 521997140003.
References
Boynuegri, A.R., Vural, B., Tascikaraoglu, A., Uzunoglu, M., and Yumurtaci, R. (2012). Voltage regulation capability of a prototype static var compensator for wind applications, Applied Energy, 93,422-431. [ Links ]
Chang, YC. (2013). Fitness sharing particle swarm optimization approach to FACTS installation for transmission system loadability enhancement, Journal of Electrical Engineering and Technology, Korea, Vol. 8, No.1, pp.31-39, 2013. [ Links ]
Chang, Y.C. and Chang, R.F (2013). Maximization of transmission system loadability with optimal FACTS installation strategy, Journal of Electrical Engineering and Technology, Korea, 8, .991-1001. [ Links ]
Dickmander, D. L., Thorvaldsson, B. H., Stromberg, G. A., Osborn, D. L., Poitras, A. E., and Fisher, D. A. (1992). Control system design and performance verification for the chester, maine static VAr compensator, IEEE Transactions on Power Delivery, 7, 1492-1503. [ Links ]
Erickson, R. W., and Maksimovic, D., (1997). Fundamentals of Power Electronics. Norwell, MA: Kluwer. [ Links ]
Hingorani N. G., Gyugyi, L., (2000). Understanding FACTS-Concepts and Technology of Flexible AC Transmission Systems. Piscataway, NJ: IEEE Press. [ Links ]
Long, W., and Nilsson, S. (2007). HVDC transmission: Yesterday and today, IEEE Power and Energy Magazine, 5, 22-31. [ Links ]
Mahdad, B., and Srairi, K. (2013). A study on multi-objective optimal power flow under contingency using differential evolution, Journal of Electrical Engineering and Technology (IJEET), Korea, 8, 53-63. [ Links ]
Mahdad, B., Bouktir, T., Srairi, K., and Benbouzid M.E.L. (2009). Optimal Power Flow with Discontinuous Fuel Cost Functions Using Decomposed GA Coordinated with Shunt FACTS, International Journal of Electrical Engineering & Technology, Korea, 4, 315-322. [ Links ]
Qian, M., Hongtao, L., He H., and Chuang F (2011). Application of static var compensator in China southern power grid, Southern Power System Technology, 5, 17-21. [ Links ]
Rostamkolai, N., Piwko, R. J., Larsen, E. V., Fisher, D. A., Mobarak, M. A., and Poitras, A. E. (1990). Sub synchronous interaction with static VAr compensators - Concepts and practical implications, IEEE Transactions on Power Systems, 5, 1324-1332. [ Links ]
Schauder C., Gernhardt M., Stacey E., Lemak T., Gyugyi L., Cease TW., and Edris A. (1995). Development of a ±100 MVAr static condenser for voltage control of transmission systems, IEEE Transactions on Power Delivery, 10, 1486-1496. [ Links ]
Received 23 February 2014
Revised 10 October 2014

