


Serviços Personalizados
Artigo
 Inglês (pdf)
 Artigo em XML
 Referências do artigo
Indicadores

Links relacionados
-
 Citado por Google
 -
 Similares em Google
Compartilhar

 Permalink
Journal of Energy in Southern Africa
versão On-line ISSN 2413-3051
versão impressa ISSN 1021-447X
J. energy South. Afr. vol.25 no.3 Cape Town Ago. 2014
ARTICLES
Practical considerations for low pressure solar water heaters in South Africa
Oelof De MeyerI; Richard OkouII; Adoniya Benaya SebitosiIII; Pragasen PillayIV
IDepartment of Electrical Engineering, University of Cape Town, South Africa
IIDepartment of Electrical and Computer Engineering, Makerere University, Kampala, Uganda
IIIDepartment of Mechanical and Mechatronics Engineering, University of Stellenbosch, South Africa
IVDepartment of Electrical and Computer Engineering, Concordia University, Montreal, Quebec, Canada
ABSTRACT
This paper presents the results of the design parameters that affect natural convection of Low Pressure (LP) Solar Water Heaters (SWH) in South Africa. Fluid flow plays an important role in the heat transfer process associated with natural convection. Three partial differential governing equations were considered. These equations are non-dimensionalized and a similarity solution was applied to obtain two coupled non-linear ordinary differential equations which are solved in MATLAB. Two scenarios were considered for the simulation, a vertical wall with a constant wall temperature and a vertical wall with a constant heat flux. The temperature and velocity profiles were obtained for both scenarios and compared. The effect of the length, diameter and tilt angle of the tube in relation to the amount of heat transferred to the water was investigated specifically for Cape Town. These results are used to discuss design and installation considerations for LP SWHs and are presented in the paper.
Keywords: solar water heating, temperature profiles, tilt angle, tube length and diameter, vertical wall.
1. Introduction
South Africa is endowed with good solar radiation receiving 2 500 hours of sunshine per year and an average solar-radiation of between 4.5 and 6.5kWh/m2 per day. For this reason, solar energy is an alternative source that can be effectively utilized. Solar water heating for domestic users is popular as one of the major Demand Side Management (DSM) programs run by the main utility, Eskom. In South Africa, approximately 44% of all household energy is used to heat water. If a solar water heating system can deliver this energy, then in theory it will reduce the energy usage of the household by 44%. However, these solar water heating systems are not optimized and hence unable to achieve the energy savings expected despite their geographical locations and annual solar radiation received. Thus, these systems can be optimized based on the consumer's needs, geographical location and the amount of solar radiation received during summer and winter. Various SWH systems are available on the market; however, this paper focuses on a LP SWH as seen in Figure 1.
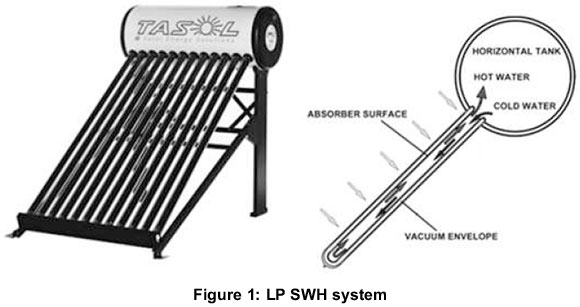
2. Low pressure solar water heating
These systems use natural convection as means of heat transfer. The system comprises a storage tank and vacuum tubes as the main components. The vacuum tubes are connected directly into the storage tank allowing the water to fill the tubes as seen in Figure 1. The vacuum tube consists of two concentric glass tubes, sealed at the one end with an annular vacuum space to reduce heat loss. The inner glass tube has a selective absorber coating on the outside. Thus, solar radiation is absorbed by the tube and transferred to the water inside the tube. Due to increase in temperature, a density difference drives the hot water upwards into the storage tank; this phenomenon is known as natural convection. The fluid flow is induced by the buoyancy effect.
3.Natural convection
3.1 Basic theory
Heat transfer can occur either by radiation, conduction or convection. In this section, a brief understanding of the physical mechanisms of natural convection is discussed. As a hot object enters a colder fluid (gas or liquid), the outer temperature layer of the object will drop as the surrounding fluid temperature rises. A density difference between the hot and cold fluid causes the hotter fluid to rise creating a natural convection current. Heat transfer is enhanced as a result of the natural convection current. The same phenomenon occurs when a cold medium enters a warmer fluid; however, the natural convection currents are reversed.
3.2 Velocity and temperature profiles (2D)
The governing equations associated with natural convection are used in the simulation model in this paper. The three partial differential equations are reduced to two ordinary differential equations by applying a similarity solution. The two coupled ordinary differential equations are obtained for flow induced by a vertical wall with either a constant wall temperature or constant heat flux. In 1911, Pohlhausen was the first to solve these equations for a vertical wall with constant wall temperature. By 1930, Schmidt and Beckmann had solved these equations for Pr = 0.733. In 1953, Ostrach increased the solution to Prandtl numbers ranging from 0.01 to 1,000. Sparrow and Gregg (1956) obtained a similarity solution for a vertical wall with a constant heat flux and investigated Prandtl number ranging from 0.1 to 100.
3.2.1 Vertical wall with constant wall temperature
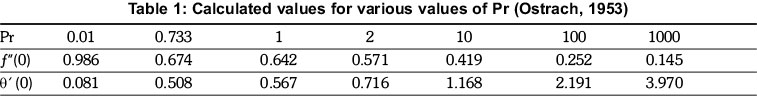
The dimensionless velocity and temperature distribution was developed by Ostrach. Values for dimensionless velocity distribution, f"(0), and temperature distribution,  (0) were obtained from solutions provided by Ostrach as seen in Table 1.
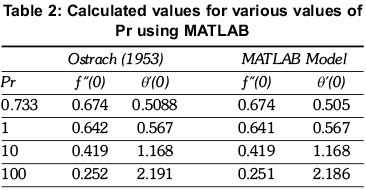
A MATLAB model was developed to solve these equations and the results compared to the solutions obtained by Ostrach. The model was able to provide the velocity and temperature profiles for a vertical wall with any wall temperature and length. Further, the model was able to adapt for various fluids given that the fluid properties are available. These graphs offered valuable insight for a basic understanding in fluid flow where a vertical isothermal wall is considered with water as fluid medium. The dimensionless temperature and velocity distribution graphs are shown in Figure 2 and 3.
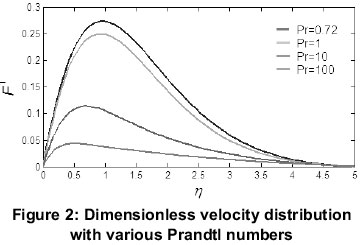
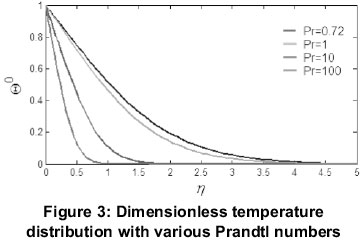
The results were compared to those from Ostrach, aclear correlation is observed as in Table 2.The model is thus accurate in solving the ordinary differential equations with boundary conditions.
The velocity and temperature profiles, for a given wall temperature and length, are obtained by using the similarity parameters as seen in Figure 4.
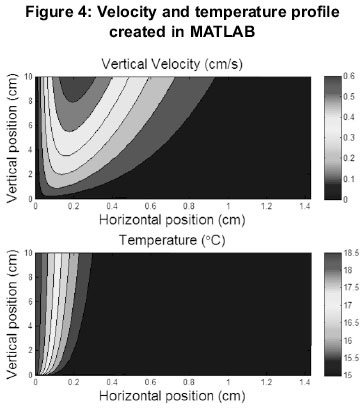
The wall has a length of 10 cm and temperature of 19oC. The fluid medium is water with a temperature of 15oC.
3.2.2 Vertical wall with constant heat flux
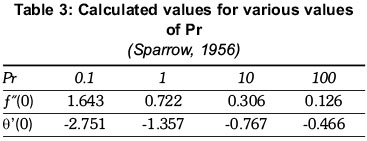
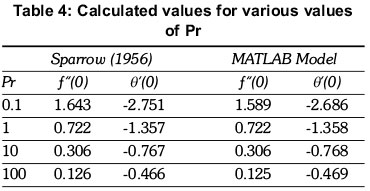
For a vertical wall with constant heat flux, the values for the dimensionless velocity distribution, /"(0), and temperature distribution, 9'(0) were obtained from solutions provided by Sparrow (1956), as seen in Table 3.
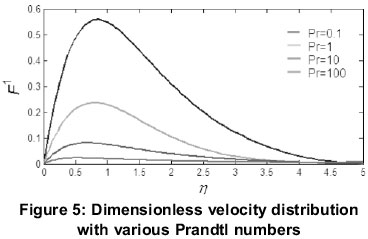
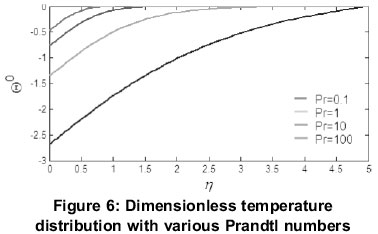
For this case, a MATLAB model was developed to obtain the velocity and temperature profiles for a vertical wall with a certain length and constant heat flux. The model was adapted for various fluids. The graphs offered valuable insight on the basic understanding in fluid flow where a vertical Isoflux wall is considered. The dimensionless temperature and velocity distribution graphs were simulated by the MATLAB model as shown in Figures 5 and 6.
When these results were compared to those from Sparrow, (1956), correlation was observed as in Table 4. The model was thus accurate in solving the ordinary differential equations with boundary conditions.
The velocity and temperature profiles for a given wall flux and length, were obtained by using the similarity parameters as seen in Figure 7. The wall has a length of 10 cm and the heat flux applied was 1kW/m2. Water at 15oC was considered in the scenario.
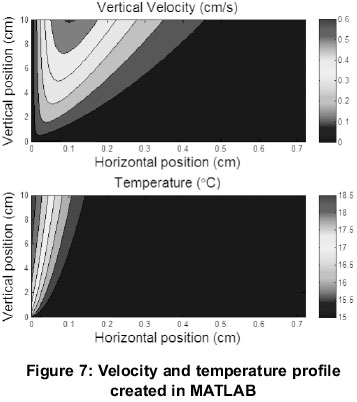
A difference was noted between the velocity and temperature graphs from the simulations for an isothermal and isoflux vertical wall. In both simulations, the Prandtl number was 7.5.
To obtain the same Prandtl number, the wall temperature and heat flux were adjusted. In the isothermal case, the temperature distribution reduced gradually further away from the wall with almost uniform layers. In the isoflux case, the temperature distribution grew along the wall and reduced gradually away from the wall. A higher velocity was achieved for the isothermal case.
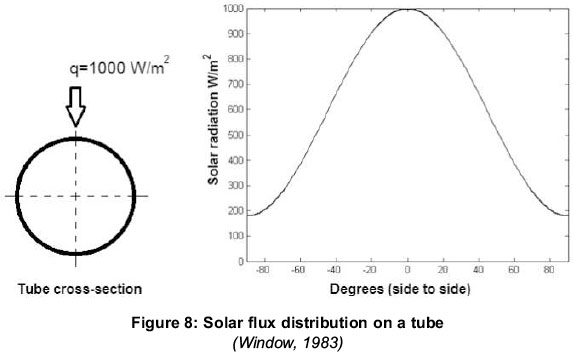
However, if the length of the wall is increased significantly, the velocity and temperature of the isoflux scenario will be greater for the same given wall length in the isothermal case. This is due to an increase in energy per unit length from the constant heat flux. In LP SWHs, the isoflux scenario can be applied to the vacuum tubes. The vacuum tubes are exposed to the solar radiation throughout the day and for any given instance, a constant heat flux is observed on the tube wall with a flux distribution (Window, 1983) around the circumference as in Figure 8.
3.3 Velocity and temperature profiles (3D)
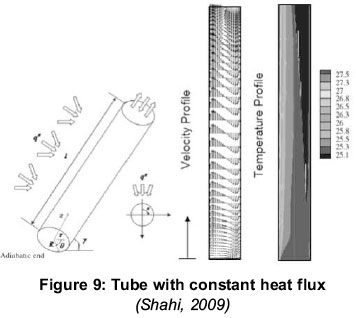
The geometrical shape of the vacuum tubes found in LP SWHs are three dimensional while the model developed only accounted for flow in the two dimensions. Nevertheless, the model is a good representation of the flow that occurs in the tubes. For cases where the diameter was very large compared to the length of the tube, natural convection flow currents over a flat plate can be considered (Lighthill, 1953), and thus the model can be applied. The main purpose of the model is to validate the theory found in literature and provides a visual understanding of the flow found in natural convection. In the three dimensional realm, the governing equations and boundary conditions are adapted to account for the extra added dimension and geographical shape of the object as in Figure 9.
3.4 Mass flow rate
In 2005, Budihardjo developed a correlation for the natural circulation flow rate through single-ended tubes (at the tube opening). The flow rate correlation is based on the solar input the tube receives, the tank temperature, the collector's tilt angle and tube aspect ratio.
3.5 Tilt Angle
To maximise the annual energy collection from the collector, the tilt angle of the collector should be mounted at an optimal tilt angle. In 2009, Tang investigated the optimal tilt angles of all-glass evacuated tube solar collectors and developed a detailed mathematical procedure for calculating the collected radiation on a tube for any given tilt and azimuth angle. It was found that south facing collectors only rely on the optimal tilt angle for maximum annual energy collection. The optimal tilt angle for these collectors are generally less than the site latitude, and the optimal tilt angle decreases with an increase in the central distance (B) between adjacent tubes as in Table 5a and 5b, where D1 and D2 are the inside and outside diameter respectively.
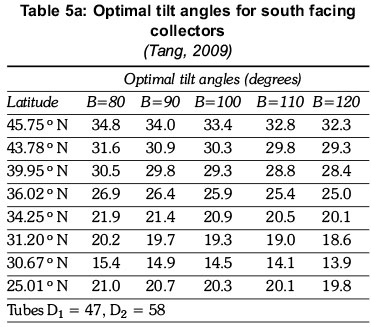
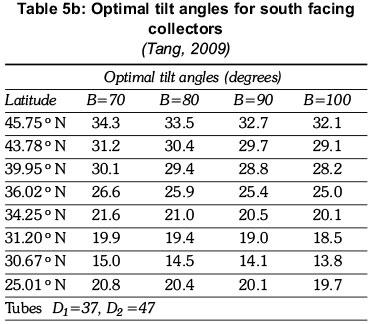
According to Tang (2009), for areas with a high solar radiation index, the optimal tilt angle is close to the site latitude, whereas areas with a low solar radiation index, the optimal tilt angle is lower than the site latitude. If the site latitude is larger than 30, the optimal tilt angle is 10o lower than that of the site latitude.
Vacuum tube collectors are different to flat-plate collectors which are generally installed with the same tilt angle as the site latitude. South facing tube collectors should thus be installed with a tilt angle lower than the site latitude to ensure maximum annual collectable radiation. If two cities in South Africa are considered, Johannesburg (26.12S 28.4E) and Cape Town (33.55S 18.22E), the total annual energy collection for these cities would vary, thus an optimal tilt angle is required for these cities. The fixed tilt angle of 45o commonly used for most LP SWHs should hence be reconsidered for increased energy.
3.6 Length-radius ratio
Lighthill (1953) developed methods to predict the flow and heat transfer caused by natural convection in vertical heated tubes. From these methods, a prediction could be made irrespective of the flow, i.e., laminar or turbulent and irrespective of the boundary layer of the heated fluid filled the tube or filled the tube with a stagnant region near the end. Lighthill discovered that the flow depends on a modified Grashof number and on the length-radius ratio. If a stagnant region occurred in the vacuum tube, that section would become inactive resulting in lower heat transfer in the tube (Budihardjo et al., 2004). The parameter defining the existence of a stagnant region as developed by Lighthill is:

Where Ra and L/r are the Rayleigh number (based on the radius of the tube), tilt angle from the vertical and length-radius ratio respectively. When T < 350, a stagnant region forms.
4. Simulation results
A simulation model was developed for LP SWHs. This simulation model was used to assess the effects of various tilt angles, length-radius ratios, effect of water temperature and solar radiation received. The model was based on the theory covered in Section 3 and results obtained offered valuable results for practical considerations of LP SWH system design and installations. The flow patterns in a thermo siphoning tube were investigated by Budihardjo (2005) and results obtained indicated that a tube with uniform top heating induces flow as a single stream to the bottom of the tube and back to the top in a loop. For large heat fluxes, flow could become transitional or turbulent but the counter-flowing stream characteristic still held (Schmid et al., 1986).
4.1 Tilt angle
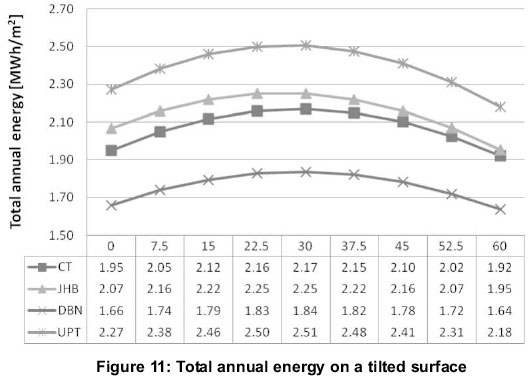
The tilt angle of a collector plays a very important role in solar collectors. Literature shows that extensive research has been done to determine the optimal tilt angle for solar collectors such as flat-plate collectors. However, collectors such as the LP SWH systems consist of tubes and this track the sun passively due to the tube geometry, thus having a higher peak solar window. It is favourable for any collector to intercept the direct radiation of the sun perpendicular to the absorber surface of the collector; this reduces the amount of rays being deflected away from the surface, losing in effect useable energy from the sun. A transverse and longitudinal incidence angle modification is thus desired for the tube geometry of the LP SWH collector (Zambolin, 2010). A simulation model was created in TRNSYS to determine the optimal tilt angles for a collector. It was found that the tilt angle of 45° was indeed not the optimal tilt angle to use throughout the country. Four geographical locations where chosen for the simulation. These cities include Cape Town, Johannesburg, Durban and Upington. The maximum annual energy is observed when the tilted surface is equal to the site latitude as seen in Figure 11.

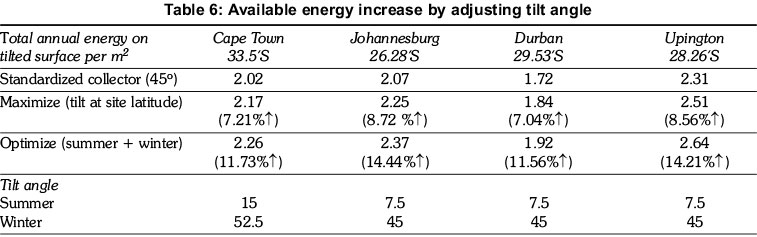
This theory is a well-known fact in the solar industry and considered by many solar collector installers and manufacturers. However, the consumer does not benefit as much from this tilt angle in the winter seasons when the demand for hot water increases. Thus, the tilt angle needs to be adjusted to accommodate the need for hot water in the winter seasons. It was found that a tilt angle approximately 15-20° higher than the site latitude would be more beneficial. This corresponded with the sun path during winter seasons. It is clear that the collector tilt angle should be adjusted seasonally to maximize energy output as seen in Figure 12.
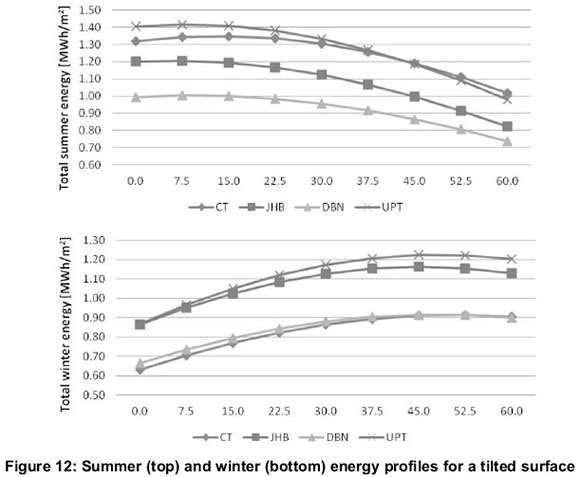
Table 6 shows the increase in energy by adjusting the tilt angle to accommodate the sun.
4.2 System performance
The LP SWH simulated in TRNSYS had 21 vacuum tubes of inner tube diameter = 34 mm and tube length = 1.42 m and 153 litre tank. Details of the system are presented in (Budihardjo, 2005). Figure 13 shows the effect of tank temperature increases on the mass flow rate within the tubes and the energy collected by the collector (a tilt angle of 45o). The topmost subplot represents the energy collected by one vacuum tube.
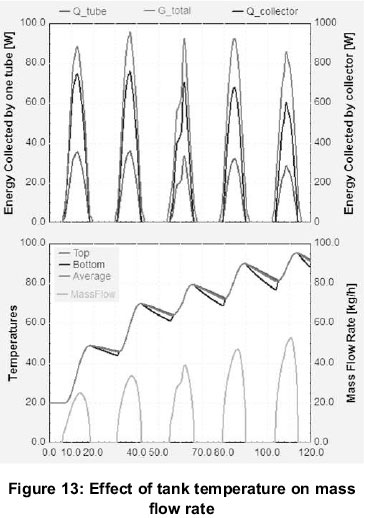
It was clear that an increase in the tank temperature affected the mass flow rate and this was attributed to the effect of the Prandtl number. As the tank temperature increased, the Prandtl number decreased because the viscosity and specific heat decreases, and the thermal conductivity increases. A lower viscosity ensures less resistance in fluid flow and thus a larger mass flow. The high thermal conductivity ensures that heat is conducted more efficiently throughout the fluid and the higher buoyancy force results in the lower specific heat, requiring less heat to raise the temperature of the fluid by one degree (increasing the density difference within the fluid). On a clear sunny summer day in Cape Town, the collector would increase the tank temperature from 20o to 50o.
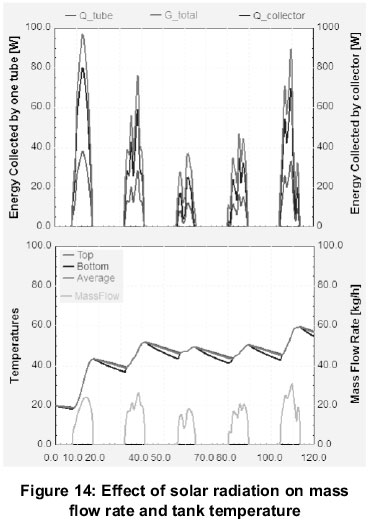
Similarly, the amount of solar radiation the collector utilizes affects the tank temperature and mass flow rate as seen in Figure 14. These simulation results are from a typical winter day in Cape Town.
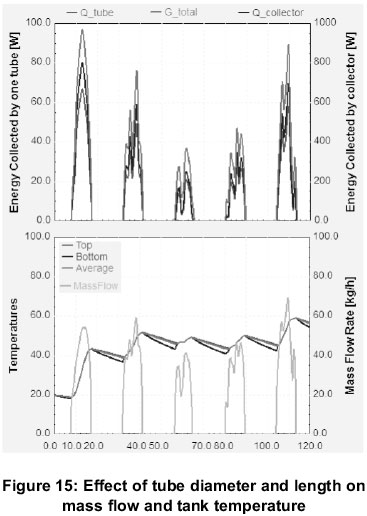
The parameters (tube length, tube diameter and tank size) of the system were changed to illustrate its effects on the system performance. It was found that if the 21 tubes were replaced with 12 tubes with a diameter of 47 mm and length of 1.8 m, similar results were found as in Figure 15. The energy collected by the collector was the same, however, the power rating of each tube increased from approximately 40 W to 70W. This was attributed to the increase in diameter and length of the tube. This change greatly affected the mass flow rate within the tubes as represented in the following graph.
Research in the Department of Electrical Engineering, at the University of Cape Town is investigating the performance of a LP SWH with the following specifications; tank size of 100 L with 12 tubes, tube inside diameter 42 mm and length 1.8 m. The collector's performance was monitored in two geographical locations (Cape Town and Johannesburg). Tests were done on the system to determine the heat loss coefficient of the tank and tubes, and the optical efficiency of the collector.
These results were used in the TRNSYS simulation program. Simulation results give a good approximation of the system performance when attributes of the system components are changed. These results can be used for design considerations and installations of LP SWHs to accommodate the consumer's needs and maximization of solar radiation received.
5. Design and installation considerations for LP SWHs
The most influential factor in selecting a solar collector is the geographical location specific. Each location is unique with varying weather conditions throughout the year and the site latitude. Thus it is important to perform a detailed solar resource assessment of the site. Various data bases on the Internet are available to obtain reliable information regarding weather data and annual solar radiation availability. As seen from the simulation results, the tilt angle of a collector should be adjusted to accommodate the winter and summer seasons. For fixed tilt angle, which account for large number of installations, an optimum tilt angle is recommended. However, this 'optimal' angle should offer adequate hot water during the winter when the hot water is needed most. If the location is prone to more cloudy weather conditions, where solar radiation is limited, for example, Durban, more tubes should be considered to deliver the same system performance of a collector of the same size situated in a more favourable location, for example, Upington.
Importantly, a detailed hot water usage profile should be taken into account. This profile should reflect the number of family members in the household and their hot water use habits. Table 7 shows a sample guide that can be used to determine the size of the solar tank.
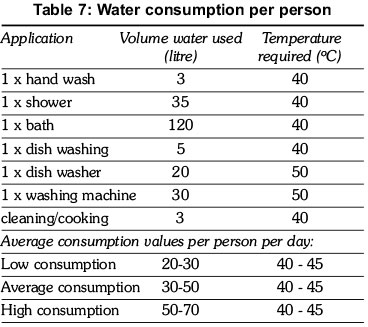
The following procedure can be followed to determine the tank and collector size for a family. For example, for a family of 4, the volume of the tank can be determined by equation 2:

The heat required to heat up the water from 15°C to 45°C every day is:
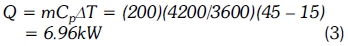
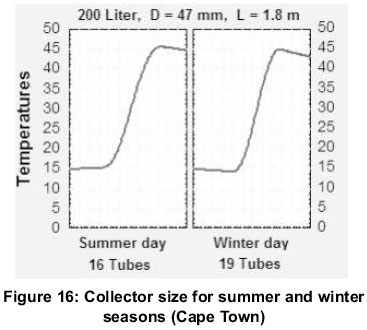
Hence a collector delivering 7kWh/day can provide the family with sufficient hot water. Power ratings of the tubes can be determined from the tube dimensions. For example, a tube with an inner tube diameter of 47 mm and tube length of 1.8 m, can provide approximately 450 W/day of power in the summer and 380 W/day in the winter for Cape Town weather conditions. This translates into 16 tubes required during summer and 19 tubes in the winter. The results of these calculations were considered in the simulation model and results shown in Figure 16 agree.
The flow rate in the tubes can be altered by changing the tube dimensions as earlier shown in Figure 14 and 15 with the smaller tubes delivering a lower mass flow rate than the larger tubes. This is because an increased number of smaller tubes are required to deliver the same amount of heat; however, this could increase system costs. In such circumstances, it is recommended that the tube dimensions are changed, rather than the tilt angle of the collector due to the possibility of losing available solar radiation.
6. Conclusion
In this paper, the natural convection phenomenon has been investigated. Two scenarios were considered, a vertical wall with a constant wall temperature and a vertical wall with constant heat flux.
Similarity solutions where applied to the governing equations to transform partial differential equations to ordinary differential equations. These equations were solved in MATLAB to obtain velocity and temperature profiles. The figures provided a great insight in the natural convection taking place in these scenarios. It was observed that the scenario of the constant heat flux along the wall would better represent solar radiation found on a vacuum tube from a LP SWH.
Further investigations showed that the two dimensional model is a good representation of the thermo-siphon process observed in single ended vacuum tubes. A simulation model was developed to ascertain the system performance of the LP SWH. In the simulation results, it was clear that the tank temperature, tube dimensions (length and diameter) and solar radiation absorbed by the tube, affect the mass flow rate. Through simulation, the optimal tilt angles for different geographical locations were identified. At least two tilt angles are required (summer and winter) to maximize the solar radiation utilized by the collector, thus the standardized 45 degree angle is not the optimal tilt angle to use throughout South Africa.
An increase in efficiency of 11% to 14% is observed if tilt angles are adjusted seasonally. The optimal tilt angle for Cape Town during winter seasons was found to be approximately 52.5o. From the simulation results, a guide to deployment of LP SWH could be obtained and has been included in this paper to assist LP SWH manufacturers in their design and installation considerations.
References
Budihardjo I., Morrison G.L. and Behnia M. (2004). Development of correlation of natural circulation flow rate through single-ended evacuated tube solar collector. Proceedings of 1st International Forum on Heat Transfer, Kyoto, Japan, 2004. [ Links ]
Budihardjo, I. (2005). Evacuated tubular solar water heaters, PhD Thesis, University of NSW. 2005. [ Links ]
Lighthill, M.J. (1953). Theoretical considerations on free convection in tubes, Quart. Journ. Mech. and Applied Math. 1953, Vol. 6(4), pp.398-439. [ Links ]
Ostrach, S. (1953). An Analysis of Laminar Free-Convection Flow and Heat Transfer about a Flat Plate Parallel to the Direction of the Generating Body Force. NACA Report 1111. 1953. [ Links ]
Pohlhausen E. (1911), Der Warmeaustausch Zwischen Festen Korpen und Flussigkeiten mit kleiner Reiburg and kleiner warmeleitung, Z Angew. Math Mech. Vol 1:115 [ Links ]
Schmidt, E. and Beckmann, W. (1930). Das Temperatur-und Geshwindigskeitsfel Von einer Warme Abgebenden Senkrechten Platte bei naturlicher Konvektion. Forsch-Ing_Wes. 1930, Vol 1:391. [ Links ]
Schmid R., Pailthorpe B.A. and Collins R.E. (1986). Heat Transport in Liquid Filled Tubes, Aust. J. Phys. 1986, Vol. 39, 919-43. [ Links ]
Shahi, M. (2009). Numerical simulation of 3-Dimensional steady flow and heat transfer in single-ended tube, MSc thesis, The University of Semnan, Semnan, Iran, 2009. [ Links ]
Sparrow, E.M. and Gregg, E.L. (1956). Laminar Free Convection from a Vertical Flat Plate with Uniform Surface Heat Flux. (Trans ASME). 1956, Vol. 78: pp.435-440. [ Links ]
Tang T., Gao W., Yu Y. and Chen Y. (2009). Optimal tilt-angles of all-glass evacuated tube solar collectors. Energy. 2009, Vol. 24, 1387-1395. [ Links ]
Window, B. (1983). Heat extraction from single ended glass absorber tubes. Solar Energy. 1983. Vol. 31(2), pp.159-166. [ Links ]
Zambolin E. and Del Col D. (2010). Experimental analysis of thermal performance of flat plate and evacuated tube solar collectors in stationary standard and daily conditions. Solar Energy. 2010, Vol. 84, pp. 1382-1396. [ Links ]
Received 27 June 2012
Revised 11 March 2014

