


Servicios Personalizados
Articulo
 Inglés (pdf)
 Articulo en XML
 Referencias del artículo
Indicadores

Links relacionados
-
 Citado por Google
 -
 Similares en Google
Compartir

 Permalink
Journal of Energy in Southern Africa
versión On-line ISSN 2413-3051
versión impresa ISSN 1021-447X
J. energy South. Afr. vol.25 no.3 Cape Town ago. 2014
ARTICLES
Clear sky solar illuminance using visual band irradiance
A Nurick
Department of Mechanical Engineering Science, University of Johannesburg
ABSTRACT
Solar illuminance may be quantified by applying relevant efficacy functions to available full spectrum ground irradiance. Alternatively, illuminance may be determined by applying the Photopic function to ground level irradiance spectra obtained from the terrestrial irradiance spectrum adjusted using relevant atmospheric absorption and scattering coefficients. The Photopic function has finite values in the wavelength range of 400 nm to 700 nm and is concentrated around a mean wavelength of 555 nm with irradiance at wavelengths close to 555 nm contributing to the major portion of illuminance. Calculation of ground level direct, diffuse and hence global illuminance is simplified as absorption of irradiance in the atmosphere by water vapour and uniformly mixed gases is negligible and may be ignored. It is shown that due to the small variations in the overall irradiance over wavelengths in the visible bandwidth combined with the concentration effect of the Photopic function in this wavelength range illuminance may be calculated, with good accuracy, using constant extinction functions for both direct and diffuse illuminance. Due to the concentration of illuminance by the Photopic function global illuminance data were also correlated with a simplified description of illuminance attenuation through the atmosphere based on the Beer-Lambert-Bouger Law using a single constant effective extinction coefficient which accounts for all extinction processes under clear sky conditions over the visible range of wavelengths. Constants used in extinction functions for solar irradiance due atmospheric aerosols were obtained by fitting experimental data to analytical descriptions of atmospheric extinction while published constants were used for ozone and Rayleigh scattering. The analytical descriptions of global illuminance with solar elevation were compared with experimental data collected at Johannesburg over both summer and winter clear sky conditions. Correlations of measured and calculated global illuminance data for the method based on extinction of various atmospheric components was 4.47 % and 4.49 % for the method based on the Beer-Lambert-Bouger Law, both normalised using the terrestrial illuminance constant. While measurements were made at a specific site in Gauteng, the methods used to correlate the data are general and location independent but local climatic conditions may need to be taken into account to quantify the extinction coefficients for specific areas.
Keywords: solar, global illuminance, extinction.
1. Introduction
In the USA, 35% of electrical power generation is used for lighting during the day, and in some regions, it may be as high as 45% (Haliburton, 2005). In South Africa, approximately 22% of the electrical power consumed in commercial buildings is used for lighting (Cousins, 2013). It follows that scope exists to replace lighting powered by electricity with solar illuminance.
It was reported in 2006 that atmospheric concentrations of carbon dioxide over the 400 000 years preceding the industrial revolution, covering four glacial and interglacial cycles, varied cyclically from lows of 180 ppm to highs of 280-300 ppm (Fedorov et al., 2006). Since the advent of the industrial revolution, carbon dioxide concentrations have increased exponentially and at the turn of the century were greater than 380 ppm (Fedorov, 2006; Planetforlife, 2008; Earth Systems Research Laboratory, 2013). In 2013 atmospheric concentrations of carbon dioxide reached 400 ppm for the first time since data were recorded (Lund, 2013). It is becoming increasingly clear that illumination which does not include the full natural wavelength spectrum, and specifically the right amount of ultraviolet light can negatively affect human health and behaviour (Ott, 1973; Rea, 2002). Preliminary tests carried out with a spectroradiometer indicated that approximately 95% of ultra violet irradiance does not pass through either 3 mm or 6 mm thick glass implying that in interior areas where solar illuminance has passed through glass human health could be at risk.
A concern for the increase in carbon dioxide concentrations in the atmosphere, and particularly that due to electrically powered interior lighting is causing some countries to ban low efficiency incandescent light bulbs. Australia (BBC News, 2007) and Canada (Puxley, 2007) have announced their intention to ban the use of incandescent lamps in favour of more efficient light sources. The Australian Minister of the Environment noted that this could cut annual greenhouse gas emissions by 4 million tonnes by 2012. To reduce energy consumption in South Africa, Eskom (Electricity Supply Commission) embarked on a large scale programme to exchange Compact Fluorescent Lights for incandescent light bulbs (Eskom, 2013). Also, in South Africa, the levy on incandescent light bulbs was to be increased in 2013 (SARS, 2013), and further, the South African Minister of Energy further stated in December 2011 after the 17th Conference of the Parties of the UN Framework Convention on Climate Change (COP17) that incandescent light bulbs will be banned in South Africa prior to 2016 (IOL News, 2014)
It follows that there are considerable advantages to be gained by illuminating interior areas using solar illuminance, preferably with light that has not passed through glass. This could be achieved by ducting the direct component of solar illuminance, perhaps after being concentrated in a parabolic reflector, into buildings. Problems related to the sporadic nature of solar illuminance may be counteracted by using hybrid full spectrum lighting systems in which an electrical complementary light source is used to maintain a constant level of illumination. Advantages of using such hybrid systems include a reduced overall demand for fossil based fuels.
The need for day lighting data which may be used for interior illumination by architects combined with a general lack of this data prompted the use of available irradiance data to predict illuminance. Models based on parameters including global irradiance, diffuse irradiance, solar zenith angle, turbidity, optical air mass, and precipitable water were developed to predict luminous efficacy (Wright et al., 1989; Perez et al., 1987; Perez et al., 1990; Perez et al., 1993). Luminous efficacy algorithms were used with varying success in countries, such as, New Zealand (Pohlen et al., 1996), Garston in the United Kingdom (Littlefair, 1994), France (Dumortier, 1997), and four European IMDP stations (Skartveit et al., 1997). To provide data for day lighting designers the characteristics of sky luminance, that is luminance from the entire sky which may be used for interior lighting, was characterised by, for example, Perez et al. (1993), Littlefair (1994), Darula et al. (2002) and Li et al. (2007).
Dispersion and absorption of electromagnetic radiation in the earth's atmosphere is caused by a number of mechanisms which are wavelength dependent (Gates, 1996; ASTM, 2009). At shorter wavelengths, Rayleigh dispersion of electromagnetic radiation is effected by gas molecules in the atmosphere with radii typically 1/10 of the wavelength of the incident wave (Fishbane et al., 1996; Gates, 1978). Such scattering is highly frequency dependent and affects shorter wavelength radiation typical of ultraviolet light to a greater extent than radiation with longer wavelengths resulting in the blue colour of the atmosphere and a tendency to concentrate the remaining irradiance towards longer wavelengths. Mie scattering of electromagnetic radiation at all wavelengths by isotropic, homogeneous, dielectric spheres (Mie scattering, 2013) is the predominant scattering mechanism when atmospheric particles have an effective diameter greater than the wavelength of the radiation being scattered (Blue Sky and Rayleigh scattering, 2013). Scattering of irradiance is a function of wavelength and is not uniform across the irradiance spectrum. Methods used to correlate illuminance data quantify the extinction of irradiance by each relevant factor mentioned above in order to develop a predictive model effective over the visible range of wavelengths (Leckner, 1978; Bird, 1984; Gueymard, 2001).
Since dispersion of irradiance is wavelength dependent and since the research is aimed at characterising illuminance, the illuminance was determined directly by measuring irradiance over a wavelength range of 274 nm to 898.5 nm using a spectroradiometer and applying the Photopic function (Commission Internationale de l'Eclairage, 1973) standard human eye response to this limited irradiance range to calculate the illuminance. This eliminates the practice of measuring irradiance over wavelengths outside the visible range and then correcting the data to include extinction effects in the collected irradiance data, a method which was prompted by the lack of spectral illuminance data, and the availability of irradiance data, as already mentioned.
A program to characterise levels of solar illuminance was initiated at the University of Johannesburg. The measurements used were collected from April to December, and their correlation with analytical prescriptions is presented. The effect of altitude and the consequent reduction in air mass was included by using the local atmospheric pressure to adjust the air mass.
Data were correlated with two analytical methods. The first was based on calculating illuminance by applying the Photopic function to spectral direct and diffuse irradiance reaching the earth's surface after Rayleigh scattering, absorption by ozone, and scattering and absorption by aerosols in the atmosphere (Leckner, 1978; Bird, 1984) were taken into account. The second was based on the Beer-Lambert-Bouger Law (Beer-Lambert Law, 2013; Beer's Law, 2013) to obtain a single effective coefficient to describe the extinction of electromagnetic radiation through the atmosphere.
2. Analytical background
Method based on wavelength specific scattering and absorption
Direct illuminance
The analysis is based on a simplification of that presented by Leckner (Leckner, 1978). An analysis based on Bird (1984) gave similar results provided corresponding atmospheric constants were used. The extinction of direct terrestrial irradiance (Thekaekara, 1973; Bird, 1984) through the atmosphere has been quantified (Leckner, 1978; Bird, 1984, Gueymard, 2001) by providing extinction coefficients for Rayleigh scattering, ozone absorption, absorption by uniformly mixed gases, water vapour absorption, and aerosol attenuation over an irradiance bandwidth of 290 nm to 4000 nm. The direct spectral irradiance on a surface element normal to the sun's rays at a wavelength λi is given (Leckner, 1978) as:

where E0i is the extraterrestrial spectral irradiance, and the extinction coefficients τri, τozi, τgi, τwi and describe Rayleigh scattering, ozone absorption, absorption by uniformly mixed gases, water vapour attenuation, and aerosol attenuation respectively. Illuminance at a wavelength λi is given by:

where Fi is the Photopic function multiplier at wavelength λi (CIE, 1973).
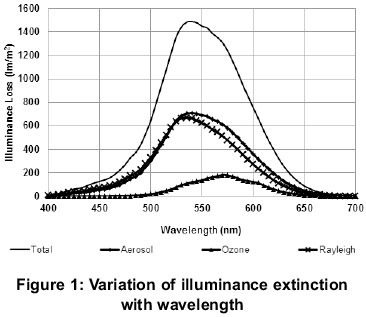
The irradiance bandwidth relevant to illuminance spans a wavelength range from approximately 400 nm to 700 nm. The illuminance loss due to extinction through the atmosphere for each of the five factors at a wavelength λi included in equation (1) may be calculated using:

where τi is the extinction coefficient for the component of interest at the given wavelength. The total illuminance loss for each component would then be obtained by numerically integrating equation (3) across the illuminance spectrum. Based on the extinction coefficients given by Leckner (1978) and Bird, (1984), it may be shown that extinction of irradiance due to water vapour and mixed gases in the wavelength interval of 400 nm to 700 nm is zero and negligible respectively and extinction of illuminance by these two components may be ignored in the visible bandwidth. The variation of illuminance extinctions with wavelength due to aerosols, ozone, and Rayleigh scattering, calculated using equation (3), are presented in Figure 1 for an elevation of the sun of 90o and an atmospheric pressure of 101.3 kPa, that is, for an air mass of 1. The ratios of these illuminance extinctions to the total are 47.4 %, 43.3 %, and 9.3 0% for aerosol extinction, Rayleigh scattering, and ozone respectively. These percentages are weak functions of the elevation of the sun and atmospheric pressure and while they are functions of these parameters the percentages are similar for a wide range of solar elevations and atmospheric pressures indicating that illuminance extinction due to water vapour and gases may be ignored for all atmospheric and geometric conditions of interest, and the major contributor to illuminance attenuation in the atmosphere is due to aerosol extinction and Rayleigh scattering.
Since only the effects of ozone, aerosols, and Rayleigh scattering are significant in the visual wavelength band, equation (1) may be reduced to:

Substituting the equations for the extinction coefficients τri, τozi, and τai presented by Leckner (1978) into equation (4) gives:

where m is the air mass, ki is the spectral absorption coefficient for ozone at wavelength λi, l is the total amount of ozone in a vertical column at normal temperature and pressure, β is a turbidity coefficient, and a a wavelength coefficient relevant to aerosol extinction (Leckner, 1978). (The expressions are valid for wavelengths given in µm).
The air mass m is a function of altitude and path length of irradiance through the atmosphere and is given by:
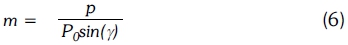
where P is the atmospheric pressure, P0 is the atmospheric pressure at sea level, and y is the solar elevation. At sea level P = P0 and for the sun vertically above a location  = 90° and m = m0 = 1.
The turbidity (amount of aerosol integrated vertically through the atmosphere) coefficient is (Leckner, 1978):

where β0 is the Ångström turbidity coefficient and a is the wavelength coefficient. The Ångström turbidity coefficient at 30o N can vary from 0.047 to 0.187 (Leckner, 1978). Power et al used weather station data collected over a period of some 27 years in South Africa to compute Ångström turbidity coefficients at eight locations for all weather conditions including both clear sky and overcast conditions (Power et al., 2001). Calculated Ångström turbidity coefficients for Pretoria (closest location recorded to Johannesburg) at latitude 25.7o S varied from 0.027 to 0.071 for all months of the year, including the rainy season. Turbidity coefficients are typically lower in the Southern than Northern Hemisphere (Power et al, 2001). The mean turbidity coefficient for the dry months of April to August in Pretoria was 0.0333 and for the year was 0.047. Power et al noted from their analyses of South African data that the highest turbidity coefficients occurred at the main centres of Pretoria, Durban and Cape Town and less at smaller townships. This could be ascribed to augmentation of atmospheric turbidity by anthropogenic aerosols (Power et al., 2001). The Ångström turbidity coefficient for the recorded data was obtained by minimising the standard deviation between the illuminance obtained using Leckner's method (Leckner, 1978) and the measured data. This gave an Ångström turbidity coefficient of 0.055 which was higher than the values obtained for Pretoria during the dry season but could be explained by the greater anthropogenic effects possible over Johannesburg.
Typical wavelength coefficients a occur mainly in the range of 1.3 to 2 (Leckner, 1978). The maximum value of a = 2 in this range was used as the standard deviation between the Leckner derived and measured data equalled the minimum obtained.
Equation (5) may be rewritten as:

The variation of the term:

with wavelength for m = 1, l = 0.25 (typical in tropics (Leckner, 1978)), β0 = 0.055, and a= 2 is shown in Figure 2 together with a normalised Photopic function amplitude distribution.
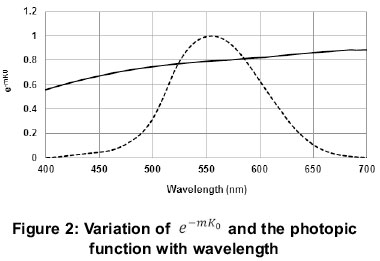
At a wavelength of 555 nm, the wavelength at which maximum eye response occurs, ki = 0.095 (Leckner, 1978; Bird, 1984) and mK0 = 0.2302; Exp(-0.2302) - 0.7944. The difference between an average value of Exp(-mK0) over a wavelength band extending from 495 nm to 605 nm is 1.4 % of the value at a wavelength of 555 nm. It is reasonable to assume for illuminance extinction that a mean constant extinction coefficient of K0 = 0.2302 (m = 1) at an effective constant wavelength of λ = 555 nm may be used. Under these conditions, direct illuminance is given by:
where F is the photopic function, m0 = 1 is the air mass at sea level with the sun vertically overhead (Gates, 1966; Leckner, 1978; Beer's law, 2013), and K0 is defined in equation (9). For the limited bandwidth considered K0 may be considered to be constant over the interval of interest.
The direct illuminance is then given by:

where I0 is the terrestrial solar illuminance constant. Equation (11), which excludes the diffuse illuminance and has a form which would be obtained by applying the Beer-Lambert-Bouger Law (Beer-Lambert Law, 2013; Beer's Law, 2013) to the extinction of irradiance in the atmosphere.
Diffuse illuminance
Diffuse radiation from a clear sky may be based on the difference between a direct beam of radiation and a fictitious beam subject only to gaseous absorption Leckner (Leckner, 1978). Using the formulations presented by Leckner for diffuse radiation from a clear sky and including only extinction functions which affect the visible part of the irradiance spectrum the diffuse illuminance may be written, based on Leckner's formulation (Leckner, 1978) as:

Again, noting the small changes of the extinction functions over the visible wavelength bandwidth, this equation may be written, assuming mean values at a wavelength of 555 nm as:

where KD = 0.5 is a constant which gives 'the magnitude and spectral distribution of diffuse radiation from a pure Rayleigh atmosphere with a non-reflecting ground' (Leckner, 1978).
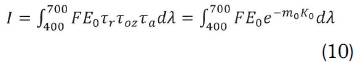
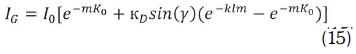
The global illuminance is given by the sum of the direct and diffuse illuminance as:

Substituting the spectral transmittance functions, as given, global illuminance is given by:
It is accepted that later descriptions of spectral transmittance functions exist (Gueymard, 2001; Gueymard, 2004) but the data of Thekaekara (1973) and Leckner (1978) proved to be adequate.
Single term extinction function based on Beer-Lambert-Bouger Law
This method is based on the Beer-Lambert-Bouger Law (Beer-Lambert Law, 2013; Beer's Law, 2013) and is similar to the Langley method used to calibrate sun photometers (Shaw, 1983). The form of equation (9), combined with the experimental data, indicates for atmospheric conditions at a particular site scattering and absorptance of illuminance may be expressed by a single representative constant and global illuminance is a function of the elevation of the sun modified by the air mass, which is related to the distance irradiance has passed through the atmosphere. This is further supported by measurements (Tsikaloudaki, 2004) which indicated that efficacy is a function of the elevation of the sun.
The extinction of luminous intensity in an atmosphere where the composition of the atmosphere remains constant, but the number of particles per unit volume, or the density, varies, and the attenuation of illuminance is proportional to the illuminance as given by Beer-Lambert Law (2013) and Beer's Law (2013):
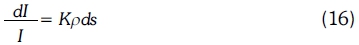
where I is the illuminance, K is an effective ex- tinction coefficient,  is the density of the medium through which the illuminance is passing, and s is the distance measured along a ray of sunlight.
The relationship between altitude and the light path length is given by:

where  is the elevation of the sun. This is a reasonable approximation for solar elevation angles greater than 18o (Gates, 1966). For smaller angles of elevation corrections should be made for atmospheric refraction (Bemporad, 1907., cited in Gates, 1968). In this work, the actual measured angles of elevation were used as most of the measurements were taken at elevation angles greater than 18o.
Combining equations (16) and (17) and integrating across the path length through the atmosphere gives:
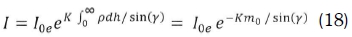
where m0 = 1 is the air mass (Gates, 1966; Leckner, 1978; Beer's Law, 2013) at sea level for a beam which is perpendicular to the surface of the earth and I0e is a terrestrial solar illuminance constant derived from the measurements.
The illuminance at altitudes other than sea level with the sun at an elevation of may be obtained by including equation (6) in equation (18) to give:

A convenient form of this equation for determining the measured constants and from experimental data is:

3. Experimental equipment
Sun's elevation
While it is accepted that the elevation of the sun may be calculated accurately, for these tests it was measured using a simple sextant to assemble a comprehensive experimental data set. Elevation of the sun could be read to 0.5o. The variations of global illuminance with elevation of the sun were checked using calculated elevations (Stine et al., 2012). Differences in correlations of global illuminance with elevation of the sun using the measured and calculated elevations were found to be negligible. This could be attributed to the fact that the data scatter was due mainly to the illuminance readings.
Illuminance
Global illuminance was measured using an Apogee Instruments Inc. model UV-Par Spectroradiometer S/N: 07030922. The Spectroradiometer incorporates a 2048 pixel, 14 x 200 µm microelement array used to measure the electromagnetic energy in the nominal wavelength range of 300 nm to 850 nm. Readings for this set of experiments were taken over the wavelength range of 274 nm to 898.5 nm.
The spectroradiometer was calibrated by the manufacturer with a LI-COR LI1800-02 Optical Radiation Calibrator, S/N ORC-394. The lamp (radiation source) inside the LI1800-02 is an FEV 200 W quartz tungsten halogen lamp operated at an approximate colour temperature of 3150 K. The lamp model number is LI1800-02L, S/N ORL-996. It was calibrated against a working standard lamp, 1000 W quartz halogen lamp. The wavelength range is 300-1100 nm, with accuracy specifications of 5 % for 300-350 nm and 1000-1100 nm, and 4 % for 350-1000 nm. The lamp output (spectral output) is stable to 1 % for 50 hours of use with the constant power regulator in the LI1800-02. Illuminance is calculated from the irradiance data using the CIE photopic function. The spectroradiometer was calibrated by the manufacturer nine months before the illuminance was measured. Illuminance readings are obtained by multiplying the measured irradiance with the Photopic function built into the software of the spectroradiometer.
4. Experimental procedure
All readings were recorded at latitude 26.17° S, longitude 28.14° E, at an altitude of 1715 m, where the atmospheric pressure was 83.5 kPa. At this latitude, the maximum elevation of the sun at the summer solstice is 87.3o.. The data set is comprised of 1261 readings taken over summer and winter conditions.
Measurements were taken at 10 minute intervals on cloudless days over the measurement period. For each global illuminance measurement the probe was aligned to face the sun by aligning the shadow of the top of the probe with its base. The integrating time constant was set at 20 ms to ensure that the thermopile was not saturated. Saturation of the thermopile was evidenced by distortion of the irradiance curve on the computer screen at wavelengths around 550 nm.
5. Results
Method based on wavelength specific scattering and absorption
As already described, the method is based on constant scattering and absorption coefficients over the visible range of wavelengths with the constants being equal to those at 555 nm. For this work, the values used were k = 0.095, l = 0.25, β0 = 0.55 and a = 2 (Leckner, 1978. The turbidity coefficients for aerosol extinction are strongly dependent on atmospheric conditions (Leckner, 1978) and these were adjusted to optimise the fit of equation (15) to the measured data. In effect all the constants affect the value of K0 and the net result was to adjust K0 to give a good match between the predicted and measured values of illuminance.
The variation of the global experimental illuminance data and those predicted using equation (15) together with the extinction coefficients with 1/m are presented in Figure 3. The predicted results are presented as a white line for clarity.
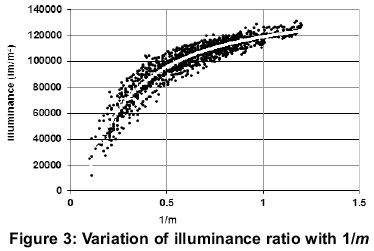
The standard deviation of the differences between the measured and calculated illuminance, normalised using a terrestrial illuminance constant of 136700 lm/m2 (Johnson, 1954) is 4.47 %.
Method based on the Beer-Lambert-Bouger Law
For this method, the experimental data was used to obtain the constants l0e and K in equation (20). The natural logarithm of the illuminance readings were plotted against the air mass m in Figure 4 allowing extraction of the constants using a linear least squares method.
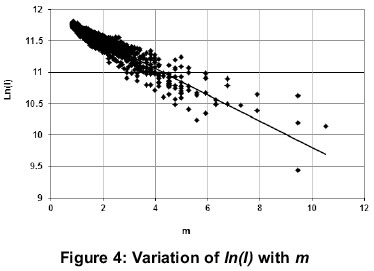
The linear least squares least fit yielded:

with R2 =0.8773. The effective solar illuminance terrestrial constant for the experimental data set, and K are:


A standard method for measuring the terrestrial irradiance constant is Langley Extrapolation (Shaw, 1983) which is based on Beer's Law (2013). The method is based on measuring irradiance on a cloudless day over a short period; say a morning, in which it is assumed that the physical state of the atmosphere is constant. The experimental data used here was collected over a period of eight months and as such constitute average scattering and absorption coefficients.
The difference of 6.9% between the measured terrestrial illuminance constant and the 136 700 lm/m2 (Johnson, 1954) cited can be attributed to, apart from lumping the direct and diffuse illuminance together, factors such as variations of the atmosphere with latitude and atmospheric altitude and consequent atmospheric variations along light paths to the location on the earth and averaging the results over a lengthy period. The terrestrial illuminance constant may be considered to be an overall effective terrestrial illuminance constant suitable for the method presented. The extinction coefficient () for the method based on the Beer-Lambert-Bouger Law gives a larger rate of extinction than that obtained for extinction of the direct component of illuminance based on the method of Leckner's formulations (). This could be attributed to account for extinction of the diffuse component of illuminance which is added in the latter method.
Rather than present a direct comparison of the measured illuminance with those predicted using equation (19) a comparison is presented of luminance predictions using equations (15) and (19) in Figure 5; which in effect gives the comparison.
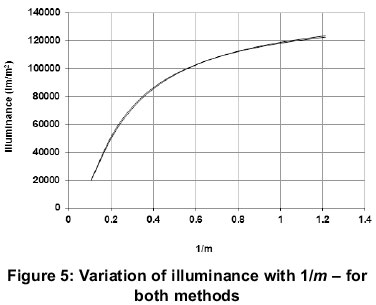
The standard deviation of the differences between the measured and calculated illuminance for this method, normalised using the terrestrial illuminance constant is 4.49 %.
The standard deviation of the differences between the illuminances calculated for figure 5 normalised using the terrestrial illuminance constant is 1.56 %. The two approaches essentially give the same result which is not surprising as the direct component of illuminance is described by a form similar to equation (18).
The effect of the elliptical orbit of the earth around the sun on the fit between the measured and predicted illuminance was checked to determine whether the 3.4 % amplitude annual variation in terrestrial irradiance (Stine et al., 2001) was evident. A correlation of the data on an annual basis did not yield an annual variation and it was found that a constant terrestrial constant gave the best fit. While it is possible to incorporate the changing distance between the earth and the sun the data yielded inconclusive results and the effects of the changing distance between the sun and earth are not included
5. Conclusions
It was shown that by limiting the derivation of illuminance to irradiance data within the visible range of wavelengths and including only scattering and absorption coefficients which affect irradiance in the wavelength band relevant to illuminance combined with the concentration effects of the Photopic function to a bandwidth close to 555 nm, a simplified formulation for both direct and diffuse illuminance using Leckner's method may be obtained.
The major contributors to extinction of illuminance in the atmosphere are by aerosols (47%) and Rayleigh scattering (43%). Ozone absorption accounts for approximately 10%. Extinction of illuminance by water vapour and gasses may be ignored allowing for a simplified formulation for calculating illumiance at ground level.
The standard deviation between the measured illuminance data and that predicted using the spectral analysis based on Leckner's formulations normalised with the terrestrial illuminance constant was 4.47%.
Due to simplification of the physical processes affecting extinction and absorption of irradiance in the visible bandwidth the Beer-Lambert-Bouger Law for electromagnetic extinction in a variable density atmosphere was used to present a simple formulation for correlating global illuminance with elevation of the sun.
The standard deviation between the measured illuminance data and that predicted using the latter method normalised with the terrestrial illuminance constant was 4.49%.
The standard deviation between the illuminance predictions of the two methods was 1.56%. Either method may be used to correlate local illuminance data with solar elevation and air mass to good accuracy.
An effective terrestrial illuminance constant measured over a long period was 6.9 % greater than the constant of 136 700 lm/m2. This was attributed to the greater variation in atmospheric conditions occurring over periods much longer than the fraction of a day used in Langley Extrapolation.
Simplified methods for calculating direct and diffuse illuminance which may be used for day lighting calculations have been presented.
Acknowledgements
Grateful thanks go to Mantswaveni Mukhawana for assistance with the experimental work, to the University Research Committee for financial support, to the ENERKEY project for general support for energy research, and the University's Quick-Wins Research Program.
References
ASTM (American Society for Testing and Materials) Terrestrial Reference Spectra http://rredc.nrel.gov/solar/spectra/amL5/ -retrieved 11 February 2009. [ Links ]
BBC News Australia pulls plug on old bulbs -news.bbc.co.uk/ 2/hi/asia-pacific/6378161.stm. Retrieved 19 September 2007. [ Links ]
Beer-Lambert Lawhttp://eb.wikipedia.org/wiki/Beer%27s_law. Retrieved 28 January 2013.
Beer’s Law
Eric Weisstein's World of Physics http://scienceworld.wolfram.com/physics/BeersLaw.html - Retrieved 28 January 2013. [ Links ]
Bird R E., (1984). A Simple Spectral Model for Direct-Normal and Diffuse Horizontal Irradiance, Solar Energy, 32(4), 461-471. [ Links ]
Blue Sky and Rayleigh Scattering http://hyperphysics.phy-astr.gsu/hbase/atmos/blusky.html. Retrieved 28 January 2013 [ Links ]
Commission Inernaionale de LEclairge (CIE), (1973). Standardization of Luminous Efficacy Distribution on Clear Skies, CIE Pub. No. 22, Paris. [ Links ]
Cousins, T. (2013). Achieving Electrical Load Reductions and Cost Savings in Commercial Buildings, TLC Engineering Solutions (Pty) Ltd -Retrieved 28 January 2013. [ Links ]
Darula, S., and Kittler. R., (2002). CIE general sky standard defining luminance distributions. www.esim.ca/2002/documents/Proceedings/other2.pdf. [ Links ]
Dumortier. D., (1997). Evaluation of Luminous Efficacy Models According to Sky Types and Atmospheric Conditions Proceedings Lux Europa Conference, Amsterdam, May 11-14, 1068-1080. [ Links ]
Earth Systems Research Laboratory http://www.esrl.noaa.gov/gmd/ccgg/globalview/co2/co2_intro.html Retrieved 19 April 2013. [ Links ]
Eskom - COP17 fact sheet http://www.eskom.co.za/content/Efficient%20Lighting%20Programme%20involv-ing%20the%20rollout%20of%20Compact%20Fluorescent%20Lamps%20(CFLs).pdf - Retrieved 12 April 2013. [ Links ]
Fedorov, A. V, (2006). The Pliocene Paradox (Mechanisms for a Permanent El Nino) Science, 312, 1485-1489. [ Links ]
Fishbane, P. M., and Gasiorowicz, S. T. (1996). Physics for Scientists and Engineers, Second ed. Prentice Hall, New Jersey, pp.978-981. [ Links ]
Gates, D. M., (1966). Spectral distribution of solar radiation at the earth's surface. Science, 151, Number 3710, 523-529. [ Links ]
Gueymard, C. A., (2001). Parametrized Transmittance Model for Direct Beam and Circumsolar Spectral Irradiance. Solar Energy, 71(5), 325-346. [ Links ]
Gueymard, C. A., (2004). The sun's Total and Spectral Irradiance for Solar Energy Applications and Solar Radiation Models. 76, 423-453. [ Links ]
Haliburton. M-S., (2005). Cool Light on Hot Days: Fibre Optics Bring the Sun Indoors. Pure Energy Systems News; 26 July 2005. [ Links ]
IOL News South Africa to ban light bulbs, http://www.iol.co.za/news/south-africa/kwazulu-natal/sa-to-ban-light-bulbs-1.1194763 - Retrieved 1 August 2014. [ Links ]
Johnson, F S., (1954). The Solar Constant. American Meteorological Society, 11(6), 431-439. [ Links ]
Leckner, B., (1978). The spectral distribution of solar radiation at the earth's surface - elements of a model. Solar Energy, 20(2), 143-150. [ Links ]
Li, D. H. W., Lau, C. S., (2007). An analysis of no overcast sky luminance models against Hong Kong data. Journal of Solar Energy Engineering, 129, 486-493. [ Links ]
Littlefair, P. J., (1994). A Comparison of Sky Luminance Models with measured data from Garston, United Kingdom. Solar Energy, 53(4), 315-322. [ Links ]
Lund, C., (2004). Atmospheric CO2 concentrations just passed 400 parts per million. http://400.350.org/ -Retrieved 4 August 2014. [ Links ]
Mie Scattering http://www.ess.uci.edu/~cmcclinden/linh/xx/node19.html - Retrieved 28 January 2013. [ Links ]
Ott, J.N., (1973). Health and Light, Columbus: Ariel Press. [ Links ]
Perez, R., Webster, R., Seals, R., Stewart, R., and Barron, J., (1987). Variations of luminous efficacy of global radiation zenith illuminance with weather conditions: description of a potential method to generate key daylight availability data from existing solar radiation data bases, Solar Energy, 38 (1), 33-44. [ Links ]
Perez, R., Ineichen. P., Seals, R., Michalsky. J., and Stewart, R., (1990). Modelling Daylight Availability and Irradiance Components from Direct and Global Irradiance. Solar Energy, 44(5), 271-289. [ Links ]
Perez, R., Seals, R., and Michalsky. (1993). All-weather model for sky luminance distribution - preliminary configuration and validation, Solar Energy, 50(3), 235-245. [ Links ]
Planetforlife http://planetforlife.com/qwarm/glob1000.html - Retrieved 15 June 2008. [ Links ]
Pohlen, S., Ruck, B., and Bittar, A., (1996). Evaluation of the Perez luminous efficacy models for a Southern Hemisphere site (New Zealand -41oS, 175oE). Solar Energy, 57(4), 307-315. [ Links ]
Power, H. C., and Willmott, C. J., (2001). Seasonal and Interannual Variability in Atmospheric Turbidity over South Africa, Int. J. Climatology, 21, 579-591. [ Links ]
Puxley, P., (2007). Ontario considers banning old-style light bulbs. The Toronto Star - 21 February. [ Links ]
Rea, M. S., (2002). Light - Much more than vision. Keynote lecture, EPRI/LRO 5th International Lighting Research Symposium, Palo Alto, California. [ Links ]
Shaw, G. E., (1983). Sun Photometry. Bulletin of the American Meteorological Society, 64, 4-10. [ Links ]
SARS -National Treasury - Budget 2013, People's Guide http://www.treasury.gov.za/documents/national%20bud-get/2013/guides/2013%20People's%20Guide_English.pdf - Retrieved 12 April 2013. [ Links ]
Skartveit, A., and Olseth, J. A., (1997). Test of a luminous efficacy model on illuminance/irradiance data from 4 European IDMP stations. Third Satellite meeting, Les Marecottes., January 16/17. [ Links ]
Stine, W. B., and Geyer, M., (2001). Power from the Sun. http://www.powerfromthesun.net/Book/chapter02/chap-ter02.html - Retrieved 2 April 2012. [ Links ]
Thekaekara, M.P, (1973). Solar energy outside the earth's atmosphere. Solar Energy, 14(2), 109-127. [ Links ]
Tsikaloudaki, K., (2004). A study of luminous efficacy of global radiation under clear sky conditions in Athens, Greece, Renewable Energy, 30(4), 551-563. [ Links ]
Wright, R., Perez, R., and Michalsky, J.J., (1989). Luminous Efficacy of direct irradiance variations with insolation and moisture conditions. Solar Energy, 42(5), 387-394. [ Links ]
Received 19 April, 2013
Revised 8 August 2014

