


Servicios Personalizados
Articulo
 Inglés (pdf)
 Articulo en XML
 Referencias del artículo
Indicadores

Links relacionados
-
 Citado por Google
 -
 Similares en Google
Compartir

 Permalink
Journal of Energy in Southern Africa
versión On-line ISSN 2413-3051
versión impresa ISSN 1021-447X
J. energy South. Afr. vol.25 no.2 Cape Town may. 2014
An analysis of the solar service provider industry in the Western Cape, South Africa
Roman Votteler; Johan Hough; Chanel Venter
Department of Business Management, University of Stellenbosch, South Africa
ABSTRACT
Scientists agree that rising electricity usage of the rapidly growing human race to improve its standard of living is negatively affecting the environment. To create a sustainable environment for future generations, renewable and environmentally friendly resources have to be exchanged for the present finite resources. In South Africa, coal plants are responsible for more than 90% of electricity production. This means that action has to be taken now to start a process of change to sustainable electricity resources.
This paper focuses on the South African solar industry. Due to the high sun radiation levels, solar technology is one of the renewable energy sources with the greatest potential. The industry is in its infancy, characterised by accelerated growth expectancy and fuelled by factors such as government subsidies, the fluctuations of fossil fuel prices and the increasing focus on economical long-term sustainability. The expected growth necessitates a focus on the market positioning of solar service providers in the Western Cape, with the aim of taking full advantage of the opportunities associated with this industry.
The main objective is to determine the current structure of the solar service provider value chain and subsequently areas of improvement to increase growth, stakeholder satisfaction and sustainability.
A literature review was conducted to address the research objective, relevant approaches and the broader electricity industry. Porter's Value Chain approach was used as a foundation for the adaptation to the solar service provider value chain. Porter's Five Forces model was also used as a secondary approach, which analysed the competitive environment of the solar service provider industry in the Western Cape.
The methodology entailed a qualitative research approach in the form of semi-structured interviews. All respondents were general managers or owners of a solar service provider, who were interviewed face to face. The research focused on the entire population of solar service providers in the Western Cape. Seventy-seven different service providers were targeted, of which 18 were interviewed. The interviews were transcribed and analysed using content and frequency analysis. To guarantee reliability, a pilot study was conducted to ensure that the respondents understood the questionnaire.
The findings show that customer service is the foremost value driver for solar service providers. This entails the actual installation of the product as well as the people skills of the installation team. As most customers only have to be served once due to the long life span of the products, marketing also plays an obvious role in attracting new customers.
The most important outcome of this paper is the determination and a better understanding of the solar service provider value chain in South Africa. The recommendations, especially with regard to marketing and service elements, could improve the performance of solar service providers. The consequence could be an increase in stakeholder satisfaction and an enhanced usage of solar energy in South Africa. Future research should focus on customers to reveal preferences and opportunities for marketing approaches.
Keywords: Porter's Value Chain approach, Porter's Five Forces model, solar service provider, South African solar industry, renewable sources of energy, South African energy industry
1. Introduction
Climate change is one of the major challenges of our time. It is scientifically proven that human action is having a negative effect on the environmental balance of our planet. The global energy sector accounts for around two-thirds in 2010 of greenhouse-gas emission1. In addition, most fossil fuels are becoming more expensive due to a mixture of higher demand, limited supply and carbon mission taxing (International Energy Agency, 2013a). Consequently, to decrease price volatility and increase energy security, it is important to start switching to new sources of electricity, which have the potential to contribute to sustainably cover the worlds increasing electricity demand. The Medium-Term Renewable Energy Market Report (MTRMR) from the International Energy Agency (IEA) predicts an increase by 40% of renewable energy in the next 5 years (International Energy Agency, 2013b).
The outcome of this paper will contribute to the development of South Africa's renewable energy industry by analysing the present structure of the solar service provider value chain in the Western Cape. No previous research in South Africa could be found, which focuses on this part of the market. The Western Cape was selected due to the high population of solar service providers. Further research could investigate the matter on a national scale.
The outcome could contribute to a sustainable long-term development of the downstream industry's value chain. The term 'downstream value chain' means that activities, which are closer to the customer are analysed, rather than the production site. The main focus of the paper is on solar service providers in the Western Cape, who stay in immediate contact with the customer. The service provider is the last link between the supplier and the final customer, and consequently has to handle the finished developed products of the supplier and find potential customers. The value chain approach is utilised to improve this process.
2. Research approaches to analyse the solar service provider industry
The following section provides a brief explanation of two models, namely the value chain model and Porter's Five Forces model. Both models are used to systematically analyse the solar service provider industry in the Western Cape and to identify opportunities for improvement.
2.1 The value chain approach
Every business consists of several steps in designing, producing, marketing, delivering and supporting its product or service. This approach is called 'the value chain model', as every step creates value for the potential customer (Gibbon, 2001). Value chains differ from company to company as business strategies and the internal and external environment differ (Humphrey & Schmitz, 2000). The value chain describes how the whole process from raw material to the end consumer is linked together. The process consists of primary and secondary activities (Hough, Thomson, Strickland & Gamble, 2011).
The fundamental model of Porter's value chain is illustrated in Figure 1 and contains primary and secondary activities. Primary activities are inbound logistics, operations, outbound logistics, marketing and sales, and service. Secondary activities are the firm's infrastructure, human resource management, technology and procurement (Humphrey & Schmitz, 2000).
Porter's value chain represents the basic model on which the current research is based. The primary research knowledge is collected to adapt the model to solar service providers in the Western Cape solar industry. In addition, key areas for development of the Western Cape solar service provider value chain are identified, and recommendations for improvement in the best interest of all stakeholders are presented.
The solar service provider is the last link of the industries value chain to the customer. It is a very fragmented segment of the value chain with very few companies that operate at national level (Donev, Van Sark, Blok & Dintchev, 2012).
2.2 Porter's Five Forces model
Porter's Five Forces of competition is by far the most powerful model to systematically diagnose the principal of competitive pressure. The model evaluates five different areas, namely rivals, new entrants, substitute products, buyers and supplier bargaining power (Porter, 2007). The model can be seen in Figure 2.
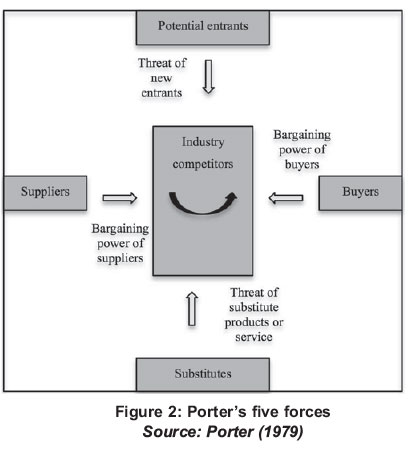
Porter's Five Forces model contributes to understanding of the renewable energy industry, and specifically the solar industry in South Africa. The knowledge of where most competitive pressure comes from assists in providing adequate recommendations in relation to future value chain adjustments (Porter, 2008). The understanding of which of the five competitive forces is stronger, assists in focusing on value chain activities interacting with this force. The improvement of these value chain activities adds more value to businesses as they improve their performance in areas most crucial to their success.
3. The South African electric power industry
To be able to understand the environment in which the Western Cape solar service providers are operating, it is necessary to have background knowledge about the present electric and solar industry.
3.1 Energy context
The global energy industry created total revenues of $6.050 billion in 2009 (Datamonitor, 2009). Global electricity demand is predicted to increase by 35% until 2030. More specifically in the BRICS developing nations, it is expected to grow by 65% (International Energy Agency, 2013a). The performance of the industry is predicted to speed up, with an anticipated annual growth rate of 13.2% for the five-year period 2009-2014, which will drive the industry to a value of $11,250.4 billion by the end of 2014 (Datamonitor, 2009).
About 70 % of the total energy supply in South Africa derives from coal. Coal-fired power-stations supply 93% of electricity production. Given its coal-based energy economy, South Africa is one of the main emitters of greenhouse gases when compared to other developing countries (Pegels, 2010). In 2002, on the African continent, 90.6% of CO2 was emitted by South Africa (United Nations, 2005). In 2005, South Africa was responsible for 1.1% of total global emission. Average per capita emission of 9 tonnes almost equalled to 10.7 tonnes in the EU (WRI, 2009). Since most forecasts indicate that coal will continue to be used in the near future, finding ways of using fossil fuels in a cleaner way is important during the conversion to different energy systems (Winkler, 2006). Possible technological options to produce cleaner electricity with coal are ultra-super-critical systems and an integrated gasification combined cycle (Liang, Wang, Zhou, Huang, Zhou & Cen, 2013).
Eskom is the state-owned electricity supplier, which is dominating the generation and capacity of energy. Furthermore, only about 70% of South African households are linked to the electricity supply grid, and overcoming energy poverty still remains a strategic development objective. In 2008 South Africa was unable to supply a vast number of households, and since then there have been a number of interventions to increase generation capacity (Edkins, Marquard, & Winkler, 2010a).
3.2 Solar market
Currently there are no subsidies for this technology, which makes it too expensive and not competitive enough to present sources of energy (Joburg, 2011). It takes more than seven years to amortise the initial investment in the panels by saving electricity. The fact that the majority of South African residents cannot plan ahead to stay for so many years in one place, makes this option highly unattractive (Addinall, 2011).
A study launched by the World Bank called the 'Renewable Energy Market Transformation' study, has identified the potential of Solar Water Heating (SWH) in the present and even more for the future (Conningarth Economists, 2004). The South African domestic water heating market is still dominated by electrical storage heaters. Less than 1% of homes in South Africa have solar water heaters, although conditions are favourable (DME, 2005). Another study conducted by the UNPD concludes that 30% - 40% of household consumption is caused by water heating, which includes a saving potential of up to 70% (Holm, 2005).
Every year around 480 000 electric water heaters are installed in South Africa (Edkins, Marquard, & Winkler, 2010b), in total there are just less than 8 million electrical heaters (Holm, Holm, Lane & Van Tonder, 1990; Geldenhuys, 1998).
3.3 Solar power
The on-going growing energy demand and the present power shortage in South Africa emphasize the need to utilize the rich renewable energy resources of the country. With an average of more than 320 sunny days a year, new approaches have to be conducted to increase the under-used application of solar power (Clean Project Analysis, 2004).
From an international perspective South Africa has several policy options available to promote renewable electricity, specifically solar power. Generally, there are two possible means of intervention for the government. One way is to regulate the quantity of renewable electricity; the second way is to fix prices through regulating tariffs (Winkler, 2005b).
The 'White Paper on the Energy Policy of the Republic of South Africa' from 1998 presented policies which could be seen as drivers of renewable energy deployment in South Africa. The document promoted the inclusion of the Independent Power Producers in South Africa's power generation (Pegels, 2010). Moreover, it emphasised the areas to be dealt with to create a suitable enabling environment for the promotion of renewable energy. The White Paper included financial and legal instruments, technology development, awareness creation, capacity construction and education (Edkins, Marquard, & Winkler, 2010a).
Under the Renewable Energy Independent Power Producer Procurement Programme REIPPPP, private power producers are invited to submit project proposals in a series of windows. The programme is strongly supported by the government (Department of Energy, 2012). In November 2012, the South African government signed ZAR47 billion worth of contracts with IPPs for 1.4 GW of renewable energy developed through the first window. Further contracts for 1.0 GW were signed in May 2013 in the second window. The government plans to bring 6.9 GW of renewable energy capacity online by 2020. The projects are all grid-connected and supply electricity to the national electricity grid of Eskom (Baker & McKenzie, 2013).
To actively encourage and promote the widespread implementation of solar water heating2, Eskom has rolled out a large-scale solar water heating programme. The government has set a target for renewable energy to contribute 10 000 Giga watt hours (GWh) of final energy consumption by 2013. Solar water heating could contribute up to 23% towards this target. Solar power is one of the most effective renewable energy sources available. Water heating can be responsible for up to 50% of a household's electricity consumption (Eskom, 2011b).
At the moment, there are subsidies for solar thermal technology but no subsidies for photovoltaic solar technology from Eskom (Eskom Call Centre, 2012).
4. Problem statement
The South African solar industry is in its infancy, characterised by accelerated growth expectancy and fuelled by factors such as new governmental subsidies, the fluctuations of fossil fuel prices and the increasing focus on economical long-term sustainability (Renewable Energy World, 2009). The expected growth necessitates a focus on the market positioning of solar service providers in the Western Cape, with the aim of taking full advantage of the opportunities associated with this industry.
This paper aims to produce an adapted3 model of Porter's value chain for the Western Cape solar service providers. In addition, key areas for development of the Western Cape solar service provider value chain are identified, and recommendations for improvement in the best interest of all stakeholders are presented.
5. Research methodology
The method used to clarify the research problem included a secondary research method, followed by a primary research process.
5.1 Secondary research
To conduct secondary research, data is used which is gathered and recorded by someone else prior to the current project (Zikmund & Babin, 2010). The mediums used were as follows: books, Internet, articles, masters and doctoral dissertations and case studies.
For this research, an extended literature review was undertaken to investigate the value chain model and Porter's Five Forces model, and both were applied to the South African context. The second part of this section entails definitions and concepts, which are important for the understanding of the study. The topic of general and solar energy in a global and domestic context is examined in the last section.
5.2 Primary research
Primary research is data collected or observed from first-hand experience (Business Dictionary, 2009). The different phases of the primary research of this research were as follows:
1. Preparation of a questionnaire according to objectives
2. Pilot study
3. Adjustment of the questionnaire according to pilot study and objectives
4. Main interviews (recording and notes)
5. Transcription of main interviews
6. Coding of data (content analysis)
7. Coding of data (frequency tables).
A questionnaire was set up according to the primary and secondary research objectives of the research. Every secondary research objective had its own question(s), which ensured that all information necessary to answer the objective was asked. The research included a pilot study at the beginning of the research. The purpose was to gain initial realtime information about solar service providers in the Western Cape (Hague & Jackson, 1995).
5.3 Target population
The target population of this research was solar service providers, who are active in the downstream solar value chain in the Western Cape. The service provider could be any type, from an online retailer to a physical location-based shop. Respondents were general managers or owners of solar service providers, the reason is their all-round knowledge of their company's business activities. The entire4 population of solar service providers in the Western Cape was targeted. Two Internet sites called 'Solar Suppliers' and 'the official Eskom site' list solar service providers in the Western Cape and represent the population for the main interviews. The main interviews included 18 managers/owners of different solar service providers in the Western Cape.
The population list of the present study was created through a variety of sources. Firstly, the official Eskom web page lists 55 service providers situated in the Western Cape. Secondly, an Internet site called 'Solar Suppliers' lists 33 solar service providers in the Western Cape, which are partly the same, but it also identifies different ones to those on the Eskom web page. The final population list included 77 different solar service providers, all of whom were contacted to take part in this study.
5.4 The questionnaire
The opening section provided the interviewee with an overview and information about the purpose of the study. The interviewer was introduced and the procedure explained (Willis, 2007). Moreover, the respondent was informed about the intended use of the data. The methods to keep information confidential were discussed and permission to tape record the interview was asked.
Section two of the interview was directed at the main themes identified in the literature review (Willis, 2007). The main themes were identified in the research objectives, namely the adaptation of Porter's value chain and the identification of key success areas. The guide allowed freedom to probe into answers and adapt to the situation in order to gain additional insight.
The closing section was about future perspectives and opportunities. The main issues discussed during the interview were summarised and the interviewees were motivated to add more of their relevant knowledge (Willis, 2007). Furthermore, future action was mentioned, by asking each interviewee for availability of additional telephonic questions. Lastly, the respondent was thanked for his or her time.
To ensure reliable and valid data, every respondent was presented with the same procedure (ASCD, 2010).
5.5 Data analysis
The qualitative data gathered (pilot and main interviews), with semi-structured interviews, was in the form of open-ended responses, which were transcribed. The questions were in exploratory form. The transcribed interviews were coded using a content analysis approach (Colorado State University, 2010).
After the data was coded and common themes were recognised, frequency tables were created to analyse the rate of occurrence of each identified theme (Hague & Jackson, 1995). A frequency rate of 60% and higher was categorised as a commonality or similarity. A frequency rate of less than 60% was classified as a trend or difference.
The interpretation of identified themes and categories confirmed trends, differences, commonalities and similarities of activities in the solar service provider value chain. The interpretation of primary and secondary data helped in the generation of an adjusted value chain model. The value chain was adjusted only with commonalities of more than or equal to a frequency of 60%. The data identified key areas for the development of the Western Cape solar service provider value chain, which involved all themes and categories with more than, and less than, a 60% frequency.
6. Summary of main findings
This section presents the most significant findings of this research. To create more understanding , the sections start with the most basic findings.
6.1 The stakeholders
To create recommendations that would improve the relationships with the most important stakeholders, respondents were asked to select the main stakeholders to their business. Those most frequently selected were suppliers (89%), employees (83%) and customers (78%). The business relationship with all three main stakeholders was based on legal contracts. The biggest concern expressed by 67% of the respondents was the relationship with customers. This stakeholder group still had to be educated about the benefits of solar energy, without being concerned about the initial investment.
6.2 The solar service provider value chain
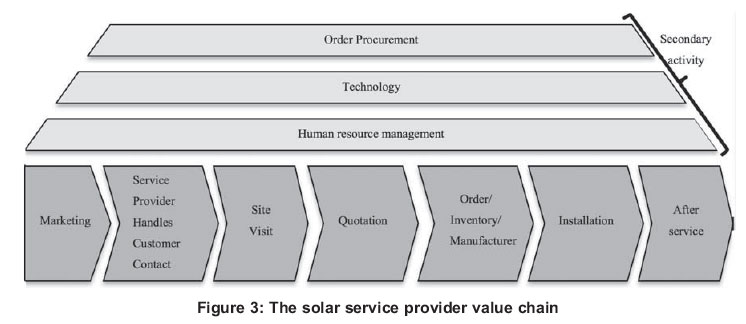
Part of the primary objective of this research was to adapt Porter's value chain model to the business activities of solar service providers in the Western Cape. The adapted solar service provider value chain model is presented in Figure 3. Most service providers (56%) pursued a best-cost provider strategy, as customers demanded good performing products without an enormous initial investment. The secondary activities were on top, and are as follows:
- The human resource management function was mentioned as the most important one, as it was responsible for good service, which was a strong differentiation point. To employ new staff members, education (83%) and personal reference (72%) were the foremost important criteria. To keep staff members motivated in 55% of the cases, personal recognition was used, followed by 38% for incentives.
- The technology represented the products, which were sourced from suppliers. Good technological products were a basic requirement to become a sustainable contender in the market.
- Order procurement was essential for the business, which meant they had to perform well in order to enter the market. It organised the product buying process at the optimal possible cost at the correct amount and quality.
The primary activities in Figure 3 were at the bottom, and formed the core business process of a solar service provider. The primary activities identified were as follows:
- Marketing was the first step as it was necessary to make the customer aware of the product. Residential areas were targeted from nearly all (89%) of the service providers, followed by businesses (45%). The most common marketing tools used at the time were websites, word of mouth and paper advertisement. Satisfied customers generated word of mouth.
- Solar service provider handles customer contact after he gained awareness through the marketing. The contact channels were e-mail in 89% of the cases, followed by phone and personal visits with 72% and 50%.
- Site visits were done by solar service provider staff members to evaluate the location at the customer's place, and to find the most suitable product solution.
- The quotation was prepared and sent to the customer after the target location was evaluated and the appropriate solution was found. The best sold products were geysers with 89% and solar water heaters with 83%. The most important product preferences for all products were price and quality.
- The order, manufacturing and inventory step made sure all product parts for the demanded installation were ready. The majority of service providers sourced their products from South African suppliers (55%), followed by European (30%) and Chinese (15%). The European products had the best overall measured rating, with the only disadvantage of high prices. South African products were in second place, with lower ratings than the European products and prices, which were also rated as too high. Chinese products got the lowest overall rating, but the prices offered were lower. The service providers either received their products through agents or at collecting centres. It depended on the product and whether stock was kept, for the most popular products 67% of the service providers kept stock. On an average the stock lasted for 7 weeks. Product training and weekly check-up calls were services that were provided by 84% of the suppliers. A two-way communication approach between supplier and service provider was performed by 75% of the existing relationships. The frequency of communication depended on the service provider, which made contact at least once a week. The most common communication channels were e-mail (89%), phone (78%) and face to face communication (50%).
- The installation takes place when the products demanded by the customers are put into place at the desired location. Within the first week 89% of the orders were installed. In 78% of the cases, the customer had to settle the outstanding amount in the first week after the installation was finished.
- The after-service took place after the installation and payments were made. The purpose was to assure that the product performed as promised. In 55% of the cases, a check-up call was conducted from the service provider, and 33% did not have any after-service.
The majority of managers (67%) were aware of the value chain concept and how to apply it to their business. It is interesting to mention that only managers who approached a best-cost provider and differentiation strategy were conscious of the concept. Only 37% of employees were aware of the concept. Repeatedly, only employees of service providers with best-cost provider and differentiation strategies used the concept. The awareness of the supporting activities was high, with 89%.
6.3 The value chain key success factors
These factors are part or are one of the activities of the adapted value chain in Figure 3. For solar service providers to be sustainable and competitively superior, it is important to perform exceptionally in these activities.
The foremost important value chain activity was service, which was mentioned by 94% of the respondents. Service forms part of virtually every value chain activity. However, the most important service activities were the site visit and the installation. The employee is in face to face contact with the customer and has to ensure that the products are set up properly. Moreover, good service has a strong influence on positive word of mouth.
The second most important activity was marketing, which was chosen by 39% of the respondents. Based on the fact that the industry is still in its infant stage, customers have to be made aware and to be educated about the product offers of solar service providers. The products last more than 20 years, which makes it important to gain new customers. Positive word of mouth is consequently a good way to gain new buyers, and is crucial for sustainability.
6.4 The five forces and solar service providers
The force of new entrants was mentioned the most and was selected by 50% of the respondents. Reason for this was the strong growing market, which created space for new market entry. Most new entrants offered cheap products from China, which harmed the market reputation as the performance was low in comparison to European and South African quality. Moreover, no service provider could establish himself as a clear market leader yet.
The forces of substitutes and buyers were selected each with 28%. The major substitute for solar energy is the still relatively cheap common electricity delivered by Eskom. This substitute is expected to become weaker as the electricity price is going to increase in future. The power of buyers is considerably high as there are more service providers entering the market, which gives a greater variety to choose from.
Most of the respondents mentioned installations as their core competency, followed by technology and reputation. In addition, respondents were asked to identify their strongest competitor(s). The strongest contender in the Western Cape market was SolarTech, followed by SolarMax.
6.5 Relevant cross-sectional findings
Considerable findings could be made, based on the strategy the solar service provider is pursuing. The best-cost provider strategy was the most successful one with an annual sales increase of 23%, followed by a differentiation strategy with 7%. All other strategies had decreasing sales numbers.
Best-cost providers sourced their products from local suppliers, as they had a good quality/price ratio. Moreover, the delivery time was one week in comparison to overseas products of two weeks. Service providers with differentiation strategies sourced from European suppliers as the quality was superior, but with the disadvantage of a high price.
The target market with the highest sales increases with 37% was public institutions and hotels. The second strongest was residential areas with a 2.8% increase, which was also the most popular one.
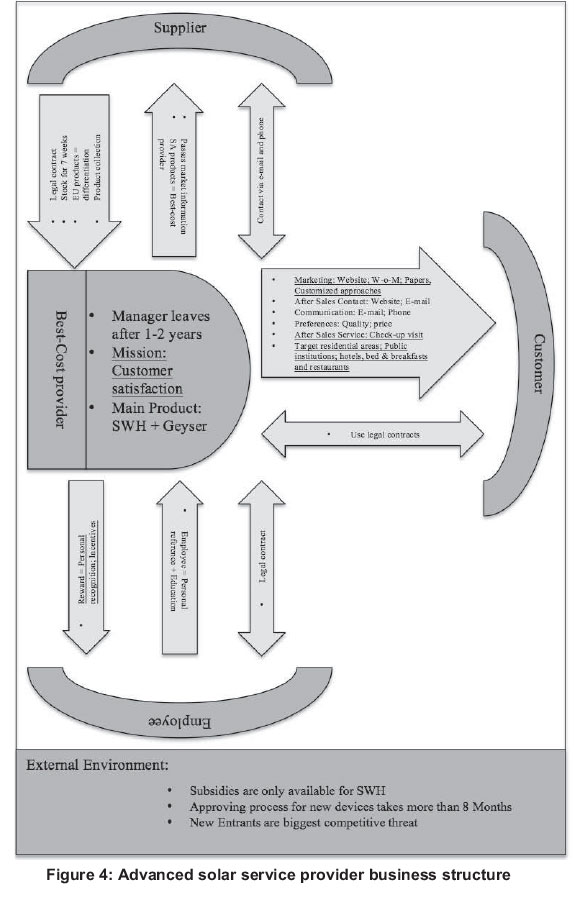
7. The advanced solar service provider business structure
The advanced solar service provider business structure, including the recommendations, is illustrated in Figure 4. The recommendations are underlined and are discussed in more depth in this section.
The best-cost provider strategy was selected as the most appropriate one for solar service providers. The first reason is that many potential customers fail to purchase the solar product as the initial investment is too high. The strategy offers a lower initial investment, which makes it affordable for more customers. Secondly, the quality has to be high, as the solar technology is still in the beginning of its life cycle. For instance, a low cost quality solar water heating system does not efficiently heat the water, which causes dissatisfaction for the customer.
The solar service provider can specialize in certain types of customers. One target market yields more potential are businesses. The type of product provides another opportunity to specialize in. It would save time and costs to specialize in solar water heating systems, as the popularity is increasing.
The flagship products are geysers and solar water heating panels. The reason is that the technology is relatively advanced, which means it is durable, effective and reliable. Moreover, Eskom is providing subsidies for each SABS-approved system sold.
7.1 Marketing
Marketing is crucial for solar service providers, as the products offered in the market are very similar. Customer retention in the market is very low, as once a customer has bought a solar system, which lasts for at least 15 years, he is highly unlikely to come back for another one. Moreover, customers have to be made aware and educated about the benefits. The following section explains the customised marketing approach:
- Provide incentives to customers who bring a new customer. The main marketing aim should be to attract new customers. The incentive could be free service of the installed products for X amount of years, which also keeps the customer reminded of the service provider. Another approach could be to refund a part of the customer's bill. This approach would assist in increasing the most powerful marketing tool, word of mouth. Moreover, as there is no major market leader and service providers are of small size, the capital available for marketing is not enough for big campaigns. In addition, this tool would be directed to the local target market, and no extra effort has to be made.
- Create a marketing pool to generate more power. The campaign will have a wider reach to educate and increase awareness of the products and their benefits. Nevertheless, this is a long-term goal, as it requires trust and planning between the partners. The partnership could target a region, like the Western Cape.
- Promote the products at functions. It is important that the target consumers are present and are reached.
All marketing recommendations take the present business structure of the majority of solar service providers into consideration. Firstly, the business is small, which means limited funds for marketing, and target customers are in a small area. Secondly, most competitive pressure is created by new entrants who make it important to be established in the local market. Consequently, to be successful, the small service provider should create a reliable and professional reputation in his local market.
7.2 The service
In Figure 4, the service parts are underlined, including the mission (customer satisfaction) and aftersales service. The following recommendations indicate how to improve these activities:
- The mission statement aims to create customer satisfaction. Solar service providers formulated well defined mission statements even though it was very vague and broad, and still lacking in implementation and execution. The performance evaluation of all suppliers and their product is good to very good. Consequently, the service the business is providing is the crucial point to satisfy the customer and to be different from competitors. The installing team is therefore the key to fully satisfying the customer. The respondents knew that installing was the key, but they could not tell what they could do to improve their performance. To gain positive customer feedback, the installer also needs to be trained on interaction with the customer. To ensure excellent service, the service provider should train the installer team in all service dimensions:
- Reliability is the ability of an installer to perform the promised service dependably and accurately. This means that employees must be trained well on the products and how to install them.
- Responsiveness is the willingness to help and provide prompt service. For the installers, this means that they have to be in time for their appointments with the customer. Moreover, if there are any problems with the product, the installer has to be able to come the same day to fix it.
- Assurance is the employees' knowledge and courtesy and their ability to inspire trust and confidence.
- Empathy is to care and to give individualised attention to customers. The installers should be trained in communicating with customers.
- Tangibility is the appearance of physical facilities, equipment, personnel, and written materials. The equipment, including the car, should be clean and organised.
- After-sales-service is often underestimated in contributing to overall customer satisfaction. At the start, a check-up call should be conducted to ask if everything is working. To improve the service enormously, service providers should conduct a last visit to check the functionality of all products.
7.3 Employee motivation
The employees are the capital of a solar service provider business. This section provides recommendations of how to improve the motivation of employees. The following are two possible tools for further motivation:
- An incentive is extra salary paid to the employee for each successful installation. For instance, the installer team can receive for each successful job an X amount of money. This amount is distributed after the final check-up visit/ call when the customer has expressed his satisfaction.
- Bonuses are used on a monthly basis and are added to the basic salary. Bonuses are generated and distributed to employees when monthly predicted profits are exceeded.
As employees, especially installers, should only be focused on their present installation, it is advisable to use incentives. The advantage is that the installer knows that for each job he does well, he gets extra money. Bonuses can also be used but are more suitable for employees who are not directly linked to the main service, the installation.
8. Conclusion
The main outcome of this study is the adapted model of Porters' value chain to solar service providers in the Western Cape. The literature review of this research has shown that it is crucial for the sustainable future of South Africa to increasingly make use of renewable sources of energy. As mentioned before, the high sun radiation level presents optimal conditions for the usage of solar technology in South Africa. In addition, the present development of the rising electricity costs makes it progressively more economical to invest in renewable sources of energy.
The supplier side of the industry is developed, as can be seen in countries such as Germany, where the technology is well accepted. The downstream part of the South African solar industry is in its infant stage, which creates space and the need to improve. To increase the usage of solar energy in South Africa, this research aimed to improve the performance of solar service providers.
The recommendations of this paper show that solar service providers need to improve their service and marketing performance. Marketing is important as customers still have to be educated about the benefits of solar products. High qualitative service is crucial, as solar panels cannot perform at their maximum and capture all the possible sun radiation if installed poorly.
Notes
1. Atmospheric gases that contribute to the greenhouse (global warming) effect by absorbing infrared radiation produced by solar warming of the Earth's surface. Most common gases are carbon dioxide, methane and nitrous oxide (Science dictionary, 2010).
2. There are two broad categories of solar power known. The first category is called 'solar water heating', where the sun radiation is used to heat water up. The second category uses the sun radiation to produce electricity, which is called 'photovoltaic solar power'.
3. The customisation of Porter's generic value chain model to the business activities of Western Cape solar service provider.
4. Most care was taken that the list of solar service providers was up-to-date at the time the research was undertaken.
References
Addinall, P.J. (2011). Interview with the Technical Sales Director on 8th June 2011. Johannesburg: Energex. [ Links ]
ASCD (2010). Data Collection: Building a Valid and Reliable Data Collection Plan. [ Links ] [Online]. Accessed at: http://www.ascd.org/publications/books/100047/chapters/Data-Collection@-Building-a-Valid-and-Reliable-Data-Collection-Plan.aspx [12 June 2011].
Baker & McKenzie (2013). The future of clean energy in Africa. [ Links ] [Online]. Accessed at: http://www.bakermckenzie.com/files/upload/The%20future%20for%20clean%20energy%20in%20Africa%20(Final).pdf. [09 October 2013].
Business Dictionary (2009). Primary research data. [ Links ] [Online]. Accessed at: http://www.businessdictionary.com/definition/primary-data.html [10 February 2011].
Clean Energy Project Analysis (2004). RETScreen International. ISBN 0-622-35674-8. p. SWH7. [ Links ]
Colorado State University (2010). Writing Guide: Content Analysis. [ Links ] [Online]. Accessed at: http://writing.colostate.edu/guides/research/content/ [01 June 2011].
Datamonitor (2009). Global Energy. [ Links ] [Online]. Accessed at: http://www.datamonitor.com/default.aspx [12 February 2011].
Department of Energy (2012). Renewable Energy Independent Power Producer Procurement Programme. [ Links ] [Online]. Accessed at: http://www.ippre-newables.co.za. [09 October 2013].
Donev, D. Van Sark, W.G.H.M., Blok, K. & Dintchev, O. (2012). Solar Water heating potential in South Africa in dynamic energy market conditions. Renewable and Sustainable Energy Reviews. 16(5):3002-3013. [ Links ]
Eberhard, A.A. & Williams, A. (1988). Renewable Energy Resources and Technology Development in South Africa. Cape Town: Elan Press. [ Links ]
Edkins, M., Marquard, A. & Winkler, H. (2010a). Assessing the effectiveness of national solar and wind energy policies in South Africa. Journal of Energy in South Africa. Cape Town: Energy Research Centre. [ Links ]
Edkins, M., Marquard, A. & Winkler, H. (2010, 2010b). South Africa's renewable energy policy roadmaps. Journal of Energy in South Africa. Cape Town: Energy Research Centre. Eskom (2011b). Solar Water Heating Program. [ Links ] [Online]. Accessed at: http://www.eskom.co.za/c/56/eskom-solar-water-heating-programme/ [2 May 2012].
Eskom Call Centre (2012). Subsidies for Renewable Sources of Energy. (Personal Communication, 2 May 2012). [ Links ]
Geldenhuys A. (1998). Eskom Domestic Load Research. Cape Town: University of Cape Town. [ Links ]
Gibbon, P. (2001). Upgrading primary products: a global value chain approach. World Development 29(2):345-363. [ Links ]
Holm D., Holm H., Lane I.E. & Van Tonder C. (1999). Local Integrated Resource Planning Project Hartbeerspoort. Pretoria: University of Pretoria. [ Links ]
Hough, J., Thomson, A.A., Strickland, A.J., & Gamble, J.E. (2011). Crafting and executing strategy: text, readings and cases. South African ed. London: McGraw-Hill. [ Links ]
Humphrey, J. & Schmitz, H. (2000). Governance and upgrading: linking industrial cluster and global value chain research. Brighton: Institute of Development Studies, University of Sussex. [ Links ]
International Energy Agency (2013a). Redrawing the Energy Climate Map. [ Links ] [Online]. Accessed at: http://www.worldenergyoutlook.org/media/weowebsite/2013/energyclimatemap/RedrawingEnergyClimateMap.pdf [7 August 2013].
International Energy Agency (2013b). Renewables to surpass gas by 2016 in the global mix. [ Links ] [Online]. Accessed at: http://www.iea.org/newsroomande-vents/pressreleases/2013/june/name,39156,en.html [7 August 2013].
Joburg (2011). Interview with the solar engineer on 8th June 2011. Johannesburg: Energex. [ Links ]
Liang, X., Wang, Z., Zhou, Z., Huang, Z., Zhou, J. & Cen, K. (2013). Up-to-date life cycle assessment and comparison study of clean coal power generation technologies in China. Journal of Cleaner Production. 39(2013):24-31. [ Links ]
Pegels, A. (2010). Renewable energy in South Africa: Potentials, barriers and options for support. Energy Policy. 38(6):4945-4954. [ Links ]
Porter, M. (1979). How competitive forces shape strategy. Harvard Business Review. 57(2): 137-145. [ Links ]
Porter, M. (1985). Competitive Advantage: Creating and Sustaining Superior Performance. New York: Simon & Schuster. [ Links ]
Porter, M. (2007). How competitive forces shape strategy. Harvard Business Review. 57(2):137-145. [ Links ]
Porter, M. (2008). The Five competitive forces that shape strategy. Harvard Business Review. 86 (1):78-93. [ Links ]
Renewable Energy World (2009). Solar Thermal Energy Industry Still Growing Worldwide. [ Links ] [Online]. Accessed at: http://www.renewableenergyworld.com/rea/news/article/2009/06/video-solar-thermal-energy-industry-still-growing-worldwide [14 February 2011].
Science dictionary (2010). Greenhouse gas science definition. [ Links ] [Online]. Accessed at: http://science.yourdic-tionary.com/greenhouse-gas [7 August 2013].
United Nations (2005). African Regional Implementation Review for the 14th Session of the Commission on Sustainable Development. New York: UNECA. [ Links ]
Winkler, H. (2005b). Renewable energy policy in South Africa: policy options for renewable electricity. Journal of Energy Policy. 33(1):27-38. [ Links ]
Winkler, H. (2005a). Climate change and developing countries. South African Journal of Science. 101(7): 355-364. [ Links ]
Winkler, H. (2006). Energy policies for sustainable development in South Africa. Energy for sustainable development. 10(1):26-34. [ Links ]
WRI (World Resource Institute) (2009). Climate Analysis Indicator Tool (CAIT) Version 6.0. [ Links ] [Online]. Accessed at: http://cait.wri.org [01 August 2013].
Zikmund, W.G. & Babin, B.J. (2010). Exploring Marketing Research. 10th ed. Mason: Thomson. [ Links ]
Received 14 November 2012
Revised 20 May 2014

