


Services on Demand
Article
 English (pdf)
 Article in xml format
 Article references
Indicators

Related links
-
 Cited by Google
 -
 Similars in Google
Share

 Permalink
Journal of Energy in Southern Africa
On-line version ISSN 2413-3051
Print version ISSN 1021-447X
J. energy South. Afr. vol.24 n.4 Cape Town Apr. 2013
RESEARCH ARTICLE
A cost-benefit analysis of concentrator photovoltaic technology use in South Africa: A case study
Mario du PreezI; Justin BeukesI; Ernest van DykII
IDepartment of Economics, Nelson Mandela Metropolitan University
IIDepartment of Physics, Nelson Mandela Metropolitan University
ABSTRACT
The South African Government currently faces the dual problems of climate change mitigation and the rollout of electricity provision to rural, previously disadvantaged communities. This paper investigates the economic efficiency of the implementation of concentrator photovoltaic (CPV) technology in the Tyefu area in the Eastern Cape, South Africa, as a means of addressing these problems. Two cost-benefit analyses (CBA) are carried out in the study, namely a private CBA and a social CBA. The private CBA investigates the desirability of the CPV project from a private energy investor's perspective, whilst the social CBA investigates the desirability of the CPV project from society's perspective. The social CBA found that the project was socially viable and was, thus, an efficient allocation of government resources. The private CBA, on the other hand, found that investing in a CPV project was not financially viable for a private investor. With respect to the incentive scheme currently offered to private energy investors, it is recommended that the maximum bidding price of R2.85/kWh be increased. A sensitivity analysis of the bidding price showed that an increase of 300% is required to attract private investors into electricity generation projects.
Keywords: Cost-benefit analysis, concentrator photovoltaic technology, social discount rate.
1. Introduction
South Africa relies heavily on fossil fuels, particularly coal, to generate electricity (Department of Minerals and Energy, 2003). The use of fossil fuels, however, contributes to climate change, as it produces greenhouse gases (GHGs). Internationally, South Africa is the 31th highest emitter of CO2 emissions with 9.2 metric tons per capita, whereas it is ranked 20th highest emitter of CO2 emissions with 1.59 metric tons per GDP (World Bank, 2010). Coupled with the environmental consequences of fossil fuel use, South Africa has a further responsibility of addressing the inherited backlog of electricity provision to the mostly rural, previously disadvantaged communities. In an attempt to address these two problems, the government issued the White Paper on Renewable Energy. In this paper, renewable energy alternatives are proposed to replace a portion of traditional electricity generating methods.
Concentrator photovoltaic (CPV) energy generation is one such renewable option available to government. CPV is a form of active1 solar-based renewable technologies that absorb energy from the sun into solar PV panels consisting of cells. The sunlight entering the cell is concentrated2 through the use of mirrors or lenses that focus or concentrate sunlight onto PV material. The concentration of sunlight increases the intensity of the light, which allows the generation of more electricity. Owing to the light being concentrated, the cells in CPV use less semiconductor material, which makes them more efficient in comparison to conventional photovoltaic (PV) cells. The optical elements (such as lenses) multiply the sunlight intensity by factors that range from 2 (low concentration) to more than 1000 (high concentration). Figure 1 depicts the principle arrangement of a CPV concentrator.
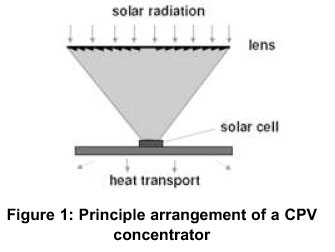
Sunlight is concentrated by optical devices like lenses or mirrors thereby reducing the area of expensive solar cells and increasing their efficiency (PV Technology Research Advisory Council, 2007). The motive for applying this technology is to generate maximum electrical power with the minimum solar cell area, which in turn significantly lower the costs of photovoltaic generation (Daido, 2011a).
Both conventional PV and CPV systems can be used for grid-connected electricity generation and off-grid (stand-alone) generation. The latter is the most common application and where both photovoltaic technologies gain their advantage (Winkler, 2005). The useful life of a PV cell is a function of manufacturing methods and quality of the material used. Applications based on silicon material are often given a manufacturer's warranty of 25 years or more, although the expected useful life is much longer. CPV requires that the sun's orbit be tracked by moving the system accordingly, which also allows for a longer exposure time of the cells during the day (PV Technology Research Advisory Council, 2006).
CPV is a technology that operates well in regions with high solar radiation, utilising direct normal irradiance. As such, South Africa is particularly well suited for this technology, with average solar radiation levels ranging from 4.5 to 6.5kWh/m2. CPV is also well suited for off-grid application, which addresses electricity demand in remote rural areas.
There is, however, a paucity of published studies that establish the economic rationale for the use of solar energy in South Africa. This study aims to fill this gap. To the authors' knowledge, this is the first formal attempt in South Africa to establish the economic efficiency of the use of CPV. The approach employed to achieve this aim is the cost benefit analysis (CBA) method. Two types of CBA are performed, namely a private CBA and a social CBA. The private CBA evaluates the CPV project from a private investor's perspective and the social CBA evaluates the CPV project from society's point of view. In terms of the social CBA, the current means of providing electricity can be viewed as the 'without scenario', while the CPV project is the 'with- scenario'. The net benefit arising from the CPV project will simply be the difference between the 'with' and 'without' scenarios. In order to estimate the net benefit, an attempt is made to identify and estimate (where possible) the social benefits and social costs that will occur upon project execution. With respect to the private CBA, the private benefits of the CPV project are simply compared to the private costs.
The study area chosen for the implementation of the CPV project is the Tyefu rural3 settlement located in the Eastern Cape, South Africa. The settlement is called Tyefu and consists of five villages, namely Ndlambe, Ndwayana, Glenmore, Pikoli and Kalikeni (Monde-Gweleta, van Averbeke, Ainslie, Ntshona, Fraser and Belete 1997). Tyefu falls under the Ngqushwa Local Municipality, which in turn falls under the jurisdiction of the Amathole District Municipality, Eastern Cape Province (Ngqushwa Local Municipality, 2011). The local communities in Tyefu are poor - the majority of households (66.8%) in the region earn less than R1500 per month (Ngqushwa Local Municipality, 2011). Most households depend on pensions and social grants as their main source of income. Tyefu was deemed ideal to serve as a case study due to four characteristics. First, Tyefu is a remote rural settlement at the end of the national grid. Second, the community is very poor and previously disadvan-taged. Third, many households are without Eskom generated electricity. Last, the study area is located in an area with irradiance levels suitable for CPV. CPV technology requires direct normal irradiance (DNI) from the sun to generate electricity. The Tyefu area experiences annual average DNI levels of 5.27kWh/m2 which are ideal for CPV systems (National Renewable Energy Laboratory, 2011).
2. The CPV project
The Ngqushwa Municipality identified 84 households in the Tyefu area as not having electricity. These households formed the sample on which the demand for electricity, and thus the CPV project, is based. Traditionally, unelectrified rural, households, such as those found in Tyefu, have obtained their energy from several sources, namely paraffin, candles, liquefied petroleum gas (LPG), dry-cell batteries, car batteries, wood, and diesel and petrol generators (Aitken, 2007). The amount of electricity required to replace some of the traditional energy sources is calculated below and was established by using Aitken's (2007) study results and personal correspondence (Purcell, 2011). Figure 2 provides the basic floor plan of a sample household for which a CPV system can provide electricity.
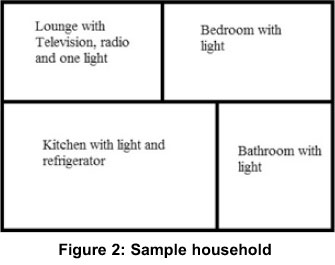
Figure 2 depicts a household which uses four fluorescent lamps, a television set, a radio and refrigerator. In order to provide an equivalent amount of energy4 to light four rooms, run a television set, radio and refrigerator for one year, the typical Tyefu household requires:
- 6.39 litres of paraffin (lighting) at a cost of R639.24 per annum.
- 22 charges for a car battery (TV) at a cost of R333.44 per annum.
- 57 sets (4 batteries per set) of dry cell batteries (radio) at a cost of R902.26 per annum.
- 20.11 kilograms of LPG (fridge) at a cost of R854.77 per annum (Purcell, 2011).
In order to meet the electricity needs of the sample households identified, a CPV system will be installed and operated ('the CPV project') with an electricity generating capacity of 30kWp and an annual output of 30.3MWh per annum. The CPV modules that will be used are mounted on a dual-axis system in order to track the sun's movement. A battery bank will be used to store the energy produced for use at non-generating hours.
Either Eskom or independent power producers (IPPs) could implement the CPV project in the Tyefu area. This would align well with Eskom's attempts to mitigate grid instability issues, by investing in off-grid, distributed generation, co-generation and small-scale renewable projects (Eskom, 2011). If an IPP were to undertake the project, they would engage in the bidding process to supply the electricity generated by the system (Norton Rose, 2011). If the project were to be undertaken by Eskom, it would also be managed by them. On the other hand, if IPPs were to undertake the project, they would outsource management to a services engineering and managing company (Pardell, 2011). The installation of the CPV system could be carried out by a services engineering and management company regardless of whether Eskom or an IPP were to undertake the project. Installation of the 30kWp system would take approximately 2 months. Maintenance of the system could also be performed by a services engineering and management company. Basic maintenance can be performed by trained locals. However, more advanced technical maintenance would have to be undertaken by more highly trained individuals within the management company.
3. Cost benefit analysis
Cost benefit analysis (CBA) is a standard technique used to assess the desirability of an investment project (Watkins, 2010). More specifically, the costs and benefits of a project are determined and compared. The measured costs and benefits are weighed up against each other to establish criteria for decisionmaking. Normally, one or more of the following three decision-making criteria are used, namely the net present value (NPV), the internal rate of return (IRR) and the discounted benefit cost ratio (BCR) (Hanley and Spash, 1993). The NPV determines whether the sum of discounted benefits (B) exceeds the sum of discounted costs (C). The NPV can be formally expressed as follows:

where:
NPV = net present value Bt = benefit in year t
Ct = cost in year t
i = the discount rate
n = length of the project
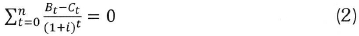
A project is accepted if it generates a positive NPV. The IRR is the rate of interest that will produce a NPV of zero (if this interest rate is used as the discount rate). More formally:
The IRR decision rule is that the project should proceed if the IRR exceeds the discount rate(i). The BCR is a different way of expressing the NPV (Hanley and Spash, 1993). More formally, the BCR can be expressed as follows:
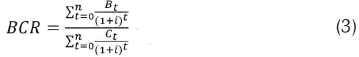
If the BCR exceeds unity, then the project may proceed (Hanley and Spash, 1993).
There are four standard elements to CBA: time considerations, costs, benefits, and the discount rate. All of these are discussed below for the private CBA and the social CBA, respectively.
3.1 Private CBA
The private CBA employs costs and benefits valued at market prices (i.e. purely financial flows), and omit any potential effects the project may have on society.
3.1.1 Time considerations
All the estimated private cost and private benefit flows used in this analysis are captured in per annum periods and expressed at 2010 price levels.
The project period or time horizon of the project was set at 25 years.
3.1.2 The private costs of the CPV project Investment costs
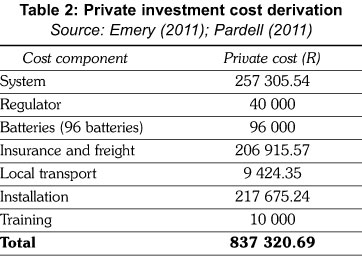
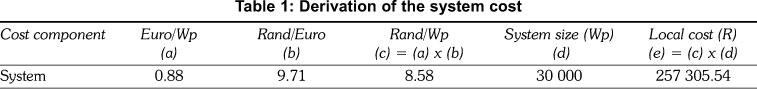
The investment cost comprises initial capital costs on the system (500 times concentration CPV modules, trackers and inverters), the regulator, initial battery bank, transportation (foreign and local), installation and training. Of all the capital equipment, only the system is imported- the regulator and battery bank are acquired locally. The derivation of the system cost is shown in Table 1.
Local transport consists of a fee of R8 950 per container (one container is used) and a fuel surcharge of 5.3 percent. Insurance and freight cost for the private analysis includes customs duties (R80 306.85) and customs VAT (R93 691.36) among other charges imposed by both local and foreign ports (Emery, 2011). In addition to these costs, costs are also incurred for the installation of the system and the training of maintenance staff. Table 2 below gives the breakdown of the investment cost component.
Operating and maintenance costs
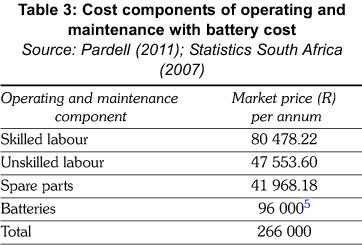
Annual operating and maintenance costs consist of expenditures on labour (two unskilled labourers for routine tasks and one skilled labourer to manage the plant and to perform more advanced tasks), materials (spare parts and lubricants) and water (water cost is assumed to be zero since the amount used is considered negligible). In addition to the annual operating and maintenance costs, every four years the cost to replace the battery bank is added to the annual figure. The operating and maintenance costs (with battery cost) are displayed in Table 3.
Decommissioning costs
Lastly, decommissioning costs (occurring in the final year) comprise of costs to dismantle the CPV plant. This cost equals R14 569.96 (Pardell, 2011).
3.1.3 The private benefits of the CPV project
The private benefits are the revenue earned by the private investor who initiates the project. This revenue is estimated as the product of the volume of electricity output and its unit value. The latter is the upper limit of the submitted price by the private investor during the bidding process (Norton Rose, 2011). The electricity output is expected to be 30 300kWh per year. Using the current upper limit for CPV in the bidding process of R2.85/kWh (Norton Rose, 2011), the expected revenue from the sale of electricity is R86 355 per annum.
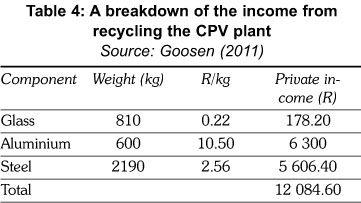
Income from recycling the plant's components during decommissioning, and the recycling of the batteries every four years (Table 4), is also included in the private analysis. This amounted to R12 084.60.
3.1.4 The private discount rate
The private discount rate was estimated as the difference between the prime lending rate and the inflation rate. Table 5 shows the data used for this calculation.
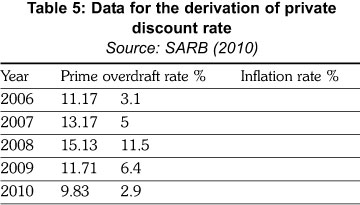
The private discount rate was calculated to be 6.42 percent per annum.
3.2 Social CBA
The costs and benefits used in the private CBA are amended (via shadow pricing) for the purposes of the social CBA to reflect their underlying opportunity costs. Externalities (secondary effects) are identified and classified under the appropriate cost or benefit category.
3.2.1 Time considerations
All estimated social cost and social benefit flows derived in this analysis are captured in per annum periods and expressed at 2010 price levels. A distributional weighting of one was used for all cross-sectional costs and benefits over the full project period. This weighting assumes that a Rand benefit is worth the same to all members of the population affected by the project. The project period for the project was set at 25 years.
3.2.2 The social costs of the CPV project Investment costs
As mentioned before, of all the capital equipment, only the system is imported. The social cost for the imported system is the sum of its fob price plus the c.i.f. (European Union, 2008). The social cost of the system was calculated to be R290 222.90 (i.e. R257 305.54 + R32 917.36). The social cost of the system is considerably lower than its private cost since taxes (i.e. customs duties and customs VAT amounting to R173 998.21) are excluded from the former.
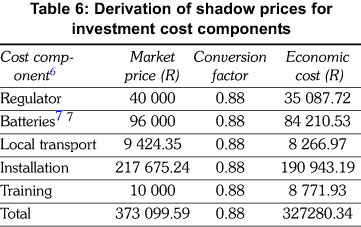
The market prices of locally acquired capital components (regulator and batteries), local transport, installation, and training were transformed into shadow prices by applying a standard conversion factor of 0.88 as recommended by Mullins et al. (2007). These conversions are shown in Table 6.
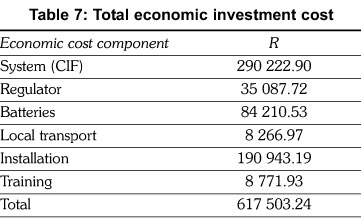
The components of the total economic investment cost are shown in Table 7.
Operating and maintenance costs
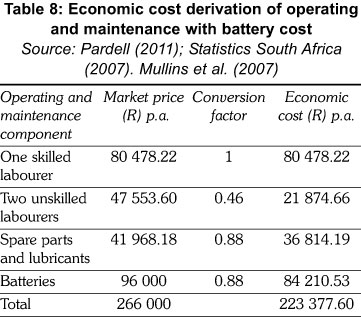
Of all the operating and maintenance costs identified in section 3.1.2, the following ones require transformation into economic costs: salaries and wages, battery replacement, spare parts and lubricants (as mentioned before, water costs are assumed to be zero). This is carried out by applying the relevant conversion factors as recommended by Mullins et al. (2007).
Decommissioning costs
These costs are the same type of costs as those mentioned for the financial costs. However, a conversion factor of 0.88 is applied to arrive at the economic cost. The economic decommissioning cost amounts to R12 780.67 (R14 569.96 0.88).
Secondary (externality) costs
A secondary cost is that the landscape may be negatively affected, aesthetically and in terms of lost area available for other uses such as agriculture. CPV, however, has a minimal optical impact on the ground. The ground beneath the CPV panel receives enough sunlight so that it may be used for agricultural purposes. The visual impact on the site location is minimal (Daido, 2011b).
3.2.3 The social benefits of the CPV project Primary benefits
The social benefits of CPV are based on the 'with or without' principle. Without CPV, the Tyefu community would incur costs in obtaining energy for themselves. With CPV, the community avoids these costs. These avoided costs are the economic benefits of CPV in the study.8 The savings of recurring energy costs relative to the existing situation for 84 households amounted to R201 137.04 per annum (Purcell, 2011). The disaggregated cost savings are shown in Table 9.
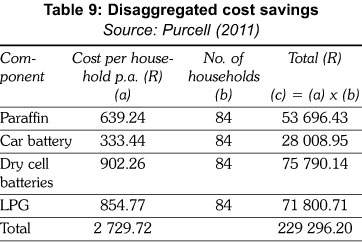
The total cost savings amount was converted into an economic benefit by applying the standard conversion factor (R229 296.20 0.88 = R201 137).
Income from recycling the plant's components during decommissioning, and the recycling of the batteries every four years, is also considered in the social analysis. The economic benefit from recycling the glass, aluminium and steel of the CPV plant is calculated to be R10 600.53 (R156.32 + R5 526.32 + R4917.89). The income from the recycling of batteries every four years is R48 661.05. Table 10 shows the income from recycling.
Secondary benefits
CPV systems do not emit any GHGs during power generation. This benefit is insignificant, given the size of the study area, and is thus not included in the analysis (SolFocus, 2011b).
3.2.4 The social discount rate
The social discount rate used is a composite rate made up of the social opportunity cost of capital (SOCC) and the social time preference rate of consumption (STPR).
The composite social discount rate can be estimated as follows:
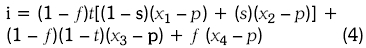
where:
f = proportion of foreign funding of total;
t = proportion of government expenditure funded through taxes paid;
1 - t = proportion of government expenditure funded through borrowing;
s = proportion of people's disposable ncome that is saved;
1 - s = proportion of disposable income consumed;
x1 = average of the predominant overdraft rate on current accounts and the term lending base rate;
x2 = average of dividend yield and the capital growth of all listed shares on the Johannesburg Stock Exchange;
x3 = average of the government loan stock yield and the Eskom bond rate;
x4 = interest rate cost of foreign funding;
p = consumer price index (inflation) (Du Preez, 2004).
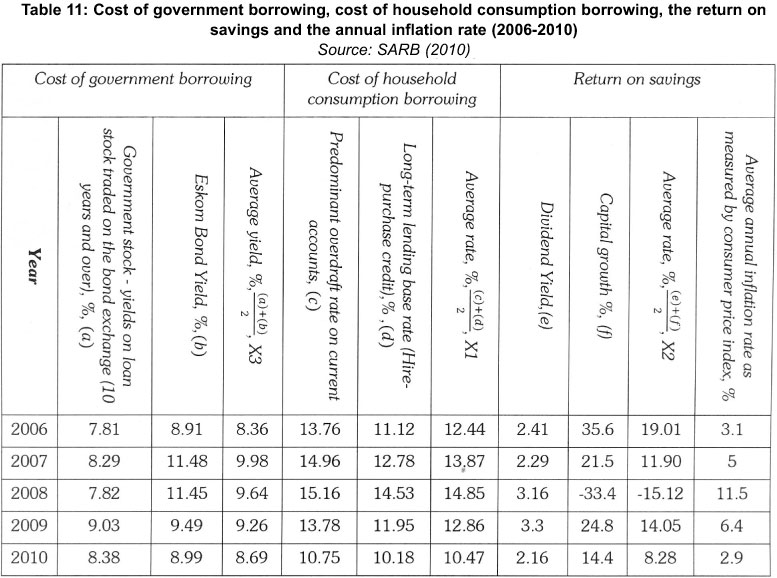
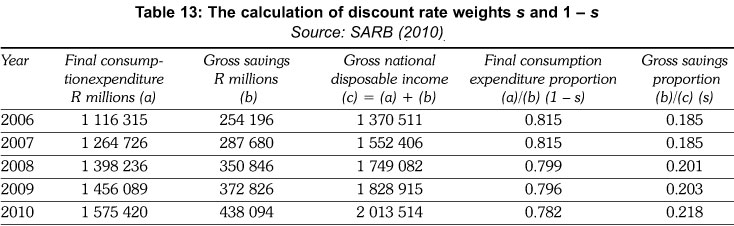
Data was gathered for these mentioned variables for the period 2006 to 2010. Table 11 shows the cost of government borrowing, the cost of household consumption borrowing, the return on savings and the annual inflation rate for the period (2006 to 2010). Table 12 shows the calculation of weights t and 1 - t and Table 13 shows the calculation of weights s and 1 - s.
Using the above equation and the data provided in Tables 11, 12 and 13, the real social discount rate was estimated at 5.97 percent per annum.
4. Summary results of applying the decisionmaking criteria
4.1 Private CBA
The mentioned costs and benefits along with the private discount rate were used to estimate the NPV, IRR and BCR of the private project. These results are summarised in Table 14.
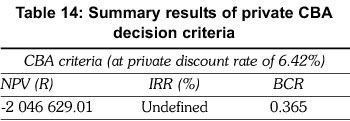
The private CBA shows unfavourable results - the NPV is R-2 046 629.01, the IRR is undefined (this is due to no sign change being present in the cost benefit profile), and BCR is less than unity (0.365).
4.2 Social CBA
The above mentioned costs and benefits along with the social discount rate were used to estimate the NPV, IRR and BCR of the social project. These results are summarised in Table 15.
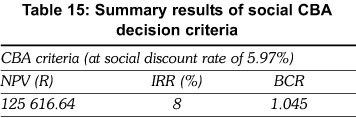
The social CBA yielded positive results, with a NPV of R125 616.64, an IRR of 8 percent (which exceeds the social discount rate of 5.97 %), and a BCR of 1.045.
5. Sensitivity analysis
5.1 Private CBA
A sensitivity analysis is applied to the private CBA to test the results found by altering the discount rate and the bidding price.
5.1.1 The private discount rate
The derived private discount rate of 6.42 percent was revised upwards and downwards by 2 percent and 4 percent. The results are shown in Table 16.
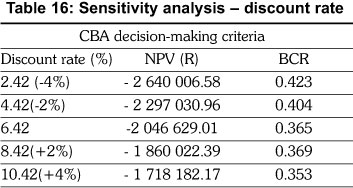
The changes in the discount rate do not significantly change the decision-making criteria. All results remain negative.
5.1.2 The bidding price
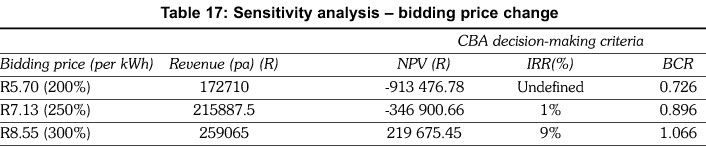
The revenue earned by the Tyefu electrification project is dependent on the bidding price given during the tender process. A sensitivity analysis was conducted by varying the upper limit of the bidding price, namely R2.85/kWh (Norton Rose, 2011).
The price was increased by 200 percent, 250 percent, and 300 percent. The results of the sensitivity analyses are shown in Table 17.
All three decision criteria become favourable when the bidding price is increased by 300 percent (R8.55/kWh).
5.2 Social CBA
A sensitivity analysis is applied to the social CBA to test the results by altering the discount rate.
The derived social discount rate of 5.97 percent was revised upwards and downwards by 2 percent and 4 percent, respectively. The results are shown in Table 18.

In terms of the NPV, the project becomes socially undesirable for an upward revision of 4 percent in the social discount rate.
6. Conclusion and recommendations
The purpose of this study was to evaluate the economic feasibility of a concentrator photovoltaic project in a non-electrified, rural, previously disadvantaged community. The study area chosen for the case study was a settlement, named Tyefu, consisting of five villages in the Eastern Cape province of South Africa. Two cost benefit analyses (CBAs) were carried out: a private CBA to investigate the project's feasibility from a private energy investor's point of view, and a social CBA to investigate the project's desirability from society's perspective.
The main results were favourable in terms of the social CBA, but unfavourable for the private CBA. More specifically, the social CBA yielded a NPV of R125 616.64, an IRR of 8 percent (which exceeds the social discount rate of 5.97%) and a BCR of 1.045, whereas the private CBA yielded a NPV of R-2 046 629.01 and a BCR of 0.365 (the IRR could not be calculated as there was no sign change in the cost benefit profile - all net benefits were negative).
It can thus be deduced that CPV rollout appears to be economically efficient on a small scale according to the social CBA, but not according to the private CBA. The benefit (income received per kWh) in the private CBA is too small to outweigh the costs of implementing and running a CPV plant in Tyefu. Currently the maximum revenue investors can earn from CPV is R2.85/kWh (Norton Rose, 2011). For a small plant of Tyefu's size, this amount is not high enough to attract private energy investors into undertaking a project of this kind. A sensitivity analysis showed that the current upper limit must be increased by up to 300% to make a project of this magnitude financially viable.
Notes
1. Passive solar energy refers to the design of buildings for harnessing the sun's energy.
2. Conventional solar PV systems make use of non-concentrated sunlight.
3. An anonymous referee made the valid point that normal PV prices have fallen since 2010. Therefore small scale CPV which is more maintenance intensive, may be difficult to justify in remote rural areas.
4. These costs were calculated using an energy conversion table where the useful energy is determined per traditional fuel (Purcell, 2011).
5. The battery cost is only incurred every four years.
6. All cost components relate to a system size of 30 000 Wp.
7. 96 batteries are required for electricity storage.
8. An anonymous referee made the valid point that if electricity was generated for income generation (productive use), then both the social and private perspectives would change in a positive direction.
9. The IRR is not reported here, as a change in the discount rate does not affect it. The IRR is independent of the discount rate, and remains at 8%.
Acknowledgements
The authors wish to thank two anonymous referees for their valuable comments as well as an anonymous referee from the ERSA for additional comments and recommendations.
References
Aitken, R. (2007). Household Energy Use: A Comparison of Household Energy Consumption and Expenditure across Three Provinces. Journal of Energy in Southern Africa, 18(1): 20-28. [ Links ]
Daido. (2011a). What is CPV and Why It is Important? Online. http://www.daido.co.jp/en/products/cpv/whats.html. (Accessed 16 March 2011). [ Links ]
Daido. (2011b). Double Use of Land. Online. http://www.daido.co.jp/en/products/cpv/space.html. (Accessed 21 May 2011). [ Links ]
Department of Minerals and Energy. (2003). White Paper on Renewable Energy. Online. http://www.info.gov.za/view/DownloadFileAction?id=68765. (Accessed 14 October 2009). [ Links ]
Du Preez, M. (2004). The Discount Rate for Public Sector Conservation Projects in South Africa. African Development Review. 16: 456-471. [ Links ]
Emery, J. (2011). Personal Correspondence. DB Shenker. Port Elizabeth. [ Links ]
Eskom. (2011). Guide to Independent Power Producer (IPP) Processes. Online. http://www.eskom.co.za/live/content.php?Item_ID=14324. (Accessed 19 May 2011). [ Links ]
Goosen, J. (2011). Personal Correspondence. RECLAM. Port Elizabeth. [ Links ]
Hanley, N. and Spash, C.L. (1993). Cost-Benefit Analysis and the Environment. Vermont: Edward Elgar. [ Links ]
Monde-Gweleta, N.N., van Averbeke, W., Ainslie, A., Ntshona, Z.M., Fraser, G.C.G., and Belete, A. (1997). Agriculture and Rural Livelihood in NorthWest Peddie district. Agrekom.36: 616-625. [ Links ]
Mullins, D., Mosaka, D.D., Green, A.B., Downing, R. and Mapekula, PG. (2007). A Manual for Cost Benefit Analysis in South Africa with Specific Reference to Water Resource Development. Water Research Commission, Report No. TT 305.07. 2nd ed. South Africa: Conningarth Economists. [ Links ]
National Renewable Energy Laboratory. (2011). Climatological Solar Radiation (CSR) Model. Online. http://www.nrel.gov/gis/solar_map_development.html. (Accessed 29 January 2010). [ Links ]
Ngqushwa Local Municipality. (2011). Integrated Development Plan (IDP). Online. http://www.ngqushwamun.gov.za/INTEGRATED-FEVELOPMENT-PLAN. (Accessed 20 June 2011). [ Links ]
Norton Rose, (2011). South Africa Renewable Energy IPP Request for Proposals. Online: http://www.nor-tonrose.com/knowledge/publications/54959/south-africa-renewable-energy-ipp-request-for-proposals. (Accessed 15 August 2011). [ Links ]
Pardell, R. (2011). Personal Correspondence. Valldoreix Greenpower. Valldoreix, Spain. [ Links ]
Purcell, C. (2011). Personal Correspondence. Energy and Development Group (EDG). Port Elizabeth. [ Links ]
PV Technology Research Advisory Council. (2006). A Strategic Research Agenda for Photovoltaic Solar Energy Conversion Technology. Online. http://www.eurec.be/en/. (Accessed 29 January 2010). [ Links ]
PV Technology Research Advisory Council. (2007). A Strategic Research Agenda for Photovoltaic Solar Energy Conversion Technology. Online. http://www.eurec.be/en/. (Accessed 29 January 2010). [ Links ]
South African Reserve Bank. (2010). Official Website. Online. http://www.reservebank.co.za. (Accessed 4 March 2010). [ Links ]
SolFocus. 2011b. Sustainability. Online. http://www.solfocus.com/en/sustainability/. (Accessed 22 March 2011). [ Links ]
Statistics South Africa. (2007). Labour Force Survey. Online: http://www.statssa.gov.za/publications/P0210/P0210March2007.pdf. (Accessed 23 January 2011). [ Links ]
The World Bank (2010). Database. http://data.world-bank.org/indicator/EN.ATM.CO2E.PC?order=wbapi_data_value_2010+wbapi_data_ value+wbapi_data_value-last&sort=desc. (Accessed 31 October 2013). [ Links ]
Watkins, T. (2010). An Introduction to Cost Benefit Analysis. Online. http://www.sjsu.edu/faculty/watkins/cba.htm. (Accessed 22 April 2010). [ Links ]
Winkler, H. (2005). Renewable Energy Policy in South Africa: Policy Options for Renewable Electricity. Energy Policy. 33: 27-38. [ Links ]
Received 3 July 2012
Revised 4 November 2013

