


Servicios Personalizados
Articulo
 Inglés (pdf)
 Articulo en XML
 Referencias del artículo
Indicadores

Links relacionados
-
 Citado por Google
 -
 Similares en Google
Compartir

 Permalink
Journal of Energy in Southern Africa
versión On-line ISSN 2413-3051
versión impresa ISSN 1021-447X
J. energy South. Afr. vol.24 no.2 Cape Town may. 2013
RESEARCH ARTICLE
Decoupling analysis of electricity consumption from economic growth in China
Ming ZhangI; Wenwen WangII
ISchool of Management, China University of Mining and Technology, Xuzhou, PR ChinaIISchool of Science, China University of Mining and Technology, Xuzhou, PR China
ABSTRACT
The purpose of this paper is to apply the decoupling index combined with the LMDI method to analyze the contribution of the factors which influence electricity consumption in China over the period 19912009. The main results are as follows: (1) Electricity consumption has been rising year by year with economic growth. Electricity consumption came to 427.37 Mtce in 2009, which accounted for 19.56% of total energy consumption. (2) China's electricity intensity has continuously decreased during the 1990s and early 2000s, the decreasing trend has reserved since 2003. (3) The economic activity effect is the most important contributor to increase electricity consumption in China, the sector electricity share effect is another important factor leading to the rapid growth of electricity and the energy intensity effect plays the dominant role in decreasing electricity consumption. (4) The period from 1999 to 2007 represents a re-coupling effect, while the other time interval shows weak decoupling effect.
Keywords: China; electricity consumption; LMDI method; decoupling index
1. Introduction
China has become the world's largest consumer for electricity since 1995 (BP 2009). Its electricity consumption rose from 77.63 Mtce in 1991 to 427.37 Mtce in 2009, representing an annual average growth rate of 9.93% (CESY, 2010). Rapid growth in electricity consumption may lead to supply constraints and costly brownouts throughout the country. Thus, it is very necessary to investigate the driving forces governing electricity consumption levels and their evolution. One approach to accomplish this purpose is to decompose the growth of electricity consumption into the possible affecting factors.
Various decomposition methods have being used to quantify the impact of different factors on the change of energy consumption and CO2 emissions. In the literature two well-known decomposition techniques, namely SDA and IDA, have been widely applied to analyze the driving forces. SDA is based on the input-output model in quantitative economics. Rose and Casler (1996) provided a review on its theoretical foundation and major features. Wood (2009) used SDA to analyze Australia's greenhouse gas emissions. IDA uses index number concept in decomposition. Ang and Zhang (2000) and Sun (1998) gave, respectively, details on two kinds of IDA methodologies: Laspeyres index decomposition analysis and the Divisia index decomposition analysis. Each IDA can be applied in a period-wise or time-series manner. A period wise analysis compares indices between the first and the last year of a time period for a given country (or region, industry, etc). However, the results of a period-wise decomposition are very sensitive to the choice of base year and final year and it does not show how the effects of the decomposed factors have evolved over the studied period. A time-series analysis involves yearly decomposition using timeseries data and its results show how the impacts of pre-defined explanatory factors have evolved over time. In any case, period wise results can be derived from a time-series analysis, but not vice versa, of course (Wang et al., 2011).
However, there is no consensus among them as to which is the 'best' decomposition method. Ang (2004) compared various index decomposition analysis methods, and concluded that the LMDI method was the preferred method, due to its theoretical foundation, adaptability, ease of use and result interpretation, along with some other desirable properties in the context of decomposition analysis. Many studies have used the LMDI method to identify quantitatively the relative impact of different factors on the changes in energy consumption and CO2 emissions. The LMDI technique is used by Chung et al. (2011) to evaluate the respective contributions of changes of residential energy use in Hong Kong. Tan et al. (2011) utilized the LMDI technique to examine the driving forces for reducing China's CO2 emission intensity between 1998 and 2008 Liu et al. (2007) also used the LMDI method to analyze the change of China's industrial CO2 emissions from final fuel use.
Since Von Weizsácker (1989) introduced the notion of decoupling, the concept has achieved global recognition as a significant conceptualization of successful economy-environment integration. The decoupling concept was first used to study the environmental problem by Zhang (2000). The decoupling of environmental pressures from economic growth has become a desired policy outcome, whether in climate policy or in a wider context. The UK government, for instance, in its recent strategy paper on Sustainable Production and Consumption sets out a first set of decoupling indicators to measure progress on improved efficiency in material and energy use. The concept of decoupling seems to suggest that this is indeed the case; that economic output can be increased, while at the same time the use of the environment as source and sink for economic activity can be decreased (Enevoldsen, 2007). Many economic observers are skeptical and deny the existence of this "free lunch". The usual question posed is that if this was possible, why would it not have happened already? That concept was developed as an indicator by OECD (2010). The application of decoupling analysis has been conducted by a variety of studies. For example, Climent and Pardo (2007) investigated the relationship between Gross Domestic Product (GDP) and energy consumption in Spanish by taking into account several decoupling factors. Diakoulaki and Mandaraka (2007) evaluated the progress made in 14 EU countries in decoupling emissions from industrial growth. Freitas and Kaneko (2011) examined the occurrence of a decoupling between the growth rates in economic activity and CO2 emissions from energy consumption in Brazil from 2004 to 2009. A number of different concepts have been used to express the different aspects of decoupling. There exist eight types of measuring methods for decoupling. But there is no uniform about the decoupling indicators which is best method (Zhong, et al., 2010.). Moreover, the decoupling index is more effective when combined with other evaluation methods: for example, the decomposition.
Most existing studies have been focused on investigating the decomposition analysis of the electricity consumption and CO2 emissions from electricity generation. Steenhof (2006) applied completed decomposition technique to study electricity demand in China's industrial sector and found that both increased industrial activity and fuel shifts helped increase industrial sector electricity demand between 1998 and 2002. Al-Ghandoor et al. (2010) also used this method to analyze electricity use in the Jordanian industrial sector. The LMDI method was used by Malla (2009) to examine the role of three factors (electricity production, electricity generation structure and energy intensity of electricity generation) affecting the evolution of CO2 emissions from electricity generation in seven countries. Wang et al., (2010) also applied the LMDI method to analyze the potential factors influencing the growth of electricity consumption in China's industrial sector over the period 1998-2007. However, no attention has been devoted to investigate the decomposition analysis of the China's electricity consumption in general. By studying the decoupling indicator on electricity use-economic growth linkage, we can test the effectiveness of the policy implemented in the past. A deeper understanding how electricity consumption evolves in China is also very important in formulating future policies. This paper serves as a preliminary attempt to apply the decoupling index combined with the LMDI method to analyze the contribution of the factors, which influence electricity consumption in China over the period 1991-2009.
The paper is organized as follows: Section 2 describes the methodology of the study. Section 3 discusses data used. The analysis of electricity consumption in China is presented in Section 4. Lastly, Section 5 concludes this study.
2. Methodology
2.1 Definition of factor and LMDI model formulation
The electricity consumption in year t (ELt) can be expressed as Eq.(1)

where t is the time in years; the subscript i represents sectors;
ELti denotes electricity consumption of the i sector in year t;
Eti denotes energy consumption of the i sector in year t;
Qt is the GDP in year t;
 is the share of the i sector electricity consumption in year t to i sector energy consumption;
 is the energy intensity of the i sector in year t;
 is the economic structure in year t.
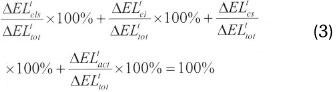
The change of electricity consumption in China between a base year 0 and a target year t, denoted by ΔELttot, can be decomposed into four effects as follows: (i) the changes in the sector electricity share effect (denoted by ΔELtels); (ii) the changes in the energy intensity effect (denoted by ΔELtet); (iii) the changes in the economic structure effect (denoted by ΔELtes); and (iv) the changes in the economic activity effect (denoted by ΔELtact) in additive form, as shown in Eq.(2):

According to the LMDI method given by Ang (2004), each effect in the right hand side of Eq.(2) can be computed as follows:

In the index number, we form
The electricity share measures the effect of fuel shift, from other energy form to electricity, on electricity consumption. The economic structure reflects the effect of the changes in sector structure share on electricity consumption. The energy intensity is used to evaluate fuels quality and the installation of abatement technologies. The economic activity describes the effect of total economic activity changes on electricity consumption, which is regarded as the theoretical electricity consumption.
2.2 Decoupling index formulation
Effort is a general term referring to all actions directly or indirectly inducing a decrease in electricity use. They include measures reducing energy intensity, fuel switching, and shifts towards less energy intensive industry. Thus, the effort in absolute (ΔFt) during the period starting from the base year 0 up to year t can be represented as the sum of the 3 effect factors identified in Eq. (2), or as the difference between total change and economic activity effect

If the sum of the three factors results in reducing electricity use, the value will be negative. In order to assess the degree to which these efforts are effective in terms of the dissociation between economic growth and electricity use, the decoupling index Dt during the period from a base year 0 to a target year t is defined as follows:

The decoupling index Dt takes the following values:
- Dt ≥ 1, denoting strong decoupling efforts;
- 1>Dt>0, denoting weak decoupling efforts;
- Dt < 0, denoting no decoupling efforts (re-coupling).
Because the Eq. (5) refers to a positive economic activity effect, one can determine a decoupling index for each effect from that formula, and the obtained value helps in identifying the relative contribution of each factor to the overall decoupling progress. Furthermore, the overall decoupling index results as the sum of these partial indices:

3. Data description
The research period in this paper starts in 1991 and ends in 2009. In China, the data has been collected from various issues of the China Statistical Yearbook (CSY, 2010) and (CESY, 1991-1996, 1997-1999, 2000-2002, 2003, 2004. 2005, 2006, 2007, 2008, 2009, 2010). The GDP is measured in billion Yuan in constant 1978 price. The energy consumption data is converted into standard coal consumption in Mtce (million tones of coal equivalent).
To prepare the data for undertaking a complete decomposition analysis, the whole economy of China has been divided into three industries: the primary, secondary, and tertiary. The primary industry only includes agriculture and its related activities: farming, forestry, husbandry, secondary production and fishing. The secondary industry consists of mining, manufacturing, water supply, electricity generation and supply, steam, the hot-water and gas sectors, and construction. The remainder is included in the tertiary industry.
4. Results and discussion
4.1. Analysis of electricity consumption
The economic activity of China's economy for the period 1991-2009 is presented in Figure 1. The GDP has increased from 1122.1 billion Yuan in 1991 to 6789.28 billion Yuan in 2009. This period represents an approximately constant rapid growth with an annual average growth rate of 10.5%. At the same time, electricity consumption has been rising year by year. Figure 1 also shows an upward trend both in electricity consumption and GDP over this period. Electricity consumption came to 427.37Mtce in 2009, compared to 77.62Mtce in 1991, with an average annual growth rate of 9.93%.

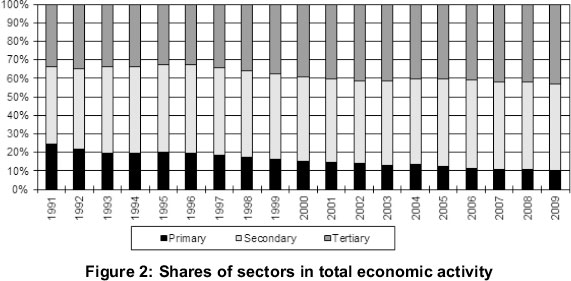
The general structure of China's economy is presented in Figure 2. During the study period, the share of the primary industry continuously declines from 24.5% to 10.3% and the share of the tertiary industry increases from 33.6% to 43.3%. The secondary industry has a dominant share and its importance has increased from a share of 41.7% in 1991 to 46.2% in 2009. There is a substitution between the increasing shares of the secondary industry and the tertiary industry and a decreasing share of the primary industry. From the above analysis, one can conclude that there is a shift in the China economy structure towards the tertiary industry, but the secondary industry still remains the dominant position. Thus, a contribution due to the economic structure effect on electricity consumption is expected.
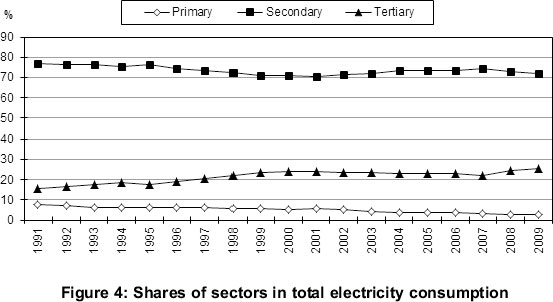
Final energy consumption and the share of electricity in total energy consumption can be followed from Figure 3. China's final energy consumption reached 2184.2Mtce in 2009, which was 168.2% more than that in 1991. The share of electricity in total energy consumption increased from 9.53% in 1991 to 19.56% in 2009. Figure 4 shows the shares of industry sectors in total electricity consumption. During the study period, the share of primary industry continuously declines from 7.5% to 2.7%, and the share of tertiary industry increases from 15.6% to 25.3%. The share of the secondary industry that changes in fluctuation accounts for more than 70%. Figure 5 presents the share of sector electricity consumption in sector total energy consumption, which shows that there is a significant fuel shift toward electricity over the period 1991-2009. The most significant gain is seen in the tertiary industry, which shows an increase of over 260.9% in term of the contribution of electricity to total energy consumption.


The energy use of different industrial sectors can be analyzed by their energy intensities. Figure 6 presents China's energy intensities for the primary, secondary and tertiary sectors as well as the total economy. It is evident that the secondary industry has the highest energy intensity and the primary industry the lowest throughout the period 19912009. The decrease of energy intensity of the secondary industry was biggest and reached 68.2%, and that decreased continually over the period of 1991-2002. It increased slightly from 2003.

Electricity intensity is defined as the amount of electricity consumed in Mtce per one billion Yuan of economic activity. This term reflects real energy intensity gains, or actual physical increases in energy efficiency related to the technical characteristics of the electrical equipment. Electricity intensity for China economy is presented in Figure 7. China's electricity intensity has continuously decreased during the 1990s and early 2000s, the decreasing trend has been reserved since 2003 and the past few years have witnessed the fluctuation change of China's electricity intensity. The shifts in fuel shares between electricity and other forms of energy would increase the obtained value of electricity intensity.

4.2 Decomposition analysis
Results obtained from the decomposition analysis by the help of the LMDI method in section 2.1 are listed in Tables 1 and 2.

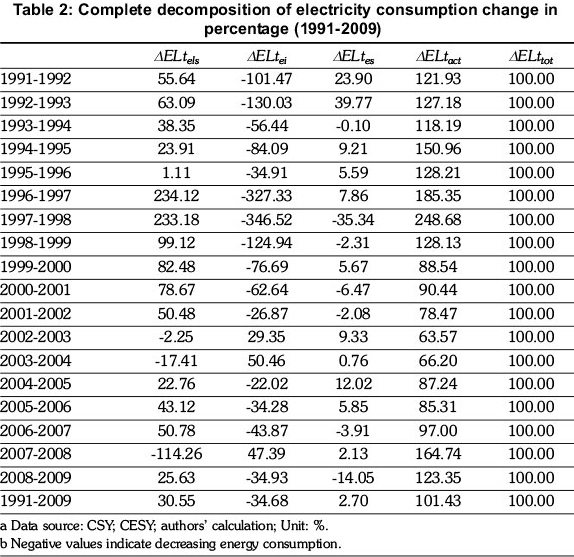
As can be seen from Table 1, economic activity, economic structure and sector electricity share are the critical factors in the growth of electricity consumption in China. The economic activity effect allows for the continual increase of electricity consumption over the period 1991-2009. The accumulated (period-wise) effect is an increase of 35.475Mtce, which accounts for 101.43% of the total change in absolute value. During the study period, the economic activity effect fluctuates between 63.57% and 248.68% and is the dominant contribution to the change in electricity consumption. Electricity demand is closely linked to economic growth, as shown in Figure 1. Thus, future electricity demand in China is expected to increase quickly with China's economic growth.
Another important factor leading to the rapid growth of electricity is the sector electricity share effect. This analysis shows that shifts towards electricity led to an increase of nearly 10.685Mtce of electricity consumption, which accounts for 30.55% of the total change in absolute value. Our results also show that the sector electricity share effect increased electricity consumption in most years except 2002-2004 and 2007-2008. Across every industrial sector, there were some level of fuel switches towards electricity between 1991 and 2009, as shown in Figure 5. For the secondary industry, the reason may be that most electricity-intensive subsectors and products expanded rapidly, which was driven by higher investment. With economic growth, residents have higher incomes and a higher propensity to purchase appliances and other electrical goods items, which leads to an electricity demand increase for households.
As shown in Tables 1 and 2, the economic structure effect is another factor that increases electricity demand over the period 1991-2009. The accumulated (period-wise) effect is an increase of 0.943Mtce, which only accounts for 2.7% of the total electricity demand change in absolute value. This indicates that structural changes do not have a large impact on changing electricity. As shown in Figure 2, there is a substitution between the increasing shares of the secondary industry and the tertiary industry and a decreasing share of the primary industry. Figure 2 also shows that there is a shift in the China economy structure towards the tertiary industry and the secondary industry still remains the dominant position. This may be the main reason that the economic structure effect plays a positive role in increasing electricity use.
Our results also show that the energy intensity effect plays the dominant role in decreasing electricity consumption. The accumulated (period-wise) effect is a decrease of 12.128Mtce, which accounts for 34.68% of the total electricity change in absolute value. The changes of China's energy intensities for the period from 1991 to 2009 are presented in Figure 6, illustrating a general decrease in energy intensities. This may be due to a new process, new technologies and new equipment, which were accompanied by the extensive application of energy-saving technologies and the advancement at management level.
4.3. Decoupling analysis
According to the method presented in Section 2.2, Figure 8 presents the decoupling index of electricity consumption from economic growth. The decoupling index is less than 1, which indicates that strong decoupling does not exist in China. Figure 8 also shows that the decoupling index varies between -0.03 and -0.57 from 1999 to 2007. That is, the value of the decoupling index represents a re-coupling effect. The other time interval shows a weak decoupling effect.

The decoupling index is defined as the ratio of the sum of the sector electricity share effect, energy intensity effect, and economic structure effect to the change of economic activity effect. As shown in Table 1, the economic activity effect makes the continual increase of electricity use over the period 1991-2009 and the value of this effect gradually increase, which also shows that this effect plays an essential role in the re-coupling process. Figure 1 also shows an upward trend both in electricity use and GDP over this period. Figure 9 presents the decoupling index together with its distribution to each single type of effort.

Table 1 shows that the energy intensity decreases electricity use in 16 years, which results in the energy intensity effect not decreasing enough for decoupling the relationship between electricity use and GDP in China. The most important change explaining the achieved dissociation refers to the energy intensity effect except for 2002-2004 and 2007-2008. As mentioned, the advancement of energy intensity may be due to the use of a new process, new technologies and new equipment, which were accompanied by the extensive application of energy-saving technologies and the advancement of management level.
As shown in Table 1, the economic structure effect does not play an essential role in the decoupling process, and its impact is positive for 19971998, 2000-2002, 2006-2007 and 2008-2009.
Though there is a shift in the Chinese economy structure towards the tertiary industry, the secondary industry still remains the dominant position. This may be the main reason that the economic structure effect plays a very minor role in the decoupling process.
Table 1 also shows that the sector electricity share effect decreases electricity use only in 3 years. Furthermore, the accumulated (period-wise) effect is an increase of 10.68Mtce, which accounts for 30.5% of the total electricity use change in absolute value. As shown in Figure 3, fuel switching for terminal use towards electricity and heat from coal and its products, may explain the energy mix effect playing a positive role in the decoupling process.
5. Conclusions
The purpose of this paper is to analyze the current status of electricity consumption in China during the period 1991-2009, and the LMDI technique is used to find the nature of the factors that influence the changes in electricity consumption. Lastly, the decoupling index is developed based on those factors to evaluate the progress in decoupling electricity consumption from economic growth. The main conclusions drawn from the present study may be summarized as follows:
- Electricity consumption in China has been rising year by year with economic growth. In 2009, electricity consumption came to 427.37Mtce, which accounted for 19.56% of total energy consumption. The secondary industry consumed more than 70% of total electricity over the period 1991-2009.
- China's electricity intensity has continuously decreased during the 1990s and early 2000s, and the decreasing trend has been reserved since 2003. However, the shifts in fuel shares between electricity and other forms of energy would increase the obtained value of electricity intensity.
- The economic activity effect is the most important contributor to increase electricity consumption in China and the sector electricity share effect is another important factor leading to the rapid growth of electricity demand. The economic structure effect plays a minor role to increase electricity demand over the period 1991-2009, and the energy intensity effect plays the dominant role in decreasing electricity consumption.
- The period from 1999 to 2007 represents a re-coupling effect, while the other time interval shows a weak decoupling effect. The most important change explaining the achieved dissociation is the energy intensity effect. China is still at an early stage of motorization, so the future electricity demand will increase quickly. Viable approaches to improve energy utilization are placing greater emphasis on optimizing the energy utilization structure and improving the energy-utilization effectiveness. The electricity consumption analysis and its corresponding results may offer constructive suggestions for the optimization and improvement. According to the results obtained in this paper, the strategic measures for sustainable development should aim at: (1) improving the efficiency of electricity use, particularly at energy-intensive energy sectors; (2) developing renewable energy; (3) promoting a shift of economic structure toward less energy-intensive services and a shift of a product mix towards high value-added products; (4) encouraging imports of energy-intensive products, especially electricity-intensive products. We hope the results of this study will be a useful reference for setting priority strategies of reducing electricity use in China.
Acknowledgments
The authors gratefully acknowledge the financial support from the Fundamental Research Funds for the Central Universities (2013QNA11).
References
Al-Ghandoor, A., Al-Hinti, I., Mukattash, A., & Al-Abdallat, Y, (2010). Decomposition analysis of electricity use in Jordanian industrial sector. International Journal of Sustainable Energy 29, 233-244. [ Links ]
Ang, B.W., (2004). Decomposition analysis for policymaking in energy: which is the preferred method? Energy Policy 32, 1131-1139. [ Links ]
Ang, B.W., & Zhang, FQ., (2000). A survey of index decomposition analysis in energy and environmental analysis. Energy 25, 1149-1176. BP (2009). Statistical Review of World Energy. [ Links ]
CESY (China Energy Statistical Yearbook), 1991-1996, 1997-1999, 2000-2002, 2003, 2004. 2005, 2006, 2007, 2008, 2009, 2010. National Bureau of Statistics of China. National Development and Reform Commission. Chung, W., Kam, M.S., & Ip, C.Y., (2011). A study of residential energy use in Hong Kong by decomposition analysis, 1990-2007. Applied Energy 88, 51805187. [ Links ]
Climent, FF, & Pardo, A., (2007). Decoupling factors on the energy-output linkage: the Spanish case. Energy Policy 35, 522-528. [ Links ]
CSY (China Statistical Yearbook), (2010). National Bureau of Statistics of China. [ Links ]
Diakoulaki, D., Mandaraka, M., (2007). Decomposition analysis for assessing the progress in decoupling industrial growth from CO2 emissions in the EU manufacturing sector. [ Links ] Energy Economics 29, 636-664.
Enevoldsen, M.K., Ryelund, A.V, & Andersen, M.S., (2007). Decoupling of industrial energy consumption and CO2-emissions in energy-intensive industries in Scandinavia. Energy Economics 29, 665-692. [ Links ]
Freitas, L.C., & Kaneko, S., (2011). Decomposing the decoupling of CO2 emissions and economic growth in Brazil. Ecological Economics 70, 1459-1469. [ Links ]
Liu, L.C., Fan, Y., Wu, G., Wei, Y.M., (2007). Using LMDI method to analyze the change of China's industrial CO2 emissions from final fuel use: An empirical analysis. Energy Policy 35, 5892-5900. [ Links ]
Malla, S., (2009). CO2 emissions from electricity generation in seven Asia-Pacific and North .American countries: A decomposition analysis. Energy Policy 37, 1-9. [ Links ]
OECD (Organization for Economic Co-operation and Development), (2010). Indicators to Measure Decoupling of Environmental Pressure from Economic Growth. Sustainable Development. SG/SD (2002) 1/Final. Website: http://www.olis.oecd.org/olis/ 2002doc.nsf/LinkTo/sg-sd (2002) 1-final accessed on August 28. [ Links ]
Rose, A., & Casler, S., (1996). Input-output structural decomposition analysis: a critical appraisal. Economic Systems Research 8, 33-62. [ Links ]
Steenhof, P.A., (2006). Decomposition of electricity demand in China's industrial sector. Energy Economics 28, 370-384. [ Links ]
Sun, J.W., (1998). Accounting for energy use in China, 1980-94. Energy 23, 835-849. [ Links ]
Tan, Z.F, Li, L., Wang, J.J., & Wang, J.H., (2011). Examining the driving forces for improving China's CO2 emission intensity using the decomposing method. Applied Energy 88, 4496-4504. [ Links ]
Von Weizsácker, E.U., (1989). Erdpolitik: Ökologische Realpolitik an der Schwelle zum Jahrhundert der Umwelt. Wissenschaftliche Buchgesellschaft, Darmstadt. [ Links ]
Wang, W.C., Mu, H.L., Kang, X.D., Ning, YD., & Song, R.C., (2010). Changes in industrial electricity consumption in China from 1998 to 2007. Energy Policy 38, 3684-3690. [ Links ]
Wang, W.W., Zhang, M., & Zhou, M., (2011). Using LMDI method to analyze transport sector CO2 emissions in China. Energy 36, 5909-5915. [ Links ]
Wood, R., (2009). Structural decomposition analysis of Australia's greenhouse gas emissions. Energy Policy 37, 4943-4948. [ Links ]
Zhang, Z.X., (2000). Decoupling China's carbon emissions increase from economic growth: an economic analysis and policy implications. World Development 28, 739-752. [ Links ]
Zhong, T.Y., Huang, X.J., Han, L., & Wang, B.Y, (2010). Review on the research of decoupling analysis in the field of environments and resource. Journal of Natural Resources 25, 1400-1412. [ Links ]
Received 30 May 2012
Revised 14 March 2013

