Serviços Personalizados
Artigo
 Inglês (pdf)
 Artigo em XML
 Referências do artigo
Indicadores

Links relacionados
-
 Citado por Google
 -
 Similares em Google
Compartilhar

 Permalink
Journal of Energy in Southern Africa
versão On-line ISSN 2413-3051
versão impressa ISSN 1021-447X
J. energy South. Afr. vol.24 no.2 Cape Town Mai. 2013
RESEARCH ARTICLE
Photovoltaic electricity production in a residential house on Réunion
Milorad BojicI; Alexandre Patou ParvedyI; Frédéric MiranvilleII; Dimitri BigotII; Dragan CvetkovićIII; Slobodan DjordjevićIII; Danijela NikolićIII
IFaculty of Engineering, University of Kragujevac, Kragujevac, Republic of Serbia
IILPBS, Equipe Physique et ingénierie mathématique appliquée á l'énergie et l'environnement, University of Réunion Island, Réunion, Republic of France
IIIFaculty of Engineering, University of Kragujevac, Kragujevac, Republic of Serbia
ABSTRACT
In this paper, the electrical energy generation of photovoltaic (PV) arrays is discussed for three cities on the island of Réunion (the Republic of France) located in the Indian Ocean. Each PV array has a different orientation as it is placed at different parts of the roof of a residential house that supposedly is a sustainable building. The electrical energy generation is obtained by using EnergyPlus software and measured solar radiation data. The highest generation of electric energy is found for the PV array located at the north roof surface. The generation of electric energy at the east-facing PV array is larger than that at the west-facing PV array. The electrical energy generation for the city of Le Port on the coast is higher than that for the cities of Cilao, and Plaine des Cafres that are located in the mountains of Réunion.
Keywords: residential house; photovoltaic; electrical energy; EnergyPlus
1. Introduction
Globally, a requirement for sustainable buildings is driven by necessity and urgency to decrease carbon dioxide emissions, and relieve energy shortage. Accordingly, clear time targets are set worldwide for sustainable buildings. First, the Energy Performance of Buildings Directive of the European Union (EU) states that all buildings built after 31 December 2018 will have to produce their own energy onsite (Kammer, 2009). From 2020 and thereafter in the USA, all new Federal buildings that enter the planning process should be designed to achieve zero-net-energy by 2030 (White House, 2009). To progress with the development and adoption of high performance buildings in the USA, the Net Zero Energy Commercial Building Initiative aims to achieve marketable zero-net energy buildings by 2025 through public and private partnerships (Dion, 2007). Finally, the UK Government set out improvements to energy requirements in Building Regulations to include that all new homes have to be 'zero carbon' by 2016 (UK Green Building Council, 2008). An answer to all these targets is a sustainable building that heavily relies on use of PV arrays for energy generation.
As the most important devices as such, a building would have PV arrays placed on building roofs. It is important to investigate different issues around PV arrays such as their potential assessment, roof heat transfer, roof orientation, life cycle analyses, and case study applications. There has been an extensive worldwide research that covers the topics of the roof integrated PV (RIPV) application. In this direction, the current RIPV applications are reviewed by several authors such as Pagliaro et al. (2010), Parida et al. (2011), and Mekhilef et al. (2011). Pagliaro et al. discuss merging the RIPV with the construction industry. Parida et al. review across used solar photovoltaic technologies in RIPV. Mekhilef et al. discuss solar energy use in industries. These reviews show that currently there are several issues of interest for RIPV systems such as potential assessment, roof heat transfer, roof orientation, application, and life cycle analyses.
Regarding potential assessment, Jo and Otanicar (2011) do the mesoscale assessment of building integrated roof solar energy systems by using a hierarchical methodology. Bergamasco and Asinari (2011) base the assessment of the photovoltaic solar energy potential on the available roof surface area by using scalable methodology. Regarding roof heat transfer, Dominguez et al. (2011) investigate the effects of solar photovoltaic panels on roof heat transfer. Chen et al. (2010) investigate thermal performance of a PV system thermally coupled with a ventilated concrete slab in a low energy solar house. Regarding the orientation of the PV array and a roof surface, it is recognized that the choice of PV array orientation is fundamental to its efficient operation.
In his theoretical study, Chang (2009) analyses the generation of electric energy from a fixed and single-axis tracking PV array at different orientations in Taiwan. The study considers the extra-terrestrial radiation and the global radiation that are predicted by an empirical model and the measured radiation. Armstrong and Hurley (2010) propose a method for selecting the optimum orientation of the solar array in an overcast climate. In addition, the investigations are shown on the optimum orientation for different load profiles. Kacira et al. (2004) used a mathematical model to determine optimum orientation of a PV array installed in Turkey. Regarding the life cycle analysis for RIPV, Frankl et al, (1998) do a simplified life-cycle analysis of PV systems in buildings where he focused on the present situation and future trends. Kato et al. (1998) report the energy pay-back time and life-cycle CO2 emissions of a residential PV power system with a silicon PV module. Lu and Yang (2010) perform an environmental payback time analysis of a roof-mounted building-integrated photovoltaic (BIPV) system in Hong Kong.
Regarding BIPV applications, Cheng et al. (2005) presents an empirical approach to BIPV evaluation of solar irradiation for building applications. Benemann et al. (2001) report about several large scale projects on using building-integrated PV modules. Meyer (2010) gives electrical performance results of an energy efficient building with an integrated photovoltaic system in Southern Africa. However, this literature review shows that more research attention should be devoted towards the determination of the amount of electrical energy generated by differently oriented PV arrays at their location (thus orientation) in different climates (in near tropical conditions) with measured data for solar radiation, and for different types of houses, taking into account the different social situations of their users.
This paper shows and discusses the effects of different location of PV arrays on the roof and amount of generated electrical energy. The investigated locations of PV arrays are established when they are placed on different parts of a roof of a residential house at Réunion Island in the Republic of France, in the Indian Ocean at the latitude of 21 south. These parts of the roof face different directions: east, west, north, south, and zenith. In addition, the PV array groups are studied that cover several differently oriented roof surfaces. The research was performed for solar radiation data measured at different locations at Réunion Island. The investigated locations are the cities of Le Port, Plaine des Cafre, and Cilaos. For this research, software EnergyPlus is used that gives the amounts of specific electrical energy generated during different months, and during the entire year.
2. Mathematical model
To establish the mathematical model for electrical energy generation, first, the investigated house is described, second, its PV system is described, third, the used mathematical model is given, fourth, the climate is discussed, and finally, the use of EnergyPlus modelling software with obtained outputs is discussed.
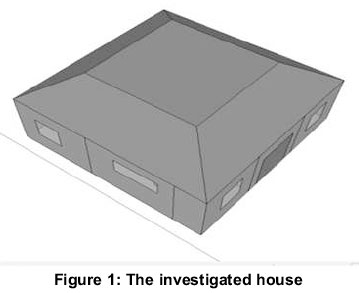
2.1 Investigated house
In this research, the electrical energy production of the residential house is investigated. The house, shown in Figure 1, is traditionally shaped. It is 81 m2. Its roof consists of five surfaces (where PV arrays may be placed): one horizontal of 25 m2 and 4 inclined surfaces. Each of the inclined surfaces has an area of 17.5m 2, and a slope of 37° toward the horizon. These inclined roof surfaces would either face north, south, east or west.
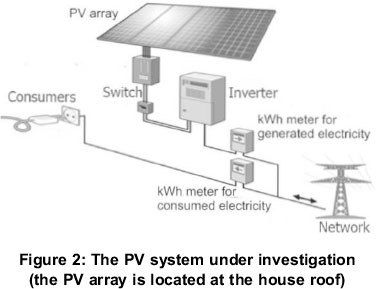
2.2 The PV system
The PV system is installed in the house. The inves- tigated PV system is shown in Figure 2. The PV arrays are located at the house roof and are connected to the grid and the house. The PV system consists of a PV array, an inverter, a kWh meter for the generated electrical energy, and a kWh-meter for the consumed electrical energy. The PV array produces the DC electricity that is sent to the inverter where it becomes AC electricity. This AC electricity is either spent at the house or is exported to the electricity grid. At each moment, different amounts of electrical energy are produced by the PV array and consumed by the residence or by the electricity grid network. The goal of this investigation is to analyse electrical energy output of the PV array. The system would run during the entire year. The operation of the PV array is simulated by using EnergyPlus.
2.3 Investigated PV arrays
Five PV arrays are investigated with different sizes and orientations (locations). The first is located in the 17.5m2 area of the 37º-inclined roof facing north, the second is on the 17.5m2 area of the 37º-inclined roof facing east, the third is on the 17.5m2 area of the 37º-inclined roof facing roof south, the fourth is on the 17.5m2 area of the 37º-inclined roof facing west, and the fifth is on the 25m2 area of the horizontal roof. It is assumed that the PV arrays have an efficiency of 12%, and operate at the maximum power. The inverter is selected with maximum efficiency. That may not be a case when the PV system operates under the real conditions.
The power of electrical energy production is assumed constant over the time step. The PV modules are assumed to always run when GT>0.3W. If this is not the case, then the PV modules produce no power. Thermal effects of the PV arrays on temperature distribution inside the house are not reported.
2.4 The climate
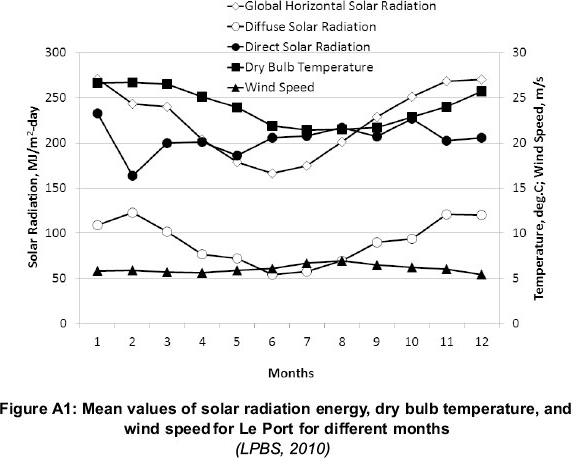
Réunion Island is situated at the latitude of 21° south, and the longitude of 55° east. The climate is humid tropical. There are two seasons. A season from May to October is mainly cool and dry with the trade winds. A season from November to April is mainly hot and wet with light winds. The direct solar radiation and diffuse solar radiation are taken from meteorological files, with data measured for the three towns at Réunion Island (Cilaos, Plaine des Cafres, and Le Port). They differ in altitude. The average altitude of Le Port is 1m, Cilaos 1201m, and Plaine des Cafres 1700m.
For different months, mean values of solar radiation energy, dry bulb temperature, and wind speed for Le Port, Réunion Island, are shown in Figure A1.
2.5 Simulations
The output of EnergyPlus are amounts of electrical energy generated during each time step i (15 min duration) by the PV array (EPV,i) during the entire year. By adding them, we determine the monthly amounts of specific electrical energy produced by the PV array [EPV,M,j /(365Fk) where j = 1,2.....12] and the yearly amount of electrical energy produced by PV array [EPV/(365Fk )]. Here, k designates the PV array entity for which these variables are calculated.
3. Results and discussion
For the city of Le Port, the specific electrical energy generated during different months and during the entire year is calculated and reported for different PV array groups at the roof of the investigated house. The research is performed for the three cities.
3.1 Monthly generation of electrical energy in Le Port
3.1.1 PV arrays at single roof parts
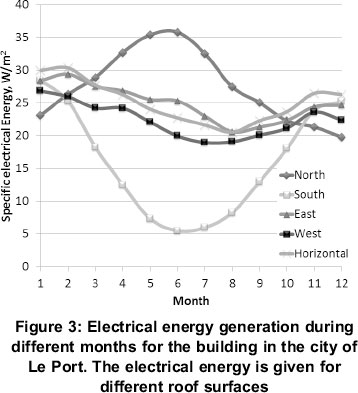
Electrical energy generated during different months in Le Port is shown in Figure 3. The electrical energy is generated by PV arrays located at different parts of the roof of the house. The PV arrays are put at five parts of the roof: east, west, north, south and horizontal. During almost the entire year, the highest amount of electrical energy is generated by the PV array placed at the horizontal roof except for the months of May, June, and July (winter months). During winter, the highest amount of electrical energy is generated by the PV array located at the north roof. For the month of July, the electrical energy generation is higher for the array at the north roof than that for the PV array at the horizontal roof for about 55%. The electrical energy generation for the PV array at the east roof is higher than that at the west roof during the entire year. The highest difference of up to 30% is in June, while this difference during months of August to November is insignificant. The electrical energy generation is the lowest for the array at the south roof from February to October.
3.1.2 PV arrays at non-single roof parts
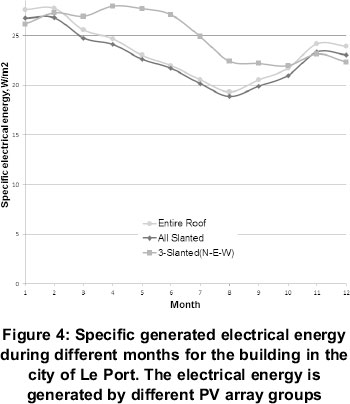
The specific electrical energy generated by several PV array groups during different months is given in Figure 4. Each investigated PV array group is located at the roof for the building in the city of Le Port. These groups consist of PV arrays covering several roof parts directed in different directions. The investigated groups are that covering the entire roof (all slanted parts and horizontal part), all slanted roof parts, and the 3 slanted roof parts (east, north, and west). During winter, the specific generated electrical energy is the highest for the PV array group covering the 3-slanted part roof. This value is around 25% higher than that for the other investigated PV array groups. During summer, the specific generated electrical energy is almost the same for the all PV array groups.
3.2 Comparison of monthly generation of electrical energy for different cities
The specific generated electrical energy during each month and year are compared for three Réunion cities: Le Port, Cilaos, and Plaine des Cafres.
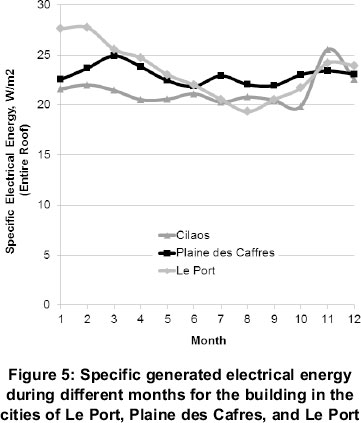
The monthly amounts of electrical energy generated by the PV arrays that cover the entire roof of the investigated building are shown in Figure 5 for different cities. The figure shows that during summer, the specific generated electrical energy would be around 26% larger in Le Port than that in other cities. During winter, the specific generated electrical energy would be around 15% larger in Plane des Cafres than that in other cities. During the entire year, the specific generated electrical energy would be the lowest in Cilaos as it is surrounded with high mountains.
3.3 Comparison of yearly generation of electrical energy for different cities in Réunion
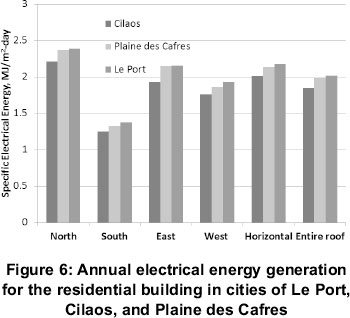
The annual amounts of specific electrical energy generated by the investigated building are shown in Figure 6. The PV arrays cover the east, west, north, south and horizontal surfaces of the roof. The highest amount of specific electrical energy is generated by the PV array covering the horizontal roof. The amount of the generated electrical energy is 32% larger at the PV array covering the horizontal roof than that covering the north roof, and up to 150% larger than that covering the south roof. For each city, the amount of the electrical energy generated by the PV array covering the east roof is larger up to 15% than that covering the west roof. The lowest amount of electrical energy is generated by the PV array on the south roof. The amount of the generated electrical energy is larger for the building in the city of Le Port than that in the city of Plaine des Cafres (insignificantly), and Cilaos (up to 10%) because Le Port resides north to Plaine des Cafres, and Cilaos. The electrical energy generation in Plaine des Cafres is higher than that in Cilaos as Plaine des Cafres lies at the plane and Cilaos in the valley surrounded by high mountains.
4. Conclusion
In this paper, the investigation of electrical energy generation by PV arrays placed on the roof of a residential house is reported. The house is located at Réunion Island in the Republic of France, on the approximate latitude of -21° South. The PV arrays would cover five roof parts. These covered roof parts may be directed toward east, west, north, south and zenith. The research was performed for the measured data on direct and diffuse solar radiation by using software EnergyPlus. The software gives the amounts of electrical energy generated during different months, and during the entire year.
The specific electrical energy generated during different months is reported for the city of Le Port.
During summer, the highest amount of the specific electrical energy is obtained by the PV array covering the horizontal part of the roof. During the entire year, the specific electrical energy generated by the PV array covering the east roof is higher than that of the PV array covering the west roof. The lowest specific electrical energy is obtained by the PV arrays covering the south roof.
The specific electrical energy generated by several PV array groups during different months is also reported for the city of Le Port. During winter, the specific electrical energy is the highest for the PV array group covering the 3-slanted roof parts. During summer, the specific generated electrical energy is almost the same for the all PV array groups.
The specific electrical energy generated during the year by different PV arrays is moreover reported for the city of Le Port. The largest specific electrical energy is obtained by the PV arrays covering the north-facing roof part, and the smallest specific electrical energy is obtained by the PV arrays covering the entire roof.
For comparison, the monthly amounts of specific electrical energy generated by the PV arrays that cover the entire roof are reported for different cities. During summer, the specific electrical energy would be larger in Le Port than that in other cities. During winter, the specific electrical energy would be larger in Plane des Cafres than that in other cities.
For further comparison, the annual specific electrical energy generated by PV arrays in different cities is separately shown. The yearly specific electrical energy is higher in the city of Le Port than that for Plaine des Cafre and Claos.
Acknowledgement
This paper is a result of two activities: (1) a visiting professorship of Prof. Milorad Bojić to the University of Réunion Island, Réunion, Republic of France; and (2) project TR33015. The first activity is financed by the University of Réunion Island, Republic of France, and the second activity by the Ministry of Education, Science and Technological Development of Republic of Serbia. We would like to thank these institutions for their financial support during these investigations.
References
Armstrong S., & Hurley W.G. (2010). A new methodology to optimise solar energy extraction under cloudy conditions. Renewable Energy, Volume 35, 2010, Pages 780-787. [ Links ]
Benemann, J., Chehab, O., & Schaar-gabriel, E. (2001). Building-integrated PV modules. Solar Energy Materials, 67, 345-354. [ Links ]
Bergamasco, L., & Asinari, P (2011). Scalable methodology for the photovoltaic solar energy potential assessment based on available roof surface area: Application to Piedmont Region (Italy). Solar Energy, 85(5), 1041-1055. [ Links ] Chang T.P (2009). Output energy of a photovoltaic module mounted on a single-axis tracking system. Applied Energy, Volume 86, 2009, Pages 2071-2078. [ Links ]
Chen, Y., Athienitis, A.K., & Galal, K. (2010). Modelling, design and thermal performance of a BIPV/T system thermally coupled with a ventilated concrete slab in a low energy solar house: Part 1, BIPV/T system and house energy concept. Solar Energy, 84(11), 18921907 [ Links ]
Cheng, C., Chan, C., & Chen, C. (2005). Empirical approach to BIPV evaluation of solar irradiation for building applications. Renewable Energy, 30(7), 1055-1074. [ Links ]
Dion J., (2007). Building Technologies Program, Energy Efficiency and Renewable Energy. US Department of Energy, October 2007, retrieved 14. Jan. 2010. [ Links ]
Dominguez, A., Kleissl, J., & Luvall, J. C. (2011). Effects of solar photovoltaic panels on roof heat transfer. Solar Energy, 85(9), 2244-2255. [ Links ]
Frankl, P, Masini, a, Gamberale, M., & Toccaceli, D. (1998). Simplified life-cycle analysis of PV systems in buildings: present situation and future trends. Progress in Photovoltaics: Research and Applications, 6(2), 137-146. [ Links ]
Jo, J. H., & Otanicar, T. P (2011). A hierarchical methodology for the mesoscale assessment of building integrated roof solar energy systems. Renewable Energy, 36(11), 2992-3000. [ Links ]
Kacira M., Simsek M., Babur Y., and Demirkol S., (2004). Determining optimum tilt angles and orientations of photovoltaic arrays in Sanliurfa, Turkey. Renewable Energy, Volume 29, 2004, Pages 1265-1275. [ Links ]
Kammer J., (2009). All new buildings to be zero energy from 2019, Press Service Directorate for the Media, European Parliament, 2009. [ Links ]
Kato, K., Murata, A., & Sakuta, K. (1998). Energy pay[]back time and life[]cycle CO2 emission of residential PV power system with silicon PV module. Progress in Photovoltaics: Research and Applications, 6(2), 105-115. [ Links ]
Lawrence Berkeley National Laboratory (2001). EnergyPlus Engineering Document: The Reference to EnergyPlus Calculations. Lawrence Berkeley National Laboratory, 2001, retrieved 14. Jan. 2010. [ Links ]
LPBS - Laboratory of Physics of Buildings and Systems (2010). Réunion University, Weather online, Files of weather types for the island of Réunion, http://lpbs.univ-Réunion.fr/grandsprojets/meteo/telecharg.php, retrieved 14. Jan. 2010. [ Links ]
Lu, L., & Yang, H. X. (2010). Environmental payback time analysis of a roof-mounted building-integrated photovoltaic (BIPV) system in Hong Kong. Applied Energy, 87(12), 3625-3631. [ Links ]
Mekhilef, S., Saidur, R., & Safari, a. (2011). A review on solar energy use in industries. Renewable and Sustainable Energy Reviews, 15(4), 1777-1790. [ Links ]
Meyer, E. L. (2010). Electrical performance results of an energy efficient building with an integrated photo- voltaic system. Journal of Energy in Southern Africa, 21(3). [ Links ]
Pagliaro, M., Ciriminna, R., & Palmisano, G. (2010). BIPV: merging the photovoltaic with the construction industry. Progress in Photovoltaics: Research and Applications, 18(1), 61-72. [ Links ]
Parida, B., Iniyan, S., & Goic, R. (2011). A review of solar photovoltaic technologies. Renewable and Sustainable Energy Reviews, 15(3), 1625-1636. [ Links ]
UK Green Building Council (2008). Zero Carbon Task Group Report, WWF-UK. UK Green Building Council, 2008, retrieved 14. Jan. 2010. [ Links ]
Appendix
A1 Mathematical model
A mathematical model of the PV array is used as proposed by Lawrence Berkeley National Laboratory (2001). The PV array electrical power is described by the following equation:
P = Asurf factiv GT ηcell ηinvert (1)
Here, P is the usable electrical power [W] produced by the PV array, Asurf is the net area of the array [m2], factiv is the fraction of area with active solar cells [-], ηcell is the PV array efficiency [-], ηinvert is DC to AC conversion efficiency of the inverter [-], and GT is the total solar incident radiation on PV array [W/m2]. It is assumed that the PV array has a efficiency of 12%. On the right hand side of this equation, only GT is calculated by EnergyPlus and the rest are user inputs. For solar radiation, the full geometric model is used, including sky models, shading, and reflections, to determine the incident solar radiation. The model simulates the operation of the PV system under real conditions. To determine the temperature of the PV module, the 'Decoupled' method was used. The model of the PV module is developed under the assumption that it operates at its maximum power. That may not be the case when the PV system operates under the real conditions. The inverter is selected with maximum efficiency.
A2 The model in EnergyPlus Environment
This model represents the simplest model for predicting PV energy production in an EnergyPlus environment. It is given in the Generator:PV:Simple object. The power of electrical energy production is assumed constant over the time step. The PV modules are assumed to always run when GT>0.3W. If this is not the case, then the PV modules produce no power. In EnergyPlus, the PV modules are managed by an electric load centre. The load centre is a "load" with respect to generating equipment but is a "supply centre" for the rest of the house and the outside network. In addition, the PV modules need to be connected to ElectricLoadCentre:Distribution objects of EnergyPlus with a DC buss type.