


Services on Demand
Article
 English (pdf)
 Article in xml format
 Article references
Indicators

Related links
-
 Cited by Google
 -
 Similars in Google
Share

 Permalink
Journal of Energy in Southern Africa
On-line version ISSN 2413-3051
Print version ISSN 1021-447X
J. energy South. Afr. vol.24 n.1 Cape Town Jan. 2013
Potential and future of concentrating solar power in Namibia
Y Le FolI; K NdhlukulaII
IDepartment of Development and Planning, Aalborg University
IIRenewable Energy and Energy Efficiency Institute, Polytechnic of Namibia
ABSTRACT
The Namibian electricity sector has mainly relied on electricity imports from the Southern African Power Pool (SAPP) over the last decade. However, a growth in electricity demand and scarce import options could cause energy shortages. Therefore, new power plants ought to be commissioned in the near future to avoid the forecasted energy crisis. In this context, Concentrating Solar Power (CSP) generation is regarded as an appropriate alternative to conventional energy technologies, particularly for the excellent solar regime available in Namibia. The study presents a GIS analysis that identifies suitable areas for CSP establishment. A broad range of geographical parameters such as solar radiation, topography, hydrology or land use are examined. The calculations show that the CSP ceiling generation in Namibia is equivalent to 70% of the worldwide electricity production. Moreover, the study offers a scenario analysis where concrete CSP alternatives are compared to coal-fired plant projects developed by the national power utility. Meteonorm and System Advisor Model (SAM) are used to design CSP alternatives located in the area offering the best combination between high solar irradiation and short distances to the infrastructures. Despite the affordability concern which has to be addressed with sound financial instruments, CSP represents a seminal opportunity for the energy sector in Namibia.
Keywords: Namibia, concentrating solar power, GIS, ceiling generation, levelized cost of electricity mapping, scenario analysis
1. Introduction
Namibia has 415 MW of installed generation capacity shared among four conventional power plants (Ruacana hydropower station, Van Eck coal-fired plant, Anixas and Paratus diesel plants) (Nampower, 2011a). This power system is ageing, inefficient and insufficient. Consequently, the national power utility, Nampower, relies on imports (e.g. 60% in 2010) from the Southern African Power Pool (SAPP) to secure the electricity supply. However, a growth in electricity demand estimated at 4% and the expiry of the import agreement with Zimbabwe in 2013 will expose Namibia to electricity shortage. Nampower forecasts a power supply deficit of 80 MW by the end of 2012, increasing to 300 MW by 2015. Thus, a revision of the current system as well as new power plant procurements, are necessary. In this context, conventional energy technologies are particularly considered since they are less capital intensive. For example, Nampower is currently studying the feasibility of a new 150 to 300 MW coal-fired power plant in the Erongo Region. However, generation deficit could also be tackled with renewable energy technologies which provide supplementary benefits (e.g. security of supply and sustainability). For instance, Concentrating Solar Power is a commercially mature and proven technology (Rainer et al., 2005), adaptable to the load demand curve (Bosatra et al., 2010) and potentially competitive with coal-fired power by 2020 (IEA, 2010a).
Moreover, CSP is expected to offer substantial efficiency in Namibia as a result of high solar irradiation (on average, 2 500 kWh/m2/y).
The paper evaluates the potential and future of CSP in Namibia. A first section presents a GIS analysis that identifies suitable areas for CSP deployment and estimates the CSP ceiling generation. Subsequently, a second section offers a map- ping of the Levelized Cost of Electricity (LCOE) for a 50 MW CSP plant in order to assess the geographic distribution of CSP economic performances across the country. Finally, a third section compares the possible future of CSP and coal power in Namibia through a scenario analysis encompassing economic, social and environmental aspects.
2. Assessment of suitable areas for CSP deployment in Namibia
2.1 Description
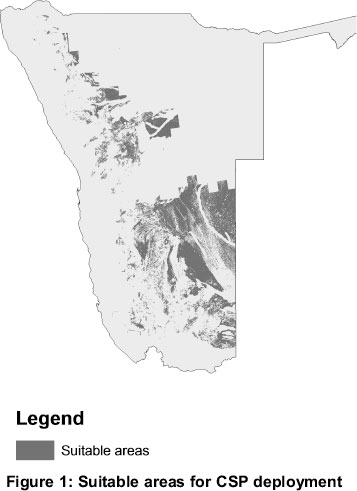
This first section of the paper aims to evaluate the technical potential of CSP in Namibia. Geographical parameters either necessary or inappropriate to the construction and/or the operation of a CSP plant are analysed in order to identify suitable areas for CSP deployment. Moreover, the annual electricity potentially generated if all suitable areas were dedicated to CSP (ceiling generation) is calculated. This figure offers an interesting ground of comparison notwithstanding the improbability of such a CSP deployment.
2.2 Methodology
The assessment of suitable areas for CSP deployment is an exercise which has been conducted in different regions of the world. The design of the geographical parameters included here is based on a thorough review of the literature describing similar GIS analysis. For instance, several papers elaborate on CSP prospects in the MENA countries (Broesamle et al., 2001; Trieb, 2005; Ummel et al., 2008). Additionally, Bravo et al (2007) and Fluri (2009) did a spatial analysis respectively of the Spanish and South African territory to determine the associated CSP ceiling generations.
In the study, the whole Namibian territory was screened according to geographical parameters relevant to the construction and the operation of a CSP plant. The necessary geographical data was collected in various GIS datasets. For instance, a digital elevation model with a resolution of 90 meters was retrieved from the Shuttle Radar Topography Mission (SRTM) data and used to identify areas with a suitable ground slope (CGIAR, 2011). Moreover, the NREL/SWERA dataset on solar radiation provided average daily measures of direct normal irradiation (DNI) over surface cells of approximately 40 km by 40 km in size (≈22 arc-minutes) with an uncertainty of 10% (SWERA, 2011). Other GIS data were accessed from the Namibian Atlas Project E1 of the Ministry of Environment and Tourism (Directorate of Environment) and from the Hydrogeological Mapping Project HYMNAM of the Ministry of Agriculture, Water and Forestry (Department of Water - BGR) (MET, 2002; MAWF, 2001). The geographical parameters as well as the related screenings are detailed below:
The ceiling generation was calculated in order to compare the technical potential of CSP in Namibia with those of other countries (e.g. Spain and South Africa). The related equations are as follows:
ceiling generation = suitable area x land use eficiency x average DNI
where:
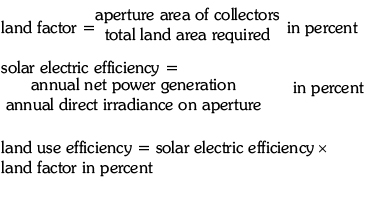
2.3 Results
The suitable areas account for 13% of the Namibian territory (see Figure 1) and they have a daily DNI average of 7.8 kWh/m2/d, i.e. 2 839 kWh/m2/y. Considering a solar to electricity factor of 12% and a land efficiency factor of 37% (Trieb et al., 2009), the CSP ceiling generation in Namibia reaches 13 885 TWh/y. This represents 3 800 times the total units of electricity sold by Nampower in 2010 including customers, mines and exports. Furthermore, the CSP ceiling generation in Namibia is equivalent to 70% of the world electricity generation (20 055 TWh in 2009, IEA).
The ceiling generation in Spain has been estimated at 9 897 TWh/y with a total surface area representing 13.3% of the territory. The analysis of Bravo et al. (2007) is comparatively less conservative since the geographic parameters included are fewer; i.e. ground slope, land cover and DNI. Yet, the ceiling generation in Namibia is 1.4 times greater than in Spain which is one of the leading countries in CSP with 4 456 MW of projects completed or under development (NREL, 2011).
The ceiling generation in South Africa equals 1 861.4 TWh/y with a suitable land area of 15 334 km2 (Fluri, 2009). The parameters included are a ground slope limit of 1% as well as an average solar DNI superior to 7.0 kWh/m2/d. Moreover, only areas within a distance of 20 kilometres from the transmission lines were considered suitable. When the former parameter is applied to Namibia, suitable areas represent 6.6% of the territory (i.e. 54 132 km2). The ceiling generation related is 6 823 TWh/y, i.e. 3.6 times superior than in South Africa.
3. Identification of the most promising areas 3.1 Description
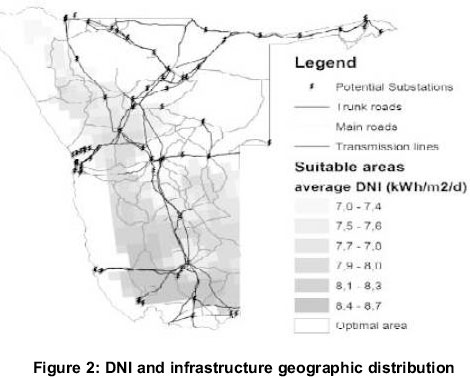
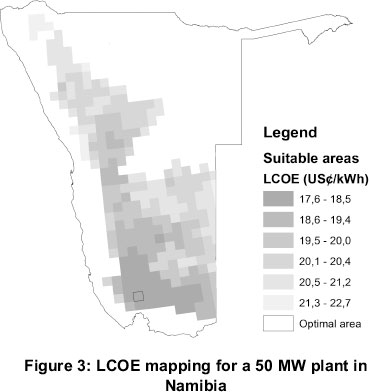
Multiple site specific features influence the economic performances of a CSP plant. For instance, the generation output is almost proportional to the amount of solar irradiation collected on the solar field (Yang et al., 2009). Moreover, it is preferable to select a site relatively close to infrastructures such as transmission lines and road in order to limit the construction costs. As it is illustrated in Figure 2, both the infrastructure and solar irradiation are unequally distributed across Namibia.1 Therefore, the second section of this paper evaluates the potential CSP economic performances for the suitable areas previously identified. The repercussions of both solar irradiation and infrastructure accessibility are assessed by mapping the Levelized Cost of Electricity (LCOE) of a 50 MW CSP parabolic trough plant.
3.2 Methodology
The definition of the LCOE applied in the paper is in line with the NREL and IPCC's recommendations (Short et al., 2005; IPCC, 2011). Although the LCOE is usually used to compare different energy technologies, it is selected here as the relevant indicator to rank suitable areas.
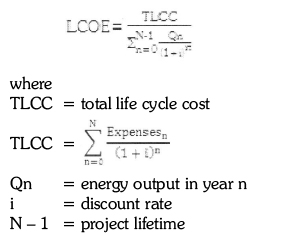
The expenses included are the initial investment, the operation and maintenance as well as the infrastructure costs (i.e. transmission line, connection and road construction). The energy output per year is calculated according to the plant design and available solar irradiation.
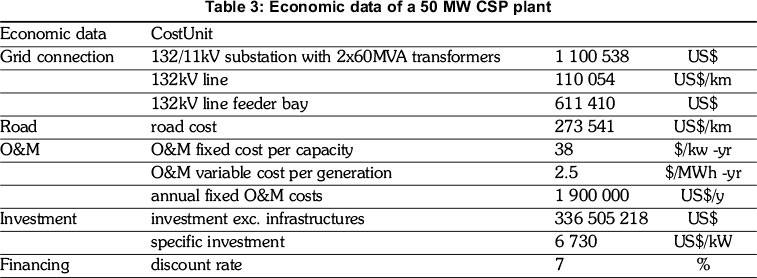
The CSP design selected is a parabolic trough 50 MW plant with a storage capacity of 6 hours. The model and cost related were set up through System Advisor Model (SAM). The plant characteristics are as follows:
Economic data strictly related to the CSP plant and included in the calculation rely on NREL reference plant for cost modelling (Turchi, 2010). Nevertheless, Namibian specific data were preferred and used when available. The labour costs included in the operation and maintenance were adapted from the distribution of wages find in the Namibian electricity, gas and water sector (MLSW, 2002). Moreover, transmission lines construction and connection costs are Namibian specific to be communicated by the national power utility2 (Fourier, pers. communication, 2011). Finally, the road construction cost estimation is based on local projects (e.g. Gobabis to Grootfontein road project) (Pienaar, 2008).
3.3 Results
The calculations show that according to the area localization the LCOE range from 17.4 to 22.5 US¢/kWh when the infrastructures costs are included. Similarly, they range from 16.9 to 19.5 US¢/kWh when the infrastructure costs are excluded. A comparison with the LCOE averages available in the literature offers an interesting perspec- tive. The IPCC special report on renewable energy resources (2011) gives LCOE within a range of 16 to 25 US¢/kWh for a CSP plant installed with 6 hours of storage (discount rate: 7%). Additionally, in the Ecostar Road map an LCOE of 22.3 USC/kWh (17.3 €¢/kWh) is estimated for a parabolic CSP plant installed with 3 hours of storage in Spain (Pitz-Paal et al., 2005).
Although, CSP prices are very volatile and depend on local conditions, the LCOE found in Namibia is rather low due to the high solar irradiation available. Furthermore, the plant considered here is equipped with a dry cooling system which is the most expensive cooling technology. Given that certain areas in Namibia could provide enough water to utilize a wet cooling system, the LCOE achievable could drop to 14.5 US¢/kWh (excluding infrastructures). The prerequisite is that areas with the maximum solar irradiation would match high water abstraction potential.
4. CSP a concrete alternative to conventional energy technologies for the Namibian electricity sector 4.1 Description
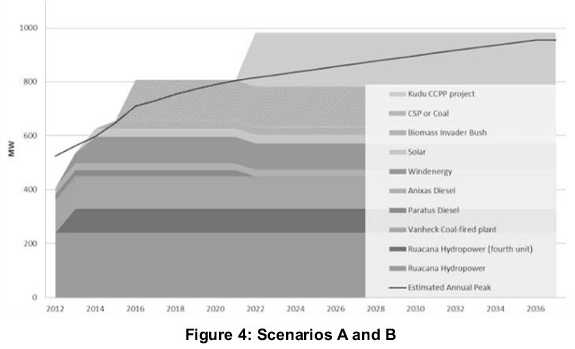
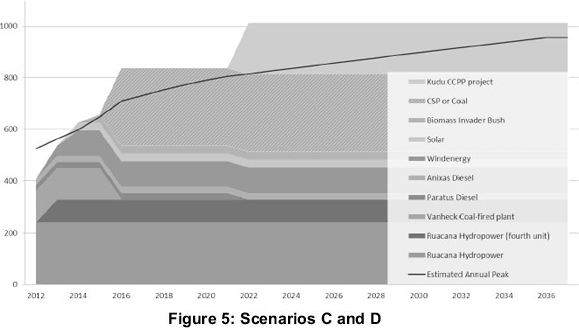
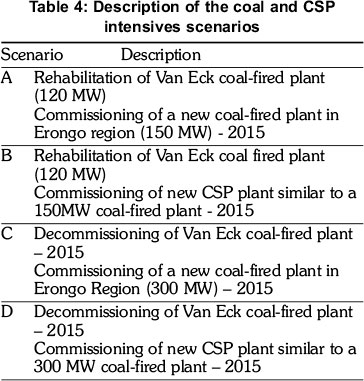
The first two sections of the paper offer the necessary information to investigate the potential for CSP to challenge effectively conventional energy technologies in the Namibian context. Nampower, is currently studying two coal projects; i.e. the rehabilitation of the Van Eck 120 MW coal-fired plant and the construction of a new 150 to 300 MW plant in Erongo Region (Nampower, 2011a). The rehabilitation study was launched in August 2011 and funded by US Trade and Development Agency (USTDA). In 2011, the Van Eck coal-fired plant was only used as a peaker due to its general inefficiency (operational capacity of 55 MW instead of 120 MW) and high operating costs. Its rehabilitation aims at regaining regular generation performance (e.g. capacity factor: 75%). On the other hand, the environmental impact assessment of the Erongo project is already completed and a possible com- missioning is planned in 2018.
This section aims at examining the feasibility of switching from these projects to concentrating solar power. Different scenarios suiting with the supply sector were built (Le Fol, 2012) and the CSP plants were considered to be established in the optimal area identified in the previous section. The meteorological data of this specific area were obtained via Meteonorm. Moreover, the CSP performances and the impact of different thermal energy storage (TES) capacity were computed through the System Advisor Model (SAM). Additionally, multiple indicators3 (e.g. health and climate change external costs, job creation) were set up in order to enlarge the scope of analysis and to include environmental and social aspects.
4.2 Methodology
The whole supply sector was considered in order to build relevant and realistic scenarios although only the costs and energy generated by CSP and coal-fired plants were examined. For each scenario, the 35-years-old Paratus power plant is decommissioned by 2021. Moreover, renewable energy such as wind power (100 MW of on-going project) or solar photovoltaic are installed to avoid the energy shortage likely to occur by 2012. In addition, a combined cycle gas power plant of 200 MWe (Kudu CCPP project) is installed in 2022. Within these fixed conditions, the four scenarios were designed according to the following description:
The operation and maintenance and fuel costs (159 US$/t -1297 N$/t) were defined according to Nampower's data (Nampower, 2011a; ECB, 2001). Moreover, the specific rehabilitation costs were estimated according to available data on four other Southern African coal-fired plant rehabilitation projects (SADC, 2008). The same methodology has been used to design the 150 MW and 300 MW new coal-fired plants. Nevertheless, the specific investment cost were defined according to the South African average (2 104 US$/kWe) available in the IEA report on Projected Cost of Generating Electricity (IEA, 2010b).
The CSP plants were considered to be located in the optimal area identified in the previous section. Thus, accurate meteorological data was collected for this specific location via Meteornorm. This software provided data from three meteorological stations (Keetmanshoop, Alexander Bay, Upington) to retrieve the Typical Meteorological Year (TMY) of the optimal area. Furthermore, the given TMY was integrated in SAM in order to design the CSP alternatives which supply the same amount of electricity per year with coal-fired reference plants. Different variations on the CSP components were analysed (e.g. solar multiple, storage capacity, nameplate capacity) to identify the most appropriate alternatives. The economic data strictly related to the investment costs are based on the NREL reference plant for cost modelling and Namibian specific data on wages were included in operation and maintenances costs (Turchi, 2010; MLSW, 2002).
4.3 Results
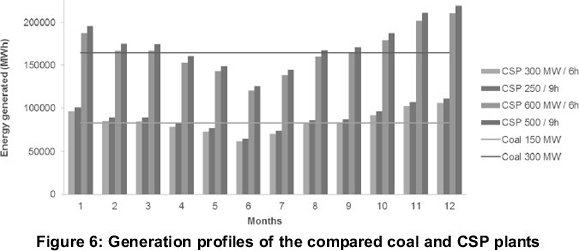
The analysis results in four different designs which, technically speaking, challenge coal-fired genera- tion (see Figure 6). The solar multiple and the storage capacity increases enable to reduce the name-plate capacity and to improve the capacity factor of the CSP plant whilst an even generation output is supplied. However, the seasonal variations in solar radiations cause output fluctuations for CSP plant whereas, the coal generation is assumed stable over time. This difference has to be put into perspective according to the seasonal electricity demand which is higher during summer time in Namibia when CSP plants are likely to produce more electricity.
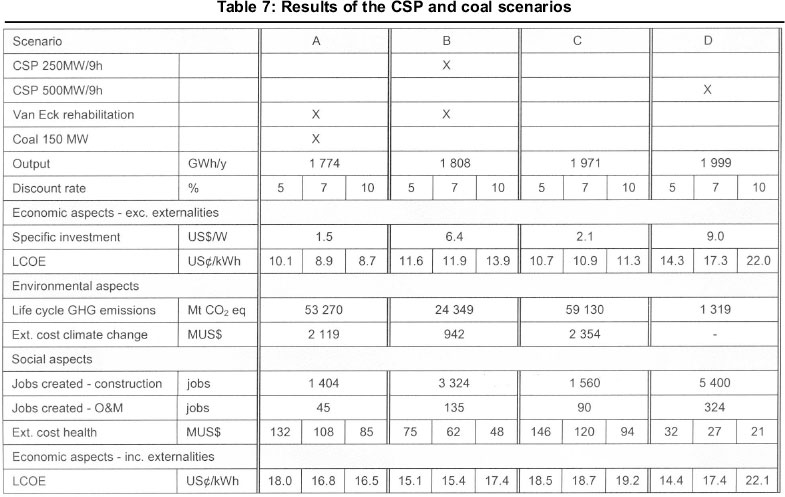
The analysis4 demonstrates that coal intensive scenarios are generally more affordable due to lower investment costs (see Table 7). Their LCOE varies between 8.7 to 11.3 US¢/kWh while LCOE related to CSP intensive scenarios are within a range of 10.7 to 22.0 US¢/kWh. The low cost of coal power is a strong advantage since affordable electricity is required in a country having an electrification rate of 34% (IEA, 2011). On the other hand, CSP intensive scenarios create more jobs (e.g. scenario C: 90 jobs, scenario D: 324 jobs) which is considerably beneficial in Namibia where the unemployment rate reaches 51.2% (MLSW, 2008). Moreover, the external costs of coal intensive scenarios are substantial due to more damaging impacts on health and environment. For example, a 300 MW coal-fired plant would emit 59 130 Mt of CO2eq during its lifetime while a 500 MW CSP plant 1 319 Mt of CO2eq. Consequently, the LCOE of CSP intensive scenarios are even lower than LCOE of coal intensive scenarios when including external costs.
5. Conclusion
The CSP technology presents numerous advantages with regard to the Namibian electricity sector context. First of all, the massive solar and land resources would ensure the security of supply while conventional energy technologies, such as coal power, are primarily sensitive to the fuel price volatility. Moreover, the CSP technology would respond to the difficulties met by the supply sector in terms of base load deficit and grid stability. Additionally, the job created during the CSP construction and operation phases are comparatively high and the emergence of a new industrial sector based on a successful technology transfer would strengthen the Namibian economy. Furthermore, the impacts of CSP on health and environment are negligible. Conversely, a 300 MW coal-fired plant, for instance, would involve health external cost of US$ 120 million over its lifetime and would change the Namibia's international rank with respect to CO2 emissions from 126th to 114th. However, the economic competitiveness of CSP compared with conventional energy technologies remains a challenge. Therefore, further research on drivers that would improve CSP economic performances have to be conducted. Sound financial schemes such as Clean Development Mechanism (CDM) and foreign or national economic supports (e.g. targeted tax breaks, Green Climate Fund) could bridge the gap between CSP and conventional energy costs. Finally, hybrid technologies combining CSP and other energy resources existing in Namibia (e.g. biomass and gas) are options which have to be examined.
Notes
1. The road network and electrical grid GIS dataset were respectively provided by the Road Authority of Namibia and Nampower (Road Authority, 2011; Nampower, 2011b).
2. Construction of transmission lines, construction and connection costs included in this study are generic and they do not constitute any commitment from Nampower.
3. The indicators included were defined according to the literature. CSP and Coal plants external cost on environment (neglected for CSP) and life cycle GHG emissions: Burkhardt et al., 2011; IPCC, 2011. CSP and Coal plants external cost on health: IPCC, 2011. Coal and CSP job creation: Rutovitz, 2010.
4. The CSP options with 9 hours of storage and a solar multiple of 2.5 were selected for the economic analysis, particularly because their capacity factors (46%) is closer to those of coal plants (75%) and their characteristics would respond better to the Namibian supply sector issues (e.g. need for base load).
Acknowledgements
The authors particularly wish to thank Dr. Frede Helplund (Aalborg University), Dr. Franz Trieb (DLR) and Mr. Kudakwashe Ndhlukula (REEEI - also as co-author) for providing their guidance. The support offered by the land management division of Polytechnic of Namibia has largely contributed to the achievement of this study. They would like to thank Mr. Sebastian Mukumbira, Mr. Kaleb G. Negussie and Dr. Daniel Wyss.
References
Bosatra, M., Fazi, F, Lionetto, PF, Travagnin, L., and Italiana-Corsico, FW.,( 2010). Utility-Scale PV and CSP solar power plants Performance, impact on the territory and interaction with the grid. Conference Power-Gen Europe, Amsterdam, The Netherlands 810 June 2010. www.fwc.com/publications/tech_ papers/files/TP_Solar_10_01.pdf, accessed 4 December 2011 [ Links ]
Bravo, J., Garcia Casals, X. & Pinedo Pascua, I., (2007). GIS approach to the definition of capacity and generation ceilings of renewable energy technologies. Energy Policy, 35(10): 4879-4892. [ Links ]
Broesamle, H., Mannstein, H., Schillings, C., and Trieb, F, (2001). Assessment of solar electricity potentials in North Africa based on satellite data and a geographic information system. Solar Energy, 70(1): 1-12. [ Links ]
Burkhardt, J., Heath, A., and Turchi, C., (2011). Life Cycle Assessment of a Parabolic Trough Concentrating Solar - Power Plant and the Impacts of Key Design Alternatives. Environment Science Technology, 45: 2457-2464. [ Links ]
CGIAR, (2011). SRTM 90m Digital Elevation Database v4.1. www.cgiar-csi.org/category/elevation/, accessed 13 October 2011. [ Links ]
ECB (Electricity Control Board), (2001). National Electricity Tariff Study, Final Report. www.ecb.org.na/pdf/Tariff%20Study%20Final%20Report.pdf, accessed 3 October 2011 [ Links ]
Fluri, T.P., (2009). The potential of concentrating solar power in South Africa. Energy Policy, 37(12): 50755080. [ Links ]
IPCC (Intergovernmental Panel on Climate Change), (2011). IPCC special Report on Renewable Energy Resources and Climate Change Mitigation. Prepared by Working Group III of the Intergovernmental Panel on Climate Change. Cambridge University Press, Cambridge, United Kingdom and New York, NY, USA. http://srren.ipcc-wg3.de/report,, accessed 4 December 2011. [ Links ]
IEA (International Energy Agency), (2011). WORLD ENERGY OUTLOOK 2011. OECD/IEA, PARIS, FRANCE. [ Links ]
IEA (International Energy Agency), (2010a). Technology Road Map - Concentrating Solar Power. OECD/IEA, Paris, France. www.iea.org/papers/2010/csp_roadmap.pdf, accessed 22 November 2011. [ Links ]
IEA (INTERNATIONAL ENERGY AGENCY), 2010B. PROJECTED COST OF GENERATING ELECTRICITY, OECD/IEA, PARIS, FRANCE. [ Links ]
LE FOL, Y., (2012). RENEWABLE ENERGY TRANSITION FOR A SUSTAINABLE FUTURE IN NAMIBIA. MASTER'S THESIS. DEPARTMENT OF DEVELOPMENT AND PLANNING, AALBORG UNIVERSITY. http://projekter.aau.dk/projekter/files/63642504/Master_Thesis_Yoann_Le_Fol.pdf. [ Links ]
MAWF (Ministry of Agricultur, Water and Forestry), (2001). The Hydrogeological Map of Namibia (HYMNAM), porous aquifers coverage. GIS dataset available at the Department of Water/BGR, Windhoek, Namibia. [ Links ]
MET (Ministry of Environment and Tourism), (2002). Atlas of Namibia Project, Directorate of Environmental Affairs, www.uni-koeln.de/sfb389/e/e1/download/atlas_namibia/index_ e.htm, accessed 5 October 2011 [ Links ]
MLSW (Ministry of Labour and Social Welfare), (2002). Namibia Occupational Wage Survey. Windhoek, Namibia. [ Links ]
MLSW (Ministry of Labour and Social Welfare), (2008). Namibia Labour Force Survey (NLFS). Windhoek, Namibia. [ Links ]
Nampower, (2011a). Annual Report (2010). www.nam-power.com.na/docs/NomPower_Annual_Report_2010.pdf, accessed 5 November 2011 [ Links ]
Nampower, (2011b). Primary conductor and substation shape files data. www.nampower.com.na/pages/gis-downloads.asp, accessed 16 October 2011 [ Links ]
NREL (National Renewable Energy Laboratory), 2011. Concentrating solar power projects database. www.nrel.gov/csp/solarpaces/, accessed 28 October 2011. [ Links ]
Pienaar, W., (2008). Economic evaluation of the proposed road between Gobabis and Grootfontein, Namibia. South African Journal of Economics, 76(4): 667-684. [ Links ]
Pitz-Paal, R., Dersch, J., Milow, B., Ferriere, A., Romero, M., Tellez, F., Steinfeld, A., Langnickel, U., Shpilrain, E., and Popel, O., (2005). ECOSTAR Road Map Document, DLR, Stuttgart, Germany. www.pre.ethz.ch/publications/0_pdf/various/ECOSTA R_Executive_Summary.pdf, accessed 3 October 2011. [ Links ]
Rainer, A., Brakmann, G., Geyer, M., and Teske, S., (2005). Concentrated Solar Thermal Power-Now!. Greenpeace International, Amsterdam. [ Links ]
Road Authority of Namibia, (2011). Road network shape files data. Available at the Road Management System division, Windhoek, Namibia. [ Links ]
Rutovitz, J., (2010). South African energy sector jobs to 2030. Prepared for Greenpeace Africa by the Institute for Sustainable Futures, University of Technology, Sydney, Australia. [ Links ]
Short, W., Packey, D.J. and Holt, T., (2005). A manual for the economic evaluation of energy efficiency and renewable energy technologies. Report TP-462-5173, NREL, Golden, USA. www.nrel.gov/docs/legosti/old/5173.pdf, accessed 22 September 2011. [ Links ]
SADC (Southern African Development Community), (2008). Status of the generation projects in the Southern African Power Pool, Today Volume 10. www.sardc.net/editorial/sadctoday/view.asp?vol=587&pubno=v10n4&page=ENERGY, accessed 10 December 2011. [ Links ]
SWERA (Solarand Wind Energy Resource Assessment), (2011). Monthly and annual average direct normal (DNI), global horizontal (GHI), latitude tilt, and diffuse GIS data at 40km resolution for Africa from NREL. http://en.openei.org/datasets/node/494, accessed 11 October 2011. [ Links ]
Trieb, F., (2005). Concentrating solar power for the Mediterranean region. DLR, Stuttgart, Germany. www.dlr.de/Portaldata/1/Resources/portal_news/news archiv2008_1/algerien_med_csp.pdf, accessed 23 October 2011 [ Links ]
Trieb, F., Schillings, C., O'Sullivan, M., Pregger, T., and Hoyer-Klick C., (2009). Global potential of concentrating solar power. Solar Paces Conference, Berlin, Germany September 2009. www.solarthermal-world.org/files/global%20potential%20csp.pdf?download, accessed 6 November 2011. [ Links ]
Turchi, C., (2010). Parabolic trough reference plant for cost modelling with the solar advisor model (SAM). Technical Report TP-550-47605, NREL, Golden, USA. www.nrel.gov/docs/fy10osti/47605.pdf, accessed 14 November 2011. [ Links ]
Ummel, K., and Wheeler, D., (2008). Desert power: the economics of solar thermal electricity for Europe, North Africa, and the Middle East, Center for Global Development, Washington D.C., USA. www.cgdev.org/files/1417884_file_Desert_Power_FIN AL_WEB.pdf, accessed 16 October 2011.s [ Links ]
Yang, B., Zhao, J., Yao, W., Zhu, Q., and Qu, H., (2010). Feasibility and Potential of Parabolic Trough Solar Thermal Power Plants in Tibet of China, Power and Energy Engineering Conference, Chendgu, China 28-31 March 2010. [ Links ]

