


Servicios Personalizados
Articulo
 Inglés (pdf)
 Articulo en XML
 Referencias del artículo
Indicadores

Links relacionados
-
 Citado por Google
 -
 Similares en Google
Compartir

 Permalink
Journal of Energy in Southern Africa
versión On-line ISSN 2413-3051
versión impresa ISSN 1021-447X
J. energy South. Afr. vol.24 no.1 Cape Town ene. 2013
A concentrating solar power value proposition for South Africa
Paul GauchéI; Theodor W von BackströmI; Alan C BrentII
ISolar Thermal Energy Research Group, Department of Mechanical and Mechatronic Engineering, Stellenbosch University
IICentre for Renewable and Sustainable Energy Studies, School of Public Leadership, Stellenbosch University
ABSTRACT
Concentrating solar power (CSP) offers the potential for a high degree of localization and an alternative strategy to meet electricity demand for South Africa in a future of uncertain conventional resources. The integrated resource plan (IRP) makes strides to introduce renewables to the electricity generation system by 2030, but we argue that the proposed energy mix is too reliant on resources that are not only unsustainable but also at risk in the short to medium term. Coal and other conventional resources may be more limited than originally anticipated, which if true, requires action to be taken soon. CSP is currently the only sustainable and dispatchable energy technology that could domestically supply a significant portion of South Africa's electricity needs. A balanced mix of PV, wind and CSP can provide the energy supply needed in South Africa, but steps are required soon to take advantage of the localization potential and excellent sustainable energy resources.
Keywords: concentrating solar power; value proposition; integrated resource plan.
1. Introduction
We propose a concentrating solar power (CSP) value proposition for South Africa as follows: CSP is the ideal future dispatchable power technology for South Africa in the broadest context in that it can dispatch power to demand and can enable a very high degree of local inclusion. We present and argue this value at a macro level, and while several specific propositions are made, these will be addressed in greater detail in future.
The South African public know through experience of two related indicators about the current provision of electricity. Firstly, the cost of electricity per kWh is increasing dramatically with little end in sight. In 2011, Eskom began planning the next phase of price increases, applying to the regulator for annual increases in the 25% to 30% range until 2016 (Creamer, 2011). Secondly, generation capacity is stretched thin, and the public has been put on standby for rolling power cuts.
The electricity crisis experienced by the public is paralleled with the underlying polycrisis faced in South Africa for the provision of electricity and energy in general. This polycrisis is so-named due to the impact of multiple environmental constraints and limits that constrain economic development. This problem is particularly acute in South Africa where economic development is strongly resource coupled and considered unsustainable (Heun et al., 2010).
South Africa learned lessons during the previous 15 years during which the country had to deal with a major political transition while being confronted with pressure to change its electricity generation profile away from being coal dominant. The Integrated Resource Plan (IRP) arose at the end of the first decade of this century and it appears to be a robust system. The 20 year horizon with updates every 2 years, the legal mandate, and a plan with rigorous stakeholder input should be the right way forward (Republic of South Africa, 2011).
The IRP2010 (hereon IRP) already recognises a reduction of electricity from coal. After the current coal power stations are constructed, which will add about 10 GW to the grid, only another 6.3 GW will be added until 2030. The reasons for limited coal growth may vary, but this paper will elaborate on some reasons why we believe this is a step in the right direction.
The IRP is generous towards renewable and sustainable electricity technologies (hereon 'renew-ables'). This includes 8.4 GW wind, 8.4 GW photovoltaic technologies (PV) and 2.6 GW of imported hydro. In addition, nuclear capacity dramatically increases by 9.6 GW. Both government and Eskom are committed to the nuclear expansion despite tougher regulatory, cost and public pressure. The primary argument is the need for a solid base-load for future electricity generation, and the IRP acknowledges the prioritization of nuclear over renewables for this reason (Republic of South Africa, 2011). Figure 1, derived from the IRP, illustrates how nuclear will aim to replace some coal, particularly in terms of energy supplied.
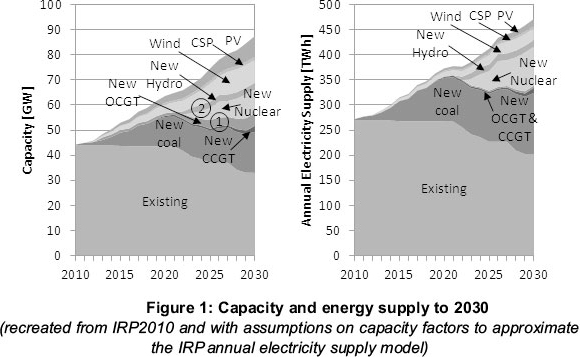
CSP is allocated 1.2 GW during the next 20 years. This capacity represents a little over 1.3% of the generating capacity in 2030 and less in terms of energy supplied. The other 17 GW of domestic renewables are intermittent by nature, and all three types have lower capacity factors that diminish their role when viewed in terms of energy supplied vs. capacity installed. The IRP recognises this and can be seen in the differences between the two plots in Figure 1.
What the IRP may not fully account for at this stage is the consequence of the lower capacity factors due to intermittency for wind and PV when they represent a significant portion of the total capacity. Both require potentially 100% backup capacity either in the form of alternative generation or storage. The cost and/or availability of storage options for these technologies are barriers in the South African context, at least at this point in time. It may be that imported hydro (indicator 2 in Figure 1) and significant open cycle gas turbine (OCGT) capacity (indicator 1 in Figure 1) offer this backup. The former appears significantly accounted for in energy supplied, and the IRP acknowledges the downside risk of hydro due to deployment risk and severe drought. The cost of running OCGTs is downplayed by a low capacity factor, but if these plants need to provide backup to both at-risk hydro and renewable intermittency, the almost negligible OCGT component on the right side of Figure 1 would grow and add considerable cost to energy supplied as these are linked to diesel and gas prices.
CSP offers a solution to the intermittency of renewables. We argue for a balanced mix of renew-ables when they form a significant portion of electricity production. Whereas CSP could theoretically supply 100% of South Africa's electricity, we acknowledge that this is unnecessary, costly and risky.
The methodology comprises primarily a survey and analysis of the alternatives available to South Africa during the next 20 years. A description of CSP looking at the state of the art and what this may mean in the local context will be presented.
2. Conventional and sustainable alternatives
We consider all major sources of energy practically available for electricity production in South Africa over the IRP period.
2.1 Coal
Coal has long been the staple of the South African energy supply. Although coal capacity will decrease to a lower fraction of the mix from about 2020, it still represents a large amount of the electricity supplied through 2030. The IRP is influenced by climate change mitigation goals, but it also recognises what it calls a "peak-oil-type" increase risk in fuel prices as a motivation to prioritize a large nuclear fleet that begins to replace coal (Republic of South Africa, 2011).
A number of recent international publications have looked at coal reserves worldwide and for Africa (mostly South Africa). The authors use Hubbert (1956) style forecasting which has proved reliable at predicting peak and ultimate production of oil in mature or depleted regions. Hubbert analysis uses historical production information fitted to a normal distribution curve or similar. If sufficient production has occurred, particularly at the point where the rate of production increase starts to wane, peak and ultimate production quantities and dates are predictable with higher accuracy than geological exploration estimates predict.
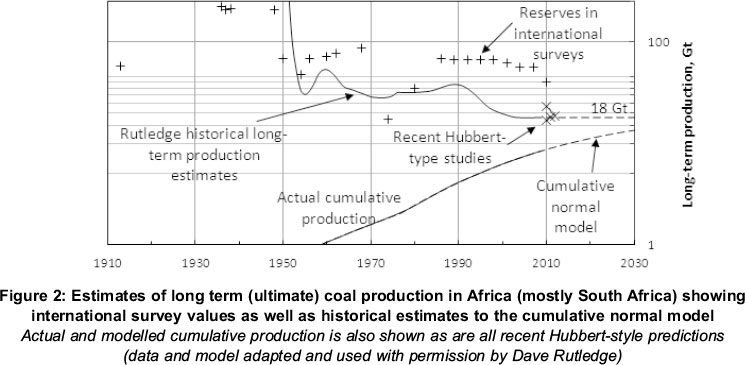
Rutledge (2011) developed a model that uses the better of a logistic or cumulative normal model for all coal regions and the world as a whole. Rutledge makes his data and models available to others, and the results have been re-processed in Figure 2. Patzek and Croft (2010) use a multi-Hubbert cycle analysis to determine a global coal production forecast. Mohr and Evans (2009) also perform Hubbert style analysis on world coal incorporating an iterative supply and demand method in an attempt to replicate real world conditions.
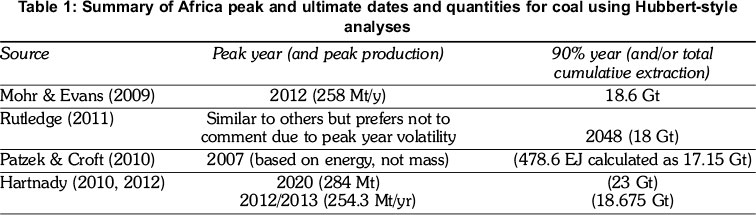
Locally, Hartnady (2010) has worked on a similar model and examines the (South) African coal resource question in detail. Hartnady (2012) has revised his estimate based on updated data from Rutledge (2011). All of the authors' current ultimate estimates are shown in Figure 2 indicated using symbol "x".
It should be noted that besides the actual and modelled cumulative production lines, all plot data refers to the ultimately recoverable resource estimated by surveys at a particular date or the result of the Rutledge model based on actual production data prior to a particular date. Peak production and year as well as 90% depletion date estimate and ultimate production quantity are summarised in Table 1.
When examining these models for exhausted coal or oil regions, there is little doubt that they more accurately predict peak and ultimate production than geological estimations do. These models show predictability when other regions can make up for demand, but it is not known how the models will behave for world production or production of later maturing regions as there may be no motivation to cease production of sub-economic resources. On the other hand, this hindsight model is indifferent to supply and demand mechanisms and even handles significant occurrences well such as war and cartel interference. In the event of approaching sub-economic resource levels, one would speculate that alternatives would by then have succeeded to enter the market, fulfilling the prophesy.
Unlike oil or uranium, coal markets tend to be regional with only 15% of world coal production exported (Rutledge, 2011). If there is any merit to the estimates, then while the world sits on peak oil, South Africa is simultaneously perched on peak coal. At peak, production is generally incapable of increasing to demand, and we begin to experience a significant change in price elasticity as reported recently for oil (Murray and King, 2012). Murray and King correlate price of oil to daily oil production and to demand, and are making the assertion that world oil is on peak, based on the data.
Hartnady (2012) suggests that the peak will not be a smooth curve just as all parts of the real production curve are bumpy. We are as likely to have years that exceed estimates as we are likely to have years that fall short around the peak itself. From as soon as late 2012 or 2013, we could experience a production dip that for the first time fails to meet demand.
Eskom consumed 124.7 Mt of coal to produce roughly 230 TWh of electricity in 2011 (Eskom, 2012). This represents about half of current coal production in South Africa. By 2030, the models suggest that the same coal consumption will represent about two thirds of production, yet the amount of electricity from coal is not below today's level between now and 2030.
The theme of this section is intentionally focused on reserves of conventional energy sources. Combustion of coal and other fossil resources leads to an increase in the level of CO2 in the atmosphere. This, in turn, leads to global warming by the greenhouse effect according to the consensus of climate scientists. This important debate as well as the true cost of climate change is far more established than a discussion on fossil resources and is therefore omitted from this paper. If the reported resource estimates are accurate, the world soon will be responding to a crisis of similar proportion without choice.
2.2 Uranium
We did not find similar models for uranium, and it seems that the decrease in new plant deployment worldwide since the 3 Mile Island incident and leading to the rapid economic growth in China has made it more difficult to make these estimates. Popular perception is that nuclear energy is carbon free and sustainable. While the former is mostly true, the latter is problematic. With conventional once-through nuclear technology, economically extractable fissile uranium turns out to be a far more limited resource than popularly believed.
Recent work by Knapp et al. (2010) looks at the potential for the remaining reserves of uranium to reduce carbon emissions by 2065. Knapp estimates that by using all remaining recoverable reserves by once-through technology, carbon emissions will reduce 39.6% by this year. The year 2065 has no significance to uranium and was only selected as a date for the analysis. Knapp does suggest that this gives some indicator of time to build sufficient safety into fast-breeder reactors to mitigate nuclear terrorism. If this is possible and notwithstanding the other long term and operational risks of nuclear power, fast breeder technology would be able to sustain the power needs of Earth for a very long time. Another alternative is the use of thorium as nuclear fuel which is more abundant then uranium. Thorium will require considerable R&D investment before it can be considered a cost-effective replacement to uranium (World Nuclear Association, 2011).
Dale (2012) recently reported a meta-analysis of all major non-renewable sources. The methodology he used was to perform statistical analysis on a large set of resource estimates he was able to obtain. Figure 3 is a re-creation of his results, and as would be expected in such work, the range on each type is large. Ranges are not shown for unconventional oil and gas due to insufficient estimates.
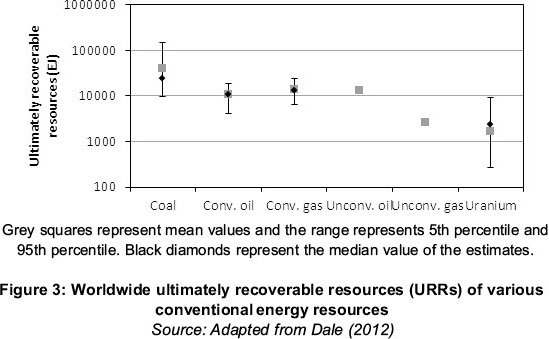
The purpose of showing this data was primarily to expose the fact that the upper estimates on fissile material are lower than the lower estimates on coal. Uranium has a worldwide market and South Africa will (and does) compete for new plants and fuel. The National Development Plan 2030 (National Planning Commission, 2012) urges a rethink on a potentially costly nuclear build, and Eskom has on several occasions been warning of the difficulty to meet IRP requirements to deploy 9.6 GW on time and within budget.
2.3 Other fossil sources
Figure 3 also illustrates best known estimates on unconventional fossil energy sources. Murray and King (2012) state that the oil sands of Canada and Venezuela will peak at around 6.7 million barrels per day, well short of daily needs. Shale gas seems to be an immense resource both worldwide and in South Africa. Besides evidence of environmental harm caused by hydraulic fracturing, recent reports suggest that these gas wells experience rapid annual declines and become sub-economic within a few years (Murray and King, 2012). Shale gas exploration is being planned for South Africa in the region shown in Figure 4. This map also shows the best solar resource region of South Africa. The potential gas reserves on the east coast of Africa could also be considerable (Brownfield et al., 2012) and these sources need to be tracked closely as alternatives to coal or nuclear in the future.

2.4 Other renewable and sustainable sources
Referring to Figure 1, we have discussed the resources that impact all current (and majority to 2030) generating capacity. The remaining sources in South Africa's IRP are hydro, solar and wind. We will only peripherally cover these here to provide context to CSP.
South Africa is largely dependent on new hydro imports for the hydro component, and these contain risk of project completion and drought (IRP2010, 2011). In general, hydro power is an excellent source of electricity if available and is capable of base-load electricity.
PV technology is well established at small distributed scale in many countries. There are larger PV plants operating or under construction, but these plants can experience sudden production changes with weather. No utility-scale electricity storage technologies exist at this time to moderate supply. We strongly support PV as a vital component in the future supply of electricity in South Africa due to the cost advantages of this technology and the ability to generate clean energy. We assume for simplicity that the potential for PV in South Africa is similar for that of CSP at a capacity factor of 0.2 based on the IRP This amounts to over 800 TWh for the same assumptions as made by Fluri for CSP potential (Fluri, 2009). This exceeds the total energy needs of South Africa in 2030, but with intermittent supply.
Wind energy experiences similar intermittency, and as electricity is produced immediately, the lack of large scale storage again prevents supply moderation. A capacity factor of 30% is considered good for wind. A recent report by Young (2011) provides statistics of UK wind production. This report breaks many assertions of wind potential including the ability for wind to generate reliably in a distributed system as well as its potential to support pumped energy storage systems with sufficient capacity for low wind times. As with PV and despite the drawbacks, we believe that wind will play an important role in South Africa's future. Hagemann (2008) produced a detailed mesoscale wind atlas of South Africa. He determined a realistic wind potential of South Africa to be just over 80 TWh at a capacity factor of 30% with high sensitivity to capacity factor.
3. CSP technology for South Africa 3.1 Solar and other resources
South Africa benefits from one of the best solar resources worldwide. The majority of the country receives annual DNI values in excess of 2 100 kW/m2/year (representing good Spanish conditions) and parts of the Northern Cape reach 3,000 kW/m2/year (GeoModel Solar, 2012). Fluri (2009) and Meyer and van Niekerk (2011) show short to long term viable suitable land for CSP, and even the most constrained short-term suitable sites show potential of more than 500 GW.
The key constraints for CSP at suitable sites are water and transmission limits. South Africa is a water stressed country and suitable regions are particularly dry. With low density populations and little significant economic activity, suitable regions also currently have limited capacity to remove electricity.
3.2 CSP technology summary
In order to assess the value of CSP, we briefly look at the anatomy of a CSP plant. Four primary CSP plant types exist, with the parabolic trough type as the most mature and bankable. Two different departures to the parabolic trough are the central receiver type, as shown in Figure 5, and the linear Fresnel type, which is similar to the parabolic trough. Both of these alternatives offer the potential for further cost reduction. The 4th type is the parabolic dish concept which potentially has the highest efficiency but remains commercially unproven (International Energy Agency (IEA), 2010). For the remainder of this discussion we will focus on the central receiver type.
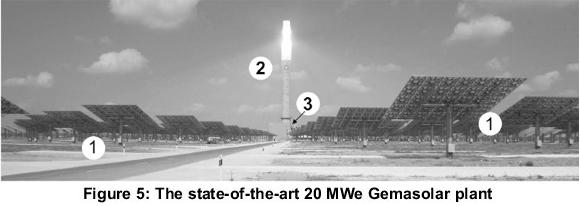
The 20 MWe Gemasolar CSP plant by Torresol Energy, shown in Figure 5, represents the state-of-the-art for CSP technology due in part to its record breaking 15 hour storage system. Marker 1 shows part of the heliostat field which covers 195 Ha of land and is by far the most extensive part of the plant. The heliostat field is made up of steel structures, glass mirrors, motors, gearing and control systems representing roughly a third of the cost of the plant.
Marker 2 shows the tower with its 120 MWt molten salt receiver near the top. In this image, the receiver is fully operational as evidenced by the brightness of the receiver and the concentrated rays of sunlight incident to the receiver. The receiver, tower and heliostat are collectively termed the collector system, representing about half the cost of the plant. This tower is constructed of concrete, but lattice steel structures are also used for similar plants. Marker 3 points to the location of the rest of the plant which forms an island with the surrounding heliostat field. A traditional steam turbine with wet cooling system is coupled to a large two-tank molten salt storage system via heat exchangers.
Wet cooling was used due to the availability of water. This plant's operating temperature is limited to the turbine rating of 565°C, making its thermo-dynamic efficiency and water use similar to conventional coal power. Due to this operating temperature, the plant is capable of dry cooling with similar cost and efficiency implications compared to the existing dry cooled plants in South Africa. This is an important development in CSP due to the water scarcity particularly in the regions identified for this technology.
The relatively small turbine at 20 MWe is capable of a relatively fast start-up, which makes the plant ideal to offer dispatch power, and thus its usage can be considered similar to that of a peaking station. Other central receiver plants currently under construction have turbines ranging in size up to 200 MWe (NREL, 2012).
The Gemasolar plant is only the 4th commercially operating central receiver plant worldwide, but has already demonstrated full load power 24 hours per day in its first summer. The plant operators expect it to run continuously at full load for most of the summer (Torresol Energy, 2011).
The central receiver type is just entering the growth phase of the technology life-cycle and as such offers great scope for technical and cost improvements. In particular, the central receiver should be capable of achieving much higher temperatures which will lead to the following benefits:
- Combined cycle plants with very high efficiency, thus smaller heliostat fields
- Efficient dry cooling
- Greater storage capacity due to increased efficiency
- Inline hybridization to provide efficient auxiliary capability
CSP plants will increasingly be capable of dispatching electricity based on demand and in a distributed network of plants; reliance on auxiliary fuels should reduce as illustrated by Gauché et al. (2012).
The cost target of electricity from large coal plants is in the region of $0.06 per KWh. CSP costs are currently in the low $0.20 per kWh range and are benefiting from a learning rate typical of developing technologies. Adding dispatchability (storage) to a CSP plant is not necessarily a cost adder since turbine size is exchanged for storage capacity. Where storage systems can be cost reduced locally, the cost of CSP as a whole can be reduced while boosting capacity factors.
A last note on the auxiliary capability of CSP relates to Figure 4 where overlap between the proposed prospecting sites for shale gas and sunny regions is shown. In the event that shale gas is discovered and exploited, CSP offers the opportunity to limit the consumption of this energy source if hybridised CSP were to be used for power generation.
3.3 Propositions regarding CSP in South Africa
CSP is untried in South Africa, however, it is quite well proven in the USA where 9 CSP plants, called Solar Energy Generating Systems (SEGS), were constructed from the mid to late 1980s. All of these plants are still operating, illustrating lifecycle competence, and have provided invaluable learning for the current generation of plants. Spain and the USA compete for deployed CSP capacity. Worldwide, capacity exceeded 1 GW in 2011.
Based on the alternatives presented, the following list of propositions is being put forward:
- CSP is the ideal sustainable and dispatchable power method for South Africa in the longer term when fossil fuels approach depletion. Although the cost of CSP needs to drop before wider adoption can occur, system wide costing needs to account for the dispatch capability which compliments other generation types.
- CSP components, skills and operation risks are a good match for the resources, skills and infrastructure of South Africa.
- South Africa has a relatively short period of time to adapt to and benefit from a large scale rollout of CSP The cost of the rollout will be a significant portion of GDP, but it presents an equivalent opportunity should the country adapt and embrace the technology. The variable nature of the energy source makes CSP design and operation more complicated. On the other hand, the technology is relatively safe compared with other existing and future dispatchable energy sources. South Africa will benefit by taking appropriate small steps towards building capacity and industry regardless of the scale plans of international technology providers. As such, it is vitally important that there be a national effort to construct smaller scale pilot plants and research facilities in order to maximise the opportunity.
- The key CSP type for utility power generation in the longer run will be scalable point focus types. At this time, this is represented by the central receiver plant type. Although more complicated, this type will be more efficient (land area and cost) and it will consume significantly less water.
- CSP types that are less complicated to construct and operate will remain appropriate in the longer term for a variety of applications including on and off grid community power and heat, pre-heat augmentation to utility power plants as well as process heat.
- CSP technology in combination with a good solar resource is suited to a distributed power generation model, which could have many benefits including lower transmission risks and increased local value.
4. Analysis and discussion of alternatives
We cannot validate any propositions or statements in this paper, particularly about future events. Instead, we offer a synthesis of the aforementioned alternatives for future South African power production capacity.
4.1 CSP Industry and stakeholder positions
The first significant dedicated market conference for CSP in South Africa was recently concluded called CSPToday South Africa 2012. As a sign of the market potential, the conference attracted almost all key worldwide industry participants. An industry body cannot of course be trusted on merit, but it is worth noting industry priorities and positioning with respect to South African needs. Key feedback included:
- The value of CSP is in dispatchability, and in the long run it is complimentary - not competitive -to PV or wind.
- CSP in Spain needed no localization incentive. The need for extensive collector material and the nature of components automatically drove localization. This should be particularly true for South Africa with the greater distances for importing large quantities of materials.
- CSP does not offer significant operating and maintenance (O&M) employment. It is the construction of the plants that brings significant employment.
- Parabolic trough technology is bankable, and South Africa should construct these plant types and learn from them before investing heavily in central receiver plants.
4.2 Quantifying and rating the alternatives
Several criteria can be used to measure the alternatives available to South Africa for the period between now and 2030. The list could include: Resource size, demand matching, cost, learning rate, technology risk, resource availability risk, national security risk, environmental risk, localization potential, local participation, industrialization and export potential. These should be explored in detail, but for this study we present an analysis of three:
- Resource size
- Localization potential
- Demand matching
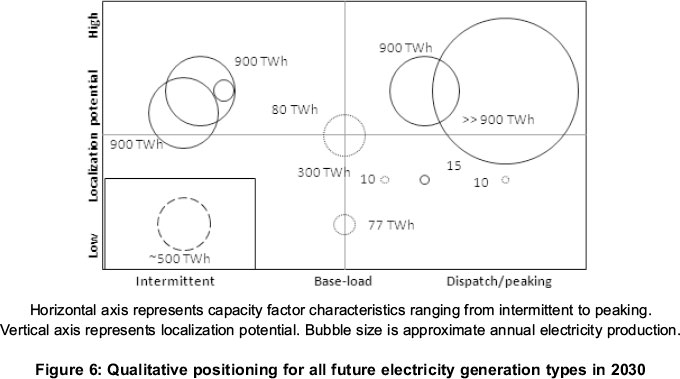
The result can be represented using a bubble plot where bubble areas represent resource size and the other two parameters are qualitatively judged on the horizontal and vertical axes. Figure 6 shows this plot for the 2030 timeframe. Conventionals are shown, constrained to the IRP allocation assuming all prior arguments justify this to be the upper bound. Renewables are shown constrained only by short term (20 year) infrastructure limitations except where otherwise indicated.
Coal as a resource is sized to the IRP, which is marginally larger than the current capacity. Coal provides a solid base-load supply through efficient, reliable, large utility plants. The localization potential for coal has been established and mainly exists on the periphery of the plant capital cost and the full extent of fuel and operations. It thus positions in the centre of the plot at about 300 TWh per year.
Nuclear, combined cycle gas turbines (CCGT), hydro and OCGT are IRP sized, assuming that they are constrained by cost, resource, safety or foreign reliance. All of these offer moderately poor to poor localization potential. Hydro would offer local potential had the resource existed locally. All of these sources offer reliable electricity supply for base-load or dispatch. The items in the "shrinking conventionals" bubble all represent conventional energy resources that were previously described as peaking and at risk of depletion far sooner than previously forecasted.
PV offers huge potential and is better at localization than the conventional types for construction and operations, but PV cells and perhaps large inverters may be sourced more economically from abroad. We did not include the full potential for PV in the future due to uncertainty of utility scale electrical storage or legislation for household/commercial feed-in policy. Wind is similarly positioned s slightly higher localization potential and intermitten-cy that may improve with a distributed system. This resource is far more limited but is an important independent energy source. CSP without storage offers similar localization to PV and wind. It offers a slight advantage over PV from the intermittency point of view due to thermal inertia of plants, which allows for brief solar irradiation interruptions. CSP with storage swings it to the dispatch side of the plot due to the ability of fast start-up and efficient thermal storage systems. The potential of CSP continues to grow in the future since the technology offers electricity production potential, localization and dispatch as the rollout grows and the transmission system is in place.
When drawn in this way, two additional observations can be made:
- While there does not seem to be a shortage of energy sources, the future electricity supply system appears vulnerable to meeting demand. With the current focus of the IRP towards risk avoidance in the short to medium term, the alternatives to base-load and peaking mostly fit in the shrinking substitute group with some reliance on imported hydro. This suggests that the risk mitigation is paradoxical in the event that forecasts discussed in this work are accurate.
- CSP appears to be the ultimate solution. While the technology is a contender for post-fossil energy supply, cost and maturity are limitations now. In particular, although a system of CSP plants could be deployed to be reasonably certain of supplying all energy needs, the cost would be considerable (Gauché et al., 2012). A cost optimal energy system with similar certainty would probably comprise all three renewable types in similar proportion.
5. Conclusion
South Africa is embarking on an electricity generation transition to reduce reliance on coal. Coal is still viewed as a considerable resource, but recognition is given to CO2 emissions and the risk associated with resource prices inflating in peak fossil scenarios.
For this reason, the IRP generously mandates a significant portion of future capacity for renewables, but it prioritises a significant nuclear program to reduce risk. The renewable mix has a high degree of intermittency and less than 1% of produced electricity is CSP by 2030.
A significant portion of capacity in 2030 will come from plants yet to be constructed. We argue that when you consider the degree of localization potential in renewables compared with nuclear as well as the potential to produce to demand, a better short and long term picture is presented, and the country moves to a sustainable path sooner.
Adding recent updates to world and South African supplies of fossil and fissile sources, it appears that immediate action is required and a more drastic turn to renewables is essential. The analysis in this paper suggests that continued reliance on coal together with the choice of nuclear to provide a most stable baseload option could be a paradoxical choice. The environmental risks of the nuclear option are put aside here due to the ad-hoc nature of catastrophic events now and the inability to agree on the long term consequence of nuclear power. What is more tangible from this analysis is the prospect of energy uncertainty in an age of supply limited conventional energy sources. A scenario can be imagined where significant plant capital investments are made and followed by unstable and escalating energy prices without guarantee of delivery. A later switch to renewables will take time and will be more economically challenging if existing conventional plants need to be written off or continue running at high cost.
In any scenario where we decide to prioritise renewables or where we have no choice, this basic analysis shows significant risk for both baseload and dispatch or peaking energy supplies. Assuming that the storage potential offered by CSP will remain the most efficient and economical storage for utility scale power generation, an optimal mix of CSP with other renewables will be essential.
Acknowledgements
The authors would like to acknowledge the support of the Solar Thermal Energy Research Group (STERG) at Stellenbosch University and sponsorship by Sasol Technologies for making this work possible. We also thank Dave Rutledge for making his data and models on coal available and Chris Hartnady for providing updates to his analysis on the coal question.
References
Brownfield, M.E., Schenk, C.J., Charpentier, R.R., Klett, T.R., Cook, T.A., Pollastro, R.M., and Tennyson, M.E., (2012). Assessment of undiscovered oil and gas resources of four East Africa Geologic Provinces: U.S. Geological Survey Fact Sheet 2012-3039, 4 p. [ Links ]
Creamer, T., (2011). Surging tariffs and interest bill, but also signs of greater stability at Eskom, Engineering news online, Creamer media, www.engineer-ingnews.co.za/article/eskoms-interest-bill-surging-but-funding-plan-advanced-2011-07-08, accessed 15 July 2011. [ Links ]
Dale, M., (2012). Meta-analysis of non-renewable energy resource estimates, Energy Policy, 43: 102-122. [ Links ]
Eskom, (2012). Environmental footprint, http://www.eskomfactor.co.za/eskom-factor-environmental.php, accessed 27 February 2012. [ Links ]
Fluri, T.P., (2009). The potential of concentrating solar power in South Africa, Energy Policy, 37(12): 50755080. [ Links ]
Gauché, P, Pfenninger, S., Meyer, A.J., von Backström, T.W., Brent, A.C., (2012). Modelling dispatchability potential of CSP in South Africa, SASEC 2012, May 2012. [ Links ]
Hagemann. K., (2008). Mesoscale wind atlas of South Africa, PhD thesis, Department of Environmental and Geographical Science, University of Cape Town. [ Links ]
Hartnady, C.J.H., 2010. South Africa's diminishing coal reserves, South African Journal of Science, 106(9/10): #369. [ Links ]
Hartnady, C.J.H., (2012). Personal communication, 21 February 2012. [ Links ]
Heun, M.K., van Niekerk, J.L., Swilling, M., Meyer, A.J., Brent, A., & Fluri, T.P, (2010). Learnable lessons on sustainability from the provision of electricity in South Africa, Proceedings of ASME 2010 4th International Conference on Energy Sustainability, ES2010, Phoenix, Arizona, USA. [ Links ]
Hubbert, M.K., (1956). Nuclear energy and the fossil fuels. Drilling and production practice, 7-25, Houston, TX: American Petroleum Institute, accessed from http://www.hubbertpeak.com/hubbert/1956/1956.pdf. [ Links ]
International Energy Agency (IEA), (2010). Technology Roadmap: Concentrating Solar Power, EIA, 2010. [ Links ]
Knapp, V., Pevec, D., Matijevic, M., (2010). The potential of fission nuclear power in resolving global climate change under the constraints of nuclear fuel resources and once-through fuel cycles, Energy Policy, 38(11): 6793-6803. [ Links ]
Meyer, A.J., van Niekerk, J.L., (2011). Road map for the deployment of concentrating solar power in South Africa, SolarPACES Conference, Concentrating Solar Power and Chemical Energy Systems, Granada, Spain, 20-23 September 2011. [ Links ]
Mohr, S.H., & Evans, G.M., (2009). Forecasting coal production until 2100, Fuel, 88: 2059-2067. [ Links ]
Murray, J. and King, D., (2012). Oil's tipping point has passed, Nature, 481: 433-435. [ Links ]
National Planning Commission, (2012). National development plan 2030: our future-make it work, Dept. of the Presidency, Republic of South Africa, http://www.info.gov.za/view/DownloadFileAction?id=172297, accessed 23 August 2012. [ Links ]
National Renewable Energy Laboratory (NREL), (2011). Gemasolar Thermosolar Plant project overview, NREL/SolarPACES, http://www.nrel.gov/csp/solarpaces/project_detail.cfm/projectID=40, accessed 18 February 2012. [ Links ]
National Renewable Energy Laboratory (NREL), (2012), Power Tower Projects, http://www.nrel.gov/csp/solarpaces/power_tower.cfm, accessed 28 August 2012. [ Links ]
Patzek, T.W., & Croft, G.D., (2010). A global coal production forecast with multi-Hubbert cycle analysis, Energy, 35: 3109-3122. [ Links ]
Republic of South Africa, (2011). Integrated Resource Plan for Electricity 2010-2030, Government Gazette, 6 May, 2011. [ Links ]
Rutledge, D., (2011). Estimating long-term world coal production with logit and probit transforms, International Journal of Coal Geology, 85: 23-33. [ Links ]
Torresol Energy, (2011). Gemasolar solar power plant reaches 24 hours of uninterrupted production, Company website, www.torresolenergy.com/TOR-RESOL/NewsTS/gemasolar-solar-power-plant-reach-es-24-hours-of-uninterrupted-production, accessed 16 July 2011. [ Links ]
GeoModel Solar, (2012). SolarGIS iMaps online paid access to high-resolution solar data, http://solargis.info/imaps/ 29 August 2012. [ Links ]
World Nuclear Association, (2011). Thorium. World Nuclear Association information site, http://www.world-nuclear.org/info/inf62.html, accessed 29 February 2012. [ Links ]
Young, S., (2011). Analysis of UK wind power generation: November 2008 to December 2010, John Muir Trust, March 2011. [ Links ]

