


Services on Demand
Article
 English (pdf)
 Article in xml format
 Article references
Indicators

Related links
-
 Cited by Google
 -
 Similars in Google
Share

 Permalink
Journal of Energy in Southern Africa
On-line version ISSN 2413-3051
Print version ISSN 1021-447X
J. energy South. Afr. vol.24 n.1 Cape Town Jan. 2013
Load-shifting opportunities for typical cement plants
Raine T Lidbetter; Leon Liebenberg
Centre for Research and Continuing Engineering Development, North-West University (Pretoria campus)
ABSTRACT
Investigations into demand side reductions have been encouraged by the South African electricity utility, Eskom, in sectors with high electricity consumption, such as the cement industry. The South African cement industry is responsible for 5% of the electrical consumption for the mining and industrial sector. It has also been estimated that by 2020 this sector will be ranked fifth for energy savings potential. This paper investigates the potential of a load-shifting (altering energy use method) scheme to reduce evening peak loads and save electrical costs on a raw mill at a South African cement plant. A spread sheet-simulation was performed, which showed that six hours of load-shifting could be achieved, without adversely affecting production. This was corroborated by a pilot study where the load was successfully shifted for six hours over a week-long period. The specific raw mill would achieve a reduction in yearly electrical costs of 2% when employing this load-shifting strategy. The results, however, showed that cost-saving opportunities are highly dependent on the reliability of the mills and on the change in production demand. Therefore, load-shifting schemes have to be flexible on a daily basis to shift load whenever possible.
Keywords: load-shift, demand-side management, cement plant, raw mill
1. Introduction
Time-of-use (ToU) pricing structures were implemented by South African electricity utility Eskom as one of the important approaches of demand-side management (DSM). Their purpose was to persuade, especially large industrial consumers, such as cement manufacturing plants, to shift their electrical loads by means of a ToU tariff which is sectioned into time of day (viz. peak, standard, and off-peak periods) and season (viz. summer, winter), (Middelberg et al., 2009; Hu et al., 2010). The ToU tariffs (1 April 2010-31 March 2011) during the summer are in c/kWh; 38.73 - peak, 23.74 - standard, 16.61 - off-peak, and during the winter are; 138.56 - peak, 36.05 -standard, 19.29 - off-peak as can be seen in Figure 1.
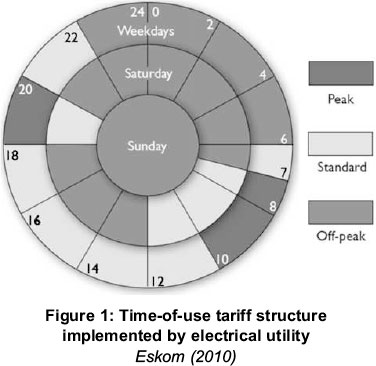
Load-shifting implies that the specific load should be scheduled in such a way that it is diverted from the expensive peak periods (18:00 - 20:00) to the cheaper off-peak periods. Under the load-shifting method, electric power to all loads is always available, but the delivery rate may vary with ToU, (Ashok and Banerjee, 2003).
The kind of loads most frequently used with load-shifting procedures are those which deliver energy services whose quality is not substantially affected by supply interruptions of short duration (Middelberg et al., 2009; Jorge et al., 2000). With cement plants, such typical loads are those associated with some form of raw meal storage.
The South African cement industry, which is presently accountable for 0.57% of the World's cement production (PCA, 2010), produces only Portland cement (Tatum, 2010). In a typical Portland cement plant, electricity accounts for 13% of all energy inputs but is responsible for almost 50% of the total energy costs (NRC, 2009; Fawkes, 2005; Hasanbeigiet al.; 2010; Price et al.; 2009; Sirchis, 1989).
The major portion of the electrical demand is taken by machine driven processes (KEMA, 2005; NDRC, 2006). Should it be possible to implement a demand-side management (DSM) program to the motors in these processes, it would provide great savings to the total electrical consumption of a plant (Madlool et al., 2011; Choate, 2003; Hughes et al., 2006; Worrell et al., 2008; Worrell et al., 2005; Worrell et al., 2000; Gomes et al., 2004).
As in many non-metallic materials processing, the kiln is the slowest process of the cement manufacturing procedure. Therefore, the possibility exists to shift the electric motors' load before and after the kiln into periods of lower electrical tariffs. This would reduce peak-time energy purchase and therefore reduce costs.
The identification and selection of a suitable power curtailment strategy is a complex task, considering the multiple, incommensurate, and potentially conflicting objectives. These objectives might include the minimizing of maximum power demand, maximizing profits, minimizing losses, and minimizing adverse effects to the customer (Gomes et al., 2004). The selection of adequate load-shifting actions to be implemented over sets of loads, grouped according to some criteria, is therefore a multi-objective optimization problem.
This paper describes the cost-saving potential of performing load-shifting on a raw mill at a large South African cement plant. A spreadsheet-simulation was performed to find an optimal control strategy, the findings of which were corroborated by a pilot study.
2. Load-shifting opportunities at a typical South African cement plant
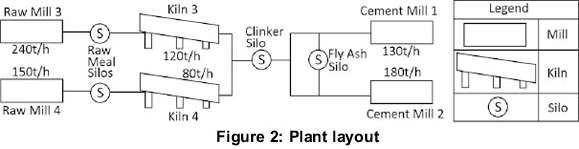
The South African cement plant which was investigated for load-shifting opportunities had two production lines in operation at the time of the study. Figure 2 illustrates the layout of these production lines. The clinker production lines run in parallel and are joined at the clinker silo. Thereafter, clinker and fly ash are fed into two adjacent cement mills.
There is significant potential in realizing electrical cost savings by implementing energy management, as proven in a benchmarking study of Canadian cement plants (NRC, 2009). Four of the five plants that were rated highest in energy management potential were also ranked the highest in cost savings and energy efficiencies initiatives. Although the energy management had no impact on changing their energy efficiency rating, the plants benefited greatly from such a program and were able to improve cost savings.
Load-shifting opportunities can be found in the layout of the plant and the flow rates of the equipment. The flow rates of the raw mills, cement mills and kilns can be seen in Figure 2. These were determined by averaging a daily record of the equipment performance over a period of three months, 1 May to 31 July 2010.
The rates of the mills are much higher than those of the kilns. Therefore, the kiln, which operates 24 hours a day, determines the maximum production rate of the plant. It is possible to use the silos as a buffer to store enough material while shifting the load of the mills. The mill motors can be shut down and started up again within minutes, allowing for a dynamic operating plan (Paulus and Borggrefe, 2011).
A strategy could be adopted to shut down the mills during the hours of the day where Eskom charges higher tariffs and restarting in periods of lower charges to achieve energy cost savings. This differs from the standard practise of shutting them down only when the silos have reached their maximum capacities regardless of tariffs.
The load-shifting scheme does not contribute towards energy efficiency as the total electrical usage for the day remains the same. Although less electricity is used during peak periods, more is used during off-peak periods, thereby giving the associated name of load-shift.
The number of hours for shutdown may be limited however, as production is dependent on upstream and downstream processes. The raw meal silo will have to be filled to a level where it can provide a continuous feed into the kiln while the raw mill is turned off. The clinker silo can be allowed to fill with clinker even though the cement mills might not be running. The mills can then be operated during off-peak periods to replenish the raw material and extract clinker. Relying on storage capacities may bring production near to its technical limits (Paulus and Borggrefe, 2011). However, the downtime can be planned to keep silo levels within their minimum and maximum capacities.
The scope of the load-shifting investigation does not include the coal mills of the plant. Although the coal mills have a higher flow rate than is required by the kiln, and a hopper is available as a material buffer, it is preferred not to shut down the coal mills. The hot waste gases from the kiln are drawn through the coal mill to, first, dry out the coal, and second, heat up the pulverised coal that flows into the kiln for combustion. As the air is circulated, it draws with it large amounts of coal dust from the mill which form part of the coal volume that is ignited. If the coal mill is stopped, then less coal dust is used and the coal hopper feed has to increase. Storage levels will then be depleted at a higher rate. Because of this, cement plant managers prefer not to load-shift coal mills (Human, 2010).
Another concern has been raised about controlling the temperature of the cement mills during load-shifting programs. If milling temperature is too low, a change in chemical processes can cause the cement to gain properties of "flash set" - an irreversible stiffening of cement mix (Human, 2010). Therefore, when shutting down the mill during peak periods, the mill may cool to an undesirable temperature and affect the quality of the cement. However, the setting quality of the cement can be accommodated. Unfortunately, the extra inconvenience results in managers of cement plants being less inclined to condone cement mill load-shifting (Maltese et al. 2007).
3. Baselines
A power consumption baseline is used to calculate how equipment is operated over a 24-hour period. Average electrical consumption per hour can be plotted to establish a usage profile. This provides insight into how many times the motor is used and for what time period. If the profile shows that the motor operates nearly continuously for 24 hours, there will be no opportunity to load-shift. However, if the motor is operated intermittently and reliably throughout the day, there is good potential for load-shifting.
The focus of the investigation was on Raw Mill #3 (RM3), due to its availability for a load-shifting pilot study. Operational data for the mill was obtained for a period of three months, from 1 May to 31 July 2010. The month of May falls under Eskom's "summer tariff", whereas June and July are in the "winter tariff" period. By including both seasons, a level of conservatism with respect to the seasonal change is maintained for the study.
The DSM program is primarily concerned with the demand profile during weekdays. Therefore, weekends and public holidays were removed from the data collection to create the mill motor baselines. Stoppage records for each mill over the three-month time period were examined to eliminate data which could unrealistically lower the electrical load profile of the motor. For example, if Raw Mill #3 was shut down for a prolonged period of time due to kiln stoppage, the data would not reflect the standard usage of that mill. After removal of this data from the SCADA records, Raw Mill #3 had 46 operational days between 1 May and 31 July, with a nominal operating capacity of 4 MW.
The baseline for Raw Mill #3 was calculated using the method of stoppage records. By averaging the number of times the mill was operated during each hour, a percentage usage throughout the day was calculated. If the percentages are multiplied by the operating capacity of the motor, a power consumption baseline is produced.
Figure 3 shows the baseline for RM3's electrical motor. It shows a maximum deviation of 30%, indicating limited load shifting activities. However, no effort was previously made to optimally shift load during the evening peak period between 18:00 and 20:00 or the morning peak between 07:00 and 10:00.
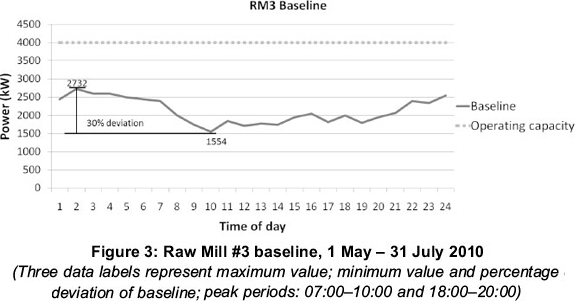
The baseline does, however, indicate that there is opportunity for improvements in the operating strategy of the mills. The production during this time can most likely be shifted to off-peak periods between 22:00 and 5:00. The baseline further shows that on average, Raw Mill #3 is used 72% of the time. This again gives a good indication that there is opportunity to apply a load-shifting strategy.
It is possible to use the historical baseline of a motor to establish a new "optimised" profile that involves a load-shifting schedule. This would indicate how the consumption could change. The main variable in a load-shifting scheme is the amount of hours that can be shifted. The factors that influence the operation of the mills are used to calculate how many hours are available. These include plant layout, flow rates, silo capacity, planned maintenance, motor operating capacity, percentage use of fly ash, equipment reliability (incident hours), regulations of DSM load-shifting, and weekend operating hours. The flow rate and reliability are variable factors and can change over time.
A simulation can be used to create different scenarios of these variable factors and calculate how many hours are available for load-shifting.
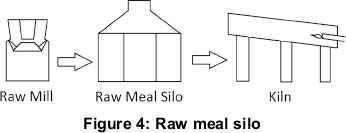
4. Silo simulation
Figure 4 illustrates the equipment involved in the raw meal silo simulation. The operating hours (OH) of the raw mill is the dominant variable that influences the change in silo level. This is because it determines the amount of material flowing into and out of the silo. The changes in silo level may be calculated by multiplying the flow rates of equipment with the operating hours of the day:
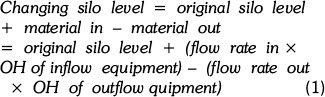
The major constraint for the simulation is that the silo level has to stay within the capacity range for a specified duration of time. The range is defined as the array between maximum silo capacity and minimum silo capacity. The spread sheet-simulation calculates available shut-down time of equipment for 31 days. Since the kiln needs to operate 24 hours a day, the simulation calculates how many hours are available for load-shifting Raw Mill #3 without the raw meal silo reducing beyond minimum capacity.
The simulation takes into account the reliability factor of the mills by subtracting incident hours from the daily OH. Incident hours are dependent on the reliability of not only the mills, but also the auxiliary equipment and the equipment of upstream and downstream processes. The incident hours used in the daily OH calculation differ on a daily basis due to the simulation program that randomly generates numbers per day which are within a specific range around the historical average.
This range is determined from the standard deviation of the historical incident hours. For the plant under investigation, a range of 30% was used. (The standard deviation of the incident hours in the historic data was equal to 27% and was rounded up for conservatism.)
The chances of the simulation providing unrealistic results are reduced by influencing the daily OH with changing incident hours. Then the probability of the silo level leaving the capacity range can be calculated. OH is further affected by planned stoppages for the maintenance of equipment. Planned maintenance occurs on a regular basis and can be included in the simulation as a constant parameter.
The spreadsheet-simulation keeps track of times and dates to take any planned stoppages into account. The OH on a day of maintenance would be calculated as 24 hours minus the incident hours, load-shifting and maintenance hours:
![]()
The simulation can vary the load-shifting hours of the Raw Mill to alter the OH. This will result in predicting how silo levels will change as incident hours vary. Because of the large increments between full-load-shifting hours, the change in the simulation from one amount to another is significant. It can therefore be easily seen whether the mill load can be shifted, for example, two or three hours. This is while taking into consideration the present production and performance. The maximum available load-shifting hours are later used for calculating an optimized profile.
Figure 5 shows the relevant calculations of the simulation and the resulting silo level graph over a period of one month. As can be seen, the level is not adversely affected by 6 hours of load-shifting per day with that particular set of randomly generated incident hours per day. If the simulation is run a number of times, the probability of an adverse effect can be calculated.
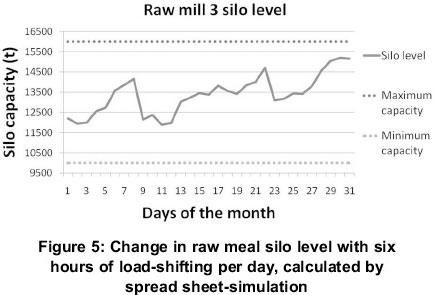
The simulation was run 100 times, with different, randomly generated incident hours. The number of times the silo level ends with a higher value than at the start, is recorded. This gives the probability of a positive effect on the silo levels. With 6 hours of load-shifting on Raw Mill #3, the probability of a positive effect was 73%. If the number of load-shifting hours is increased to 7, the probability of a positive effect drops to 38%. This indicates that no more than 6 hours of load-shifting are available for Raw Mill #3 without a high probability of a cumulative adverse effect on silo levels.
5. Electrical consumption profile
With the available load-shifting hours having been established, it is necessary to determine whether the mill motor would be able to achieve the load-shift and how it would affect the electrical consumption profile. These available hours may be restricted by DSM load-shifting regulations. The original profile of the mills may not increase during Eskom's standard time. Therefore, the load-shifting hours have to be taken up entirely during off-peak periods.
This is limited by the operating capacity of the mill motor, as it is sometimes not possible to maintain production solely during the off-peak periods. The degree to which the available hours are limited can be determined by optimizing usage profiles to remain below operating capacity.
Another spreadsheet-simulation is used to determine the best possible load-shifting strategy without exceeding motor installed capacity or raising the standard time usage. The simulation calculates an updated profile for the preceding 31-day range. This will determine how present performance compares to the original baseline.
If the standard time values of the updated profile are not above the original values, load may be shifted from peak periods. If not, an amount of load-shifting would also have to occur during standard time for the following days to lower the profile.
The new profile must have the same total area under the curve (AUC). The AUC indicates how often the mill motors are run and therefore, indicative of the mill's production. If the AUC is lowered, the production will be adversely affected.
The new profile consists of the original baseline with two changes:
1. A number of peak period hours are equated to zero. These are the load-shifted hours. The maximum number of hours is calculated by the previous silo simulations;
2. The off-peak usage is increased to ensure the AUC is not reduced during the load-shifting scheme.
If the off-peak values are higher than the operating capacity of the mill motors, then the consumption profile is not achievable and less load-shifting hours need to be implemented. The new off-peak power consumption should be marginally, say 2%, lower than the operating capacity of the motor to allow for unplanned breakages. With a 2% margin, an extra 14.4 hours per month of unplanned breakages can occur during off-peak periods without affecting production. With this logic an optimized profile was developed.
Figure 6 presents the achievable load-shifting scheme for the mills calculated from the usage simulation. The profiles of Raw Mill #3 illustrate how only two hours of load-shifting are possible without changing standard time usage or exceeding the operating capacity of 4 MW.
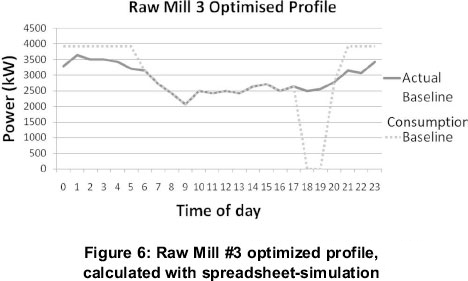
The areas under the curve for both profiles are equal, indicating that production is not affected. The extra hours available for load-shifting will likely be taken up by unplanned stoppages due to overfull silo levels during standard and off-peak periods. This can also be implemented during morning peak periods but have to be planned on a daily basis with respect to actual baseline, occurring incidents and silo levels of that day.
6. Cost savings potential
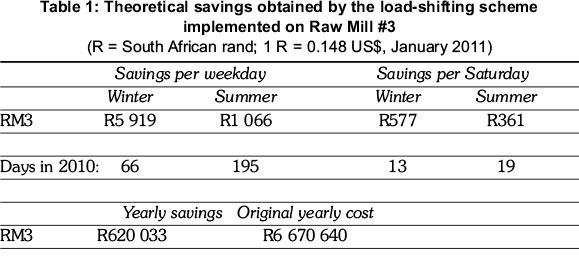
It is now possible to determine the savings potential of such a load-shifting scheme, and this is shown in Table 1. The theoretical results show that significant savings can be achieved with the present reliability and production of the plant.
Orans et al. (2010) suggests a method for calculating energy efficiency and load-shift cost savings taking a weighted average of the tariffs into account and the significance of reducing the peak period. The weighted average tariff charges are often used by industry to gain a general perspective of electrical costs. This therefore will represent the savings for the generalized method.
Consider cases of the energy consumption during the peak period (Q1 kWh), off-peak period (Q2
kWh) and standard (Q3 kWh). The ratios of consumption during peak period (S1) and off-peak periods (S2) are determined by Oranset al. (2010):
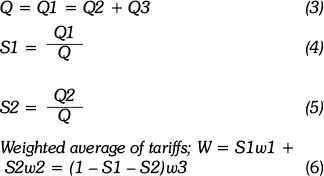
where w1, w2, and w3 are the tariffs during peak, off-peak and standard time, respectively.
If the weighted average tariff is used to calculate the cost savings due to load-shifting (C), it would be equal to the total energy consumption multiplied by the change in weighted average marginal costs:
C = Q x ΔW
![]()
The results of the weighted cost savings are shown in Table 2.
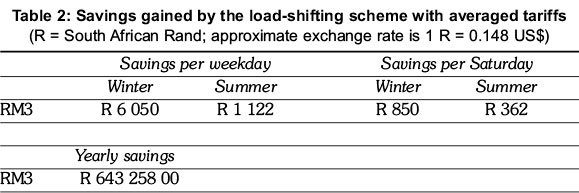
Using the averaged tariffs, the yearly electrical costs savings are still substantial. This shows that this DSM project is worth pursuing. The difference between savings calculated with the direct method and the averaged method is 3.7%. The marginal change shows that, should an ESCO present a savings value to a company using the common practice of weighted average values, it could be used as a valid indication of the expected savings.
7. Pilot study
A pilot study was performed in the cement plant under investigation. The aim of the pilot study was an attempt to put into practice the theoretical load-shifting strategy and validate the theoretical findings. The pilot study was performed on Raw Mill #3 over a period of five days, Monday 18 - Friday 22 October 2010. The DSM strategies of the silo and profile simulations were followed. The raw mill was powered by a 4 MW electrical motor. A simplified breakdown of the approach or load-shifting parameters, shown in Figure 7, are:
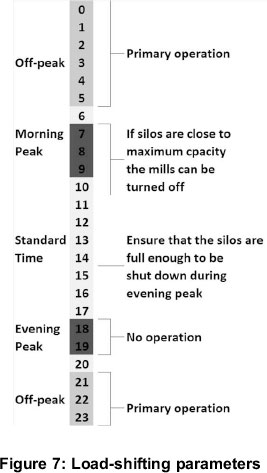
- Operate the mill primarily between 21:00 -06:00.
- If silo levels are acceptable for load-shifting for a minimum period of two hours there must be no operation between 18:00 - 20:00.
- Hours between 06:00 - 18:00 may act as a secondary operation time slot.
- If silo levels are acceptable for further load-shifting, the mill may be turned off from 07:00 into standard time. It is essential, however, to ensure that the mill will be able to shut down during the evening peak period.
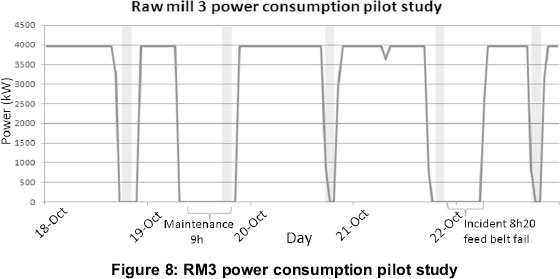
Figure 8 presents the power consumption of Raw Mill #3 during the pilot study. Load-shifting was successfully applied to the raw mill during the evening peak period for all five days of the pilot study, thus achieving the load-shifting goals. The last day was, however, load-shifted for only one of the two evening peak period hours. Figure 8 further illustrates that there were nine hours of scheduled maintenance and an additional 8.3 incident hours during the week. Despite this, load-shifting was still able to take place.
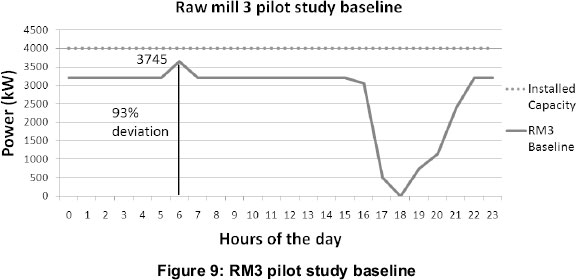
The consumption profile of Raw Mill #3 can be seen in Figure 9. The substantial reduction in evening peak period consumption was anticipated from the pilot study.
7.1. Performance of the silo simulation
Figure 10 provides a comparison of the actual silo level during the pilot study against the level generated by the silo simulation. The operating hours obtained from Figure 8 were used in the simulation to create the change in level for every hour. The simulation has an average error of 3.5%. This deviation may be due to the changing flow rates of the equipment. The simulation uses the average flow rate values obtained from the three months of historical SCADA data. Raw Mill #3 has a flow rate standard deviation of 15%.
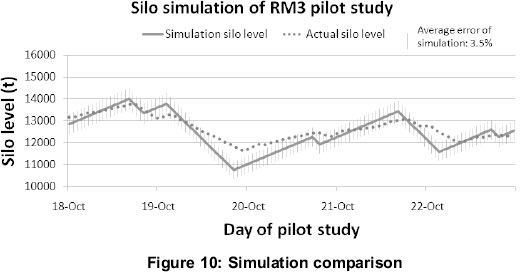
The actual fluctuation of flow rates experienced would most likely bring about the differences that are seen in Figure 10. With a 3.5% error, the simulation would be able to provide acceptable information regarding the changing levels of the silos over a monthly period.
7.2. Change in electrical operating cost
Figure 11 shows the optimized profiles of the Raw Mill #3 in comparison to the baselines achieved in the pilot study. The two baselines for Raw Mill #3 differ considerably from each other. Not only are the profiles dissimilar but total areas under the curve are also different.
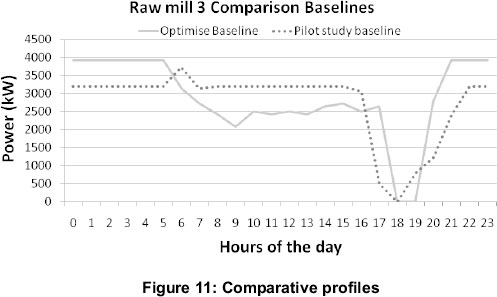
This is a clear indication that the average production of Raw Mill #3 over the pilot study was not the same as the three-month period of the investigation. This was taken into consideration when the change in electrical cost was analysed.
Eskom tariffs and the hourly power consumption values were used to calculate electrical costs for the pilot study. The original yearly electrical operating cost of Raw Mill #3 was R6 670 640 (US$969 620). When implementing the load-shifting strategy, the cost was R6 275 032 (US$928 705), representing a 6% reduction.
The total reduction in AUC of electrical consumption is 4%. This would lead to a conclusion that the load-shifting and incident hours had little effect on electrical cost, and that the production rate was responsible for the change in expenses. To eliminate this influence, the pilot study baseline was either reduced or increased every hour by an equal increment to establish a similar production rate as the original. In other words, the baseline was either shifted up or down so that the area under the curve would correlate with the original baseline.
Table 3 lists the savings achieved by the mills if the profiles of the baselines during the pilot study remain the same. However, the magnitude was altered to equal the areas under the curve with the original.
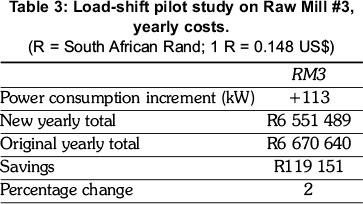
Results show that Raw Mill #3 achieved a reduction in yearly electrical costs of 2%. This is as a direct result of load-shifting during the peak periods of the day. Raw Mill #3 shifted a total of 9 hours off the peak periods. Because the tariffs of the morning peak and evening peak are the same, it does not make a difference to cost savings whether the hours are shifted during the morning or the evening. Raw Mill #3 experienced several shutdown hours during standard and off-peak periods. Therefore, more of the higher standard time tariff was used to meet the same production rate.
7.3. Change in peak period consumption
As stated previously, the objective of a load-shifting scheme for the cement plant would be to reduce the electricity costs. This is however, not Eskom's goal. The utility is interested in how much the peak period demand is reduced.
Table 4 lists the reduction in power consumption during the morning and evening peak periods for the mill during the pilot study. These values are calculated after the baseline was shifted to make their production equal.
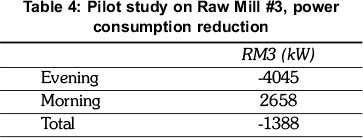
The pilot study produced an overall reduction in peak period demand by 1.4 MW. This is solely due to the evening load-shift of Raw Mill #3.
The priority time slot for Eskom is during the evening peak period from 18:00 - 20:00. This is when the country's electrical peak is the highest and reserve margins are at their lowest. With this in mind, the load-shifting pilot study was a success as the plant's evening peak demand decreased by 4 MW.
8. Discussion
The process of cement making opens up opportunities for a DSM load-shifting program. The mills' higher material flow rates compared to those of the kilns, and the storage buffers, allow the mills to be periodically turned off without adversely effecting production. If the shutdown hours are planned for morning and evening peak periods, the plant can increase utilisation during the lower tariffs or off-peak periods and thereby reduce electrical costs.
A South African cement plant allowed a load-shifting (altering energy use methods) strategy to be investigated on one of its raw mills. A theoretical study (spread sheet-simulation) on load-shifting produced favourable results. The simulation indicated that there was considerable opportunity to reduce electrical costs by shifting the loads of the specific raw mill to off-peak periods.
From the pilot study however, it was evident that performing a load-shifting strategy according to idealised theoretical results would be difficult. The mill's operating hours are easily influenced by unpredictable breakdowns. This, together with changes in production, often requires the mills to run whenever possible to meet demand. Therefore, electrical cost savings become a lower priority for plant managers.
Despite this, the electrical cost of load-shifting can be realised if incident hours do not interfere with production, such as shown with the Raw Mill #3 pilot study. The ease at which the mill motors can be shut-down and started-up allows money to be saved without excessive inconvenience to operators. For cement mills, however, the influence of mill temperature over the cement setting quality may deter cement plants from initiating a load-shifting scheme.
It is therefore suggested that a flexible load-shifting scheme be developed with more focus on load-shifting hours. The present silo simulation took into account the changing incident hours of the mills and auxiliary equipment, but did not allow for an adaptable load-shifting scheme.
For example, previous results suggested that although 4 hours of load-shifting were possible, the baselines would only allow 2 hours of evening peak period shutdown every day, with a few hours available during the month to allow for extra incidents or other load-shifting during morning peak periods. A new simulation was created to adjust for part of the day during which the load-shifting hours occur, morning or evening, and how many times during the month.
In this way, the spread sheet-simulation can be used in a supplementary, dynamic manner and not only calculate a number of hours for every weekday. This would also improve relevance to the morning load-shifts required by the less reliable mills. Figure 12 is a snap shot of the simulation operating window. As can be seen in the expansion box, it provides a choice as to when the load-shifting shutdowns occur. In this example, the mill can, not only, be shut down every weekday for 2 hours during the evening peak period, but also 3 hours in the morning for three days a week.
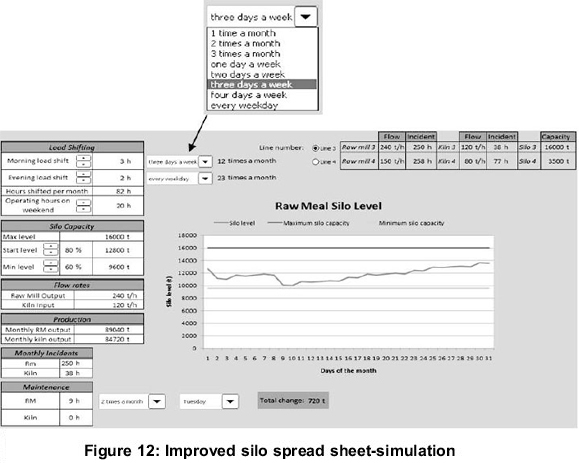
This would provide improved flexibility to incident hours that prevent planned load-shifting from occurring. The simulation still relies on an averaging of incident hours over the 31 days, but the improved resolution does, however, serve as an aid to improve the flexibility of the load-shifting scheme.
9. Conclusion
Load-shifting was investigated on a raw mill at a large South African cement plant. The investigation revealed that a good opportunity exists in the cement manufacturing industry to reduce electrical costs. This is however highly dependent on the reliability of the mills, levels of material and the current market demand. Load-shifting schemes should therefore be flexible on a daily basis to shift load whenever possible.
Because most raw (and cement) mill motors have large power outputs, they are able to, in a relatively short time, compensate for the periods of non-production when load has been shifted. This can result in a significant reduction in energy costs because of the greater use during lower electricity tariff periods. South African electricity utility, Eskom, strives towards this reduction in its DSM program. By promoting a routine procedure of shutting down mills during peak periods, the typical cement plant can assist Eskom in maintaining a reliable and sustainable power supply. At the same time, the cement producers will be able to significantly reduce their annual electrical costs.
Acknowledgement
The authors thank Prof Ernst Worrell (Utrecht University) and Ms Lynne Price (Lawrence Berkeley National Laboratory) for their advice and direction. Thanks also to Mr Douglas Velleman for proofreading the manuscript and for his incisive comments.
References
Ashok, S., and Banerjee, R., (2003). Optimal cool storage capacity for load management. Energy, 28: 115126. [ Links ]
Choate, W.T., (2003).Energy and Emission Reduction Opportunities for the Cement Industry. BCS, Incorporated, 5550 Sterrett Place, Suite 306, Columbia, MD 21044. [ Links ]
Eskom. (2012). Eskom Enterprises (Pty) Limited, Tariffs and Charges, website: . co.za/c/article/145/tariffs/ [accessed on 3 December 2012] [ Links ].
Fawkes, H., (2005). Energy Efficiency in South African Industry. Journal of Energy in Southern Africa, 16(4): 18-25. [ Links ]
Gomes, A, and Antunes, C.H., (2004). A multiple objective evolutionary approach for the design and selection of load control strategies. IEEE Transactions of Power Systems, 19(2): 1173-1180. [ Links ]
Hasanbeigi, A., Price, L., Lu, H., and Lan, W., (2010). Analysis of energy-efficiency opportunities for the cement industry in Shandong Province, China: A case study of 16 cement plants. Energy, 35: 34613473. [ Links ]
Hu, W., Chen, Z., and Bak-Jensen, B., (2010). Impact of optimal load response to real-time electricity price on power system constraints in Denmark. UPEC, 31 Aug - 3 Sept. [ Links ]
Hughes, A., Howells, M.I., Trikam, A., Kenny, A.R., and Van Es, D., (2006).A study of demand side management potential in South African industries. Industrial and Commercial Use of Energy Conference. University of Cape Town, Cape Town, South Africa. [ Links ]
Human, M., (2010). Personal communication with electrical manager at Lafarge Lichtenburg. Manana Road, Industrial Sites, Lichtenburg 2740, South Africa. [ Links ]
Jorge, H., Antunes, C.H., and Martins, A.G., (2000). A multiple objective decision support model for the selection of remote load changes. IEEE Transactions on Power Systems, 15(2): 865-872. [ Links ]
KEMA, (2005). Industrial Case Study: The Cement Industry, CALMAC Study ID: PGE0251.01, Final Report. KEMA Inc., Oakland, California. [ Links ]
Madlool, N.A., Saidur, R., Hossain, M.S., and Rahim, N.A., (2011). A critical review on energy use and savings in the cement industries. Renewable and Sustainable Energy Reviews, 15: 2042-2060. [ Links ]
Maltese, C., Pistolesi, C., Bravo, A., Cella, F, Cerulli, T., and Salvioni, D., (2007). A case history: Effect of moisture on the setting behaviour of a Portland cement reacting with an alkali-free accelerator. Cement and Concrete Research, 37(6): 856-865. [ Links ]
Middelberg, A., Zhang, J., and Xia, X., (2009). An optimal control model for load shifting - with application in the energy management of a colliery. Applied Energy, 86: 1266-1273. [ Links ]
NDRC (National Development and Reform Commission), (2006). .Industrial policy for the cement industry. NDRC; Number 50 Directive, Beijing, China. [ Links ]
NRC (Natural Resources Canada), (2009). Canadian cement industry energy benchmarking summary report. Canadian Industry Programme for Energy Conservation. c/o Natural Resources Canada, 580 Booth Street, 12th floor, Ottawa, ON, K1A 0E4. [ Links ]
Orans, R., Woo, C.L., Horii, B., Chait, M., and De Benedicits, A., (2010). Electricity Pricing for Conservation and Load-shifting. The Electricity Journal, 23(3): 7-14. [ Links ]
Paulus, M., and Borggrefe, F., (2011). The potential of demand-side management in energy-intensive industries for electricity markets in Germany. Applied Energy, 88(2): 432-44. [ Links ]
PCA (Portland Cement Association), (2010). How Portland cement is made. Cement and Concrete Basics. . (Accessed on: 10 June 2010. [ Links ])
Price, L., Hasanbeigi, A., and Lu, H., (2009). .Analysis of Energy-Efficiency Opportunities for the Cement Industry in Shandong Province, China. Ernest Orlando Lawrence Berkeley National Laboratory, Environmental Energy Technologies Division, Berkeley, CA, USA. [ Links ]
Sirchis, J., (1989). .Energy efficiency in the cement industry. Proceedings of a seminar organized by the Commission of the European Communities, Directorate-General from Energy and CIMPOR Cimentos de Portugal E.P. with the co-operation of Cembureau European Cement Association, Oporto, Portugal. [ Links ]
Tatum, M., (2010). What is Portland cement? WiseGeek. (Accessed on 22 October 2010). [ Links ]
Worrell, E., Galitsky, C., and Price, L., (2008). .Energy Efficiency Improvement and Cost Savings Opportunities for Cement Making. Ernest Orlando Lawrence Berkeley National Laboratory, Environmental Energy Technologies Division, Berkeley, CA, USA. [ Links ]
Worrell, E., Martin, N., and Price, L., (2000). Potentials for energy efficiency improvement in the US cement industry. Energy, 25(12): 1189-1214. [ Links ]
Worrell, E., Price, F.L., Powell, C., and Powell, F., (2005). Case Study of the California Cement Industry. Ernest Orlando Lawrence Berkeley National Laboratory, Environmental Energy Technologies Division, Berkeley, CA, USA. [ Links ]
Received 30 August 2011
Revised 4 December 2012

