


Services on Demand
Article
 English (pdf)
 Article in xml format
 Article references
Indicators

Related links
-
 Cited by Google
 -
 Similars in Google
Share

 Permalink
Journal of Energy in Southern Africa
On-line version ISSN 2413-3051
Print version ISSN 1021-447X
J. energy South. Afr. vol.24 n.1 Cape Town Jan. 2013
Measurement and verification of load shifting interventions for a fridge plant system in South Africa
Rupert Gouws
School of Electrical, Electronic and Computer Engineering, North-West University, Potchefstroom
ABSTRACT
In this paper, the author presents the measurement and verification methodology used to quantify the impacts of load shifting measures that are implemented on large industrial fridge plant systems in South Africa. A summary on the operation of fridge plant systems and the data typically available for baseline development is provided. The author discusses issues surrounding baseline development and service level adjustments for the following two scenarios: 1) the electrical data is available for both the baseline and post-implementation periods; and 2) only the thermal data is available during the baseline period, but both the thermal and electrical data is available during the post-implementation period. Typical results are provided with advantages and disadvantages of both methodologies.
Keywords: fridge plants, chiller units, M&V baseline development, M&V service level adjustment, energy efficiency
1. Introduction
The author provides an overview of a fridge plant system and discusses the data requirements and data selection for baseline development. The baseline development is divided into two scenarios: 1) where electrical data is available for both the baseline and post-implementation periods and 2) where only thermal data is available for the baseline period. The procedure surrounding baseline service level adjustments (SLA) for both scenarios are provided.
The scheduling of fridge plant systems for underground cooling in the mining industry has proven to be a very effective method in reducing power demand during Eskom's weekday evening peak period (18:00 to 20:00) (Delport, 1996). Substantial electricity cost savings can be obtained for the mine under the Megaflex tariff structure by shifting the cooling load of fridge plants out of the weekday evening peak period (M&V Guideline, 2007). The load is shifted to other less expensive time-of-use (TOU) periods to ensure that the same amount of thermal energy is provided to the mine as would have been the case prior to the implementation of the Demand Side Management (DSM) project (IPMVP 2010).
Fridge plants consume large quantities of electrical energy to produce sufficient cold water to reduce the ambient underground conditions in South African mines, especially during the summer months when outside temperatures and humidity are high. The electrical power demand on Eskom's national grid is the highest during the weekday evening peak period (18:00 to 20:00) when large amounts of electrical energy are simultaneously used by consumers.
This simultaneous usage of electrical energy creates substantial strain on Eskom's generating capacity. Demand-side management projects are implemented to reduce this power demand during the peak periods through changes in the operational schedules which enable consumers to shift the electrical load to other TOU and thus minimize the electrical power demand between 18:00 and 20:00 on weekdays.
Similar measurement and verification (M&V) projects on municipal water pumping and lighting load reduction through energy efficiency is presented by Bosman et al., (2006) and Masopoga et al., (2009), respectively.
2. An overview of a fridge plant system
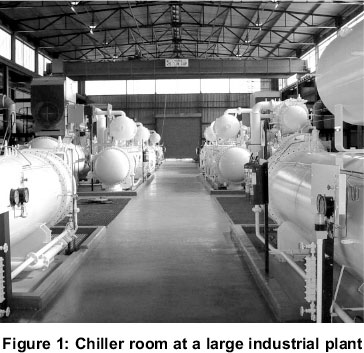
Figure 1 provides a picture of the chiller room at a large industrial plant. From this picture the chiller units can be clearly seen.
The fridge plant operates using the principle of the refrigeration cycle (Albieri et al., 2009; Chen et al., 2009). Electrical input is provided to the compressor of the chiller unit, as shown in figure 2 (Grote, 2009). In the evaporator heat exchanger the hot feed water is cooled down and pumped to the cold water storage dam.
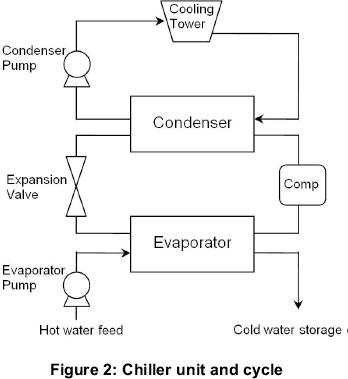
The evaporator pumps are used to circulate the water through the chiller unit into the cold water storage dam. Condenser pumps circulate water between the condenser unit of the fridge plant and the condenser cooling towers. When the chiller unit is switched off, the evaporator pump, condenser pump and cooling tower fans can be switched off. This results in a decrease of the power demand. The coefficient of performance (COP) of the fridge plant is usually in the order of 5; however, it varies according to changes in atmospheric temperatures and humidity (Saha, 1997).
Water is used to cool the underground mining conditions and operations. The water is cooled with fridge plants situated either underground or on the mine surface. The water is fed under gravity to the various mining operations where the ambient air is cooled using a series of fans and radiators.
Water enters the fridge plant at approximately 18°C and is cooled to 2°C using a series of large chiller units. The water is then pumped into a storage dam where it can readily be drawn into the mine.
A fridge plant usually consists of three to six chiller units, each with a rated electrical capacity (installed) of about 1.4 MW. The electrical capacity of the chiller units leads to high electrical power demands during Eskom's peak and off-peak periods.
To reduce the electrical power demand of the fridge plant during peak periods, the electrical load is shifted to other TOU periods. This is accomplished by utilising the cold water dam's storage capacity. During off-peak periods, large amounts of cold water are generated and stored in the cold water storage dam.
During the peak periods the chiller plants are either switched off or throttled back to lower the power demand of the fridge plant. The thermal energy needed to cool down the mine is drawn from the cold storage dam. Thus the system is utilised in such a manner that the maximum amount of thermal energy is stored in the storage dam at the beginning of the peak period.
3. Baseline data requirements and data selection
It is required to obtain twelve (12) months of electrical or thermal data with 30 minute intervals depending on which data is available during the baseline period to capture seasonal variances in electrical energy use.
The data must be representative of the actual operation prior to the demand side management (DSM) intervention and it must be confirmed that no impacts are expected outside the evening peak period.
The project must be a pure load shifting project and it must be confirmed with the energy savings company (ESCo) that no energy efficiency impacts are expected.
The data must be historical electrical or thermal data from the mines Supervising, Control and Data Acquisition (SCADA) system (were available), otherwise M&V metering equipment must be used to obtain the electrical kW or thermal kW of the total fridge plant system.
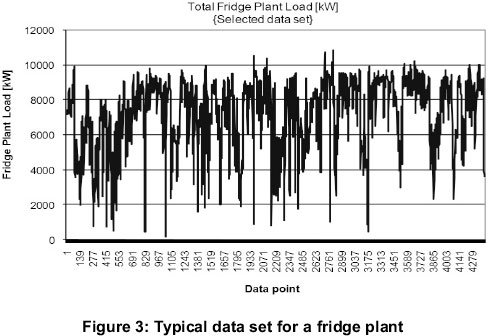
Figure 3 shows a typical data set for a period of 12-months (12-months data points) obtained from the mines SCADA system, describing the total electrical load of the fridge plant system.
When performing data preparation, all irregular and 'wrong' behaviour must be identified and removed if not explainable. When selecting the data period, the data must be isolated to the most recent 12-months period and the data must be selected prior to the ESCo involvement on the site.
Note that when using a data period that reaches too far back it could give a poor representation, while too recent data could capture proactive ESCo/Client involvement impacts (IPMVP 2010).
4 Baseline development
To measure and verify the impact of a fridge plant, a baseline model needs to be developed before project implementation. The objective of the baseline model is to provide a prediction of what the electricity usage would have been if the project had not been implemented. The savings is then determined by subtracting the actual profile from the baseline profile.
The data should be grouped into weekdays, Saturdays and Sundays. When developing the baselines, 12 baselines should be developed (one for each month of the year). The average weekday load per 30-minute interval from all selected weekdays should be calculated. This procedure should be repeated to obtain the average Saturdays and average Sundays load.
The baseline consumption (kWh/day) for the weekdays, Saturdays and Sundays should be calculated.
4.1 Electrical data for both baseline and post-implementation
In this section, the electrical data is available for both the baseline and post-implementation periods. Figure 4 shows the electrical weekdays, electrical Saturdays and electrical Sundays baseline profiles for a fridge plant system in South Africa.
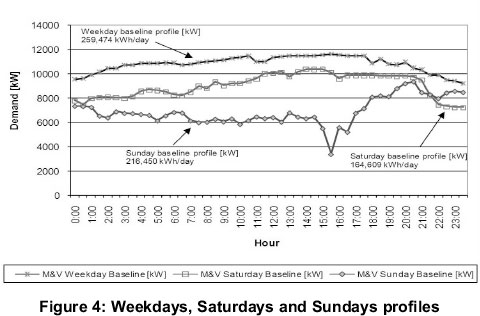
Note that there are separate baselines for weekdays, Saturdays and Sundays, since these days are handled differently under the Eskom Megaflex tariff structure.
The electricity consumption for the weekday baseline profile is calculated at 259,474 kWh/day, 164.609 kWh/day for the Saturday baseline profile and 216.450 kWh/day for the Sunday baseline profile.
4.2 Only thermal data available for baseline period
In this section, only the thermal data is available for the baseline period. Figure 5 shows the thermal weekdays, thermal Saturdays and thermal Sundays baseline profiles for the fridge plant system in South Africa.
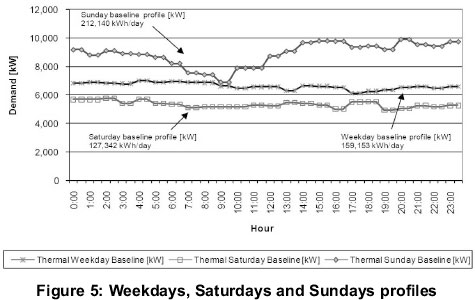
The thermal consumption is calculated at 212.140 kWh/day for the weekday baseline profile, 159,153 kWh/day for the Saturday baseline profile and 127,342 kWh/day for the Sunday baseline profile.
5 Service level adjustments
This section focuses on service level adjustments (SLAs) on fridge plants. SLAs are performed after implementation and on a daily basis. An assumption is made that the overall system efficiency is not affected by the DSM project. The data used for SLAs is the daily post-implementation data. The procedure of SLAs is demonstrated for a single weekday. The same procedure must be repeated for Saturdays and Sundays.
5.1 Electrical data for both baseline and post-implementation
This section focuses on the SLAs where the electrical data is available for both the baseline and post-implementation periods.
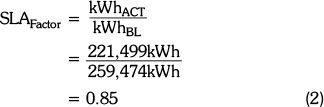
The SLAFactor is the relation between the electricity consumption during the actual period and the electricity consumption during the baseline period. The SLAFactor for every day is calculated by the following equation:
![]()
Where kWhAct is the actual electricity consumption and kWhBL is the baseline electricity consumption.
Figure 6 shows the weekday actual profile for the total fridge plant. From this profile, the actual electricity consumption (kWhAct) is calculated at 221,499 kWh/day.
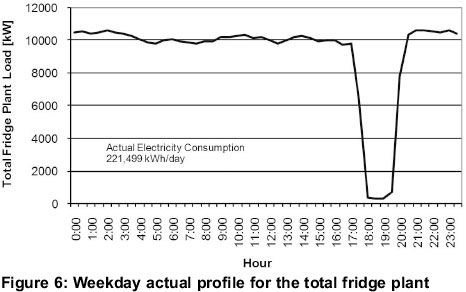
Figure 7 shows the baseline profile for the total fridge plant. From this profile, the baseline electricity consumption (kWhBL) is calculated at 259,474 kWh/day.
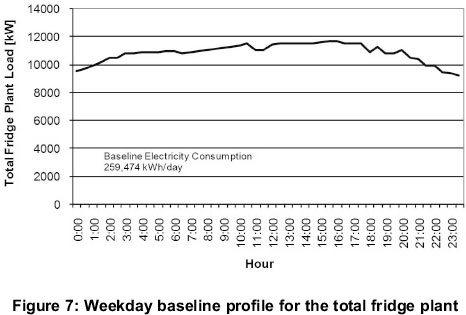
Figure 8 shows the weekday baseline, SLA weekday baseline and actual weekday profiles for the total fridge plant. The baseline weekday profile is scaled according to the calculated SLAFactor.
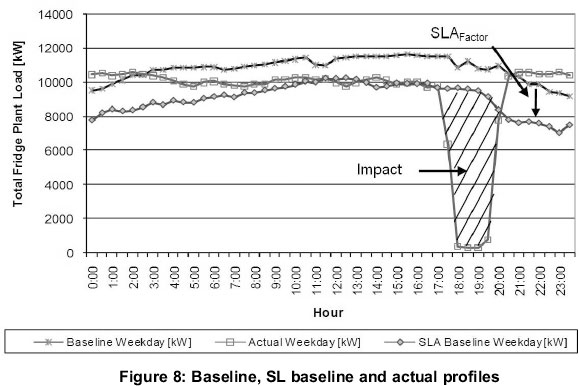
Each 30-min kW value of baseline profile is multiplied by the SLAFactor. The SLAFactor is calculated by equation (2) at 0.85.
5.2 Only thermal data available for baseline period
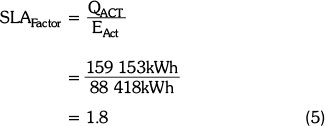
This section focuses on the SLAs where only the thermal data is available during the baseline period. The SLAFactor for the thermal data is the relation between the thermal consumption during the actual period and the electricity consumption during the actual period. The SLAFactor for every day is calculated by the following equation:
![]()
Where QAct is the actual thermal consumption and EAct is the actual electrical consumption. The amount of thermal energy consumed during the actual period (QAct) is calculated by means of the following equation:
![]()
Where m is the mass of the water, Cp is the specific heat capacity of water and ΔT is the difference between the inlet and outlet temperatures of the fridge plant.
Figure 9 shows the thermal actual weekday and electrical actual weekday profiles for the total fridge plant. The consumption for the thermal actual weekday (QAct) is calculated at 159,153 kWh/day and the consumption for the electrical actual weekday (EAct) is 88,418 kWh/day.
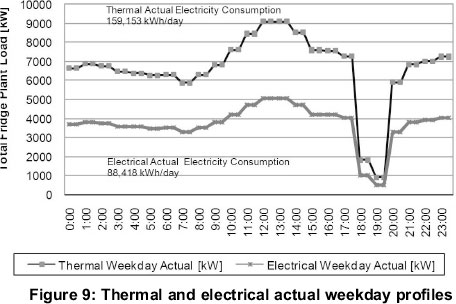
Figure 10 the thermal weekday actual and thermal weekday baseline profiles for the total fridge plant system. kWh/day-neutrality were performed on the baseline profile. Therefore, the kWh/day for the baseline profile is the same as the kWh/day for the actual profile.
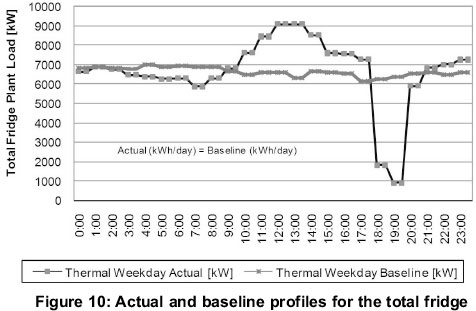
Figure 11 shows the thermal weekday baseline and electrical weekday baseline profile of the total fridge plant system.
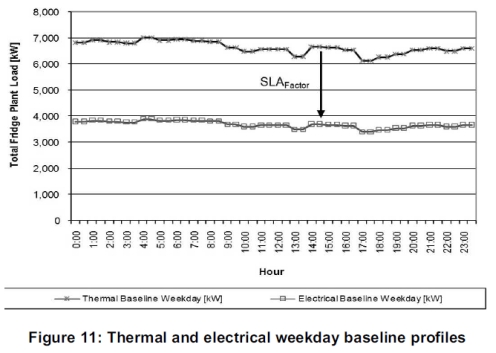
Figure 12 shows the electrical weekday actual and electrical weekday baseline profiles of the total fridge plant system. The savings is calculated by subtracting the actual profile from the baseline profile.
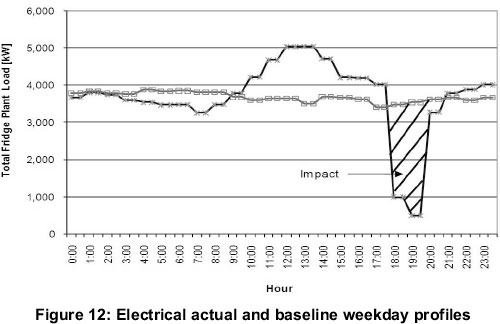
Each 30-min kW value of thermal baseline profile is multiplied by the SLAFactor. The SLAFactor is calculated by equation (5) at 1.8.
6. Conclusion
The M&V methodology used for baseline development and SLAs on large industrial fridge plant systems are presented in this paper. Two different scenarios surrounding baseline development and service level adjustments are discussed. The first is where the electrical data is available for both the baseline and post-implementation periods and the second is where only the thermal data is available during the baseline period, but both the thermal and electrical data is available during the post-implementation period.
When the electrical data is available for both the baseline and post-implementation periods, the SLA factor is calculated from the relation between the electricity consumption during the actual period and the electricity consumption during the baseline period.
When only the thermal data is available for the baseline period and electrical data is available during the post-implementation period, the SLA factor is calculated from the relation between the thermal consumption during the actual period and the electricity consumption during the actual period.
A summary on the operation of fridge plant systems and the data typically available for baseline development together with typical results of both methodologies and how to calculate the savings once the project has been completed are also provided.
The most important parameters used to compensate for extra cooling is the difference between the inlet and outlet temperatures (ΔT) of the fridge plant. Water in the storage dam can be cooled too much lower temperatures than during the baseline condition by means of converting the water to ice. The electricity cost can further be reduced by performing this conversion during the off peak periods and by using less chillers during mines peak periods.
Similar papers that also focus on the refrigeration cycle include: Multiple lift tube pumps boost refrigeration capacity in absorption plants (Vicatos et al., 2007) and a car air-conditioning system based on an absorption refrigeration cycle using energy from exhaust gas of an internal combustion engine (Vicatos et al., 2008).
References
Albieri M., Beghi A., Bodo C., and Cecchinato L., (2009). Advanced control systems for single compressor chiller units, International Journal of Refrigeration, Vol. 32, Issue 5, August 2009, pp. 1068-1076. [ Links ]
Bosman I.E., and Grobler L.J., (2006). Measurement and verification of a municipal water pumping project, Journal of Energy in Southern Africa, Vol. 17, No. 1, February 2006, pp. 42-49. [ Links ]
Chen J., and Yan Z., (2009). Optimal performance of an endoreversible-combined refrigeration cycle, Journal of Applied Physics, Vol. 63, Issue 10, 7 July 2009, pp. 4795-4798. [ Links ]
Delport G.J., and Lane I.E., (1996). An energy conversion and integration methodology for end-user groups in deep level mines, Industry applications conference, Thirty-first IAS annual meeting, IAS'96, Vol. 4, pp. 2492-2498. [ Links ]
Grote K., and Antonsson E.K., (2009). Handbook of Mechanical Engineering, Springer. [ Links ]
IPMVP, (2010). International performance measurement and verification protocol, Vol. 1, [Online] Available at http://www.evo-world.org. [ Links ]
Masopoga I., van der Merwe C., and Grobler L.J., (2009). Measurement and verification of a lighting load reduction project through energy efficiency, Journal of Energy in Southern Africa, Vol. 20, No. 3, August 2009, pp. 11-13. [ Links ]
M&V Guideline, (2007). The Measurement and Verification (M&V) guideline for Demand-Side Management (DSM) projects. Guideline report prepared for Eskom's corporate technical audit department. [Online] Available at www.eskom.co.za. [ Links ]
Saha B.B., Akisawa A., and Kashiwagi T., (1997). Thermodynamic analysis of adsorption refrigeration cycles, Energy Conversion Engineering Conference (IECEC-97), Vol. 2, pp. 1258-1264. [ Links ]
Vicatos G., and Bennett A., (2007). Multiple lift tube pumps boost refrigeration capacity in absorption plants, Journal of Energy in Southern Africa, Vol. 18, No. 3, August 2007, pp. 49-57. [ Links ]
Vicatos G., Gryzagoridis J., and Wang S., (2008). A car air-conditioning system based on an absorption refrigeration cycle using energy from exhaust gas of an internal combustion engine, Journal of Energy in Southern Africa, Vol. 19, No. 4, November 2008, pp. 6-11. [ Links ]
Received 22 April 2011
Revised 22 November 2012

