


Serviços Personalizados
Artigo
 Inglês (pdf)
 Artigo em XML
 Referências do artigo
Indicadores

Links relacionados
-
 Citado por Google
 -
 Similares em Google
Compartilhar

 Permalink
Journal of Energy in Southern Africa
versão On-line ISSN 2413-3051
versão impressa ISSN 1021-447X
J. energy South. Afr. vol.24 no.1 Cape Town Jan. 2013
Energy cost versus production as a performance benchmark for analysis of companies
Houshang TaghizadehI; Mir Vahid PourrabbiII
IDepartment of Management, Tabriz Branch, Islamic Azad University, Tabriz, Iran
IIDepartment of Accounting, Payame Noor University, Tehran, Iran
ABSTRACT
In this paper, the efficiency of automobile and auto-parts producing companies is evaluated, using data envelopment analysis. The data envelopment analysis (DEA) is based on the linear programming model. This model needs a series of information by which the effectiveness and ineffectiveness of decision-making units are determined. In the present research, the inputs and outputs of the DEA model are determined by using the basic criteria, and the energy efficiency of automobile and auto-parts producing companies is specified. For this purpose, to evaluate the energy efficiency of the automotive industry and auto parts producing companies, deep2 software has been used. Finally, based on the results of the study, the efficient and inefficient companies have been identified and classified.
Keywords: energy efficiency evaluation, Data envelopment analysis, Tehran Stock Exchange, efficiency
Introduction
Energy intensive manufacturing sectors convert raw materials into finished goods primarily by chemical (not physical) means. Heat is essential to their production. Natural gas, fossil fuels, and their by-products are the largest sources of energy for this group. They are of great importance because of their high energy consumption and environmental impacts. It is, therefore, important to assess and optimize their total energy consumption to discover the opportunities for energy efficiency improvements and detection of best benchmarks.
The energy efficiency is the proportion of output to its energy input. Several models have been published to evaluate energy efficiency in energy management literature. However, there have been few efforts based on systematic approaches to compare the relative efficiency of the high energy-consuming manufacturing sectors. Data envelopment analysis is a special linear programming model for deriving the comparative efficiency of multiple-input multiple-output decision-making units (DMUs). Energy consumption in energy intensive manufacturing sectors is a function of three indicators, i.e. activity, structure and efficiency. This makes the energy efficiency analysis a multidimensional decision problem which can be resolved with the aid of multi-variate analysis such as DEA (Azadeh, et al., 2007).
As data envelopment analysis is a linear programming method which, by using the data of manufacturing units and organizations as the decision-making units, proceeds to render the efficiency frontier. This frontier is rendered based on the data in the form of inputs and outputs and on the successive results of the linear programming. In fact, the rate of each decision-making unit's efficiency is the distance between that unit and the efficiency frontier (Rao et al., 2003). In this method, in order to follow the benchmark to increase efficiency in each unit, a set of references is specified for the inefficient unit, and the efficiency of different units is compared to that of the efficient units (Shang & Sueyoshi, 1995). In this research, the data envelopment analysis method has been used to evaluate the energy efficiency of automobile and auto-parts producing companies admitted to the Tehran Stock Exchange.
Previous works
Regarding the evaluation of energy efficiency by using DEA method, numerous researches have been done; some of them are as follows:
Mandal (2010) studied energy use efficiency with regard to energy related undesirable emission of pollutants in the Indian Cement Industry by using data envelopment analysis techniques. Nassiri and Singh (2009) studied the energy use efficiency in the production of paddy crops using data envelopment analysis techniques. Bian and Yang (2010) measured the aggregated efficiency of resources (e.g., energy, water, etc.) and environment based on DEA technology, which provided an index to analyze DMUs' energy efficiency and environment efficiency simultaneously. Hu and Kao (2007) used a DEA approach to find the energy-saving target for Asian-Pacific Economic Cooperation (APEC) economies without reducing their maximum potential annual GDP Energy, labour, and capital are the three inputs, while GDP is the single output. Therefore, Zhou and Ang (2008) evaluated energy use efficiency within a joint production framework of both desirable and undesirable output. Ramanathan (2000) used DEA to compare the energy efficiencies of alternative transport modes.
In other research, Lee (2008) employed data envelopment analysis to calculate the overall energy efficiency, using the predicted energy usage intensity as output and the observed energy usage intensity as input. Önut and Soner (2007) analyzed energy use and efficiency in Turkish small and medium size enterprises (SMEs). Yeh et al., (2010) employed data envelopment analysis to make a comparative evaluation of energy utilization efficiency of welfare services in China and Taiwan from 2002 to 2007. Önut and Soner (2006) evaluated energy efficiency in 32 five-star hotels in Antalya, Turkey, by using DEA. Honma and Hu (2008) computed the regional total-factor energy efficiency (TFEE) in Japan by employing the data envelopment analysis. Wei et al., (2007) investigated energy efficiency of China's iron and steel sector during the period 1994-2003 by using Malmquist Index Decomposition. Chang and Hu (2010) assessed energy productivity growth for regions in China by using the total-factor energy productivity index (TFEPI). Chauhan et al., (2006) used DEA to determine the farmers' efficiency with regard to energy use in rice production activities in the Alluvial zone in the state of West Bengal in India. Mukherjee (2008) used DEA to measure energy efficiency in the Indian manufacturing sector. Lee et al. (2010) applied the integrated fuzzy analytic hierarchy process (Fuzzy AHP) and the data envelopment analysis for measuring the relative efficiency of the R&D performance in the sector of hydrogen energy technology development from an economic viewpoint. Shi et al., (2010) investigated energy efficiency in China's industry and also measured the maximum energy-saving potential in 28 administrative regions in China.
Furthermore, Filippin (2000) studied the energy efficiency and emissions of greenhouse gases for 15 public school buildings in the central area of Argentina. Omid et al. used DEA to investigate the degree of technical efficiency and scale efficiency of producers, and evaluate and rank productivity performance of selected greenhouses in Iran based on eight energy inputs: labour, diesel, machinery, fertilizers, chemicals, irrigation water, seeds and electricity. Boyd and Pang (2000) used DEA to measure productivity at the plant level in the flat glass industry and the container glass industry. Azadeh et al., (2007) proposed an integrated DEA approach to assess the energy efficiency of energy-intensive manufacturing sectors. Malana and Malano (2006) studied benchmarking production efficiency of selected wheat producing areas in Pakistan and India using DEA. Ramanathan (2005) used DEA approach for the analysis of energy consumption in the countries of the Middle East and North Africa. Mukherjee (2008) utilized Data Envelopment Analysis to measure the energy efficiency for the aggregate manufacturing sector as well as for the six highest energy consuming 2-digit sectors for the period 1970-2001, and proposed several alternative models.
In all the previous research studies in Iran, there has not been any research concerning the evaluation of energy efficiency in the automotive industry and auto-parts producing companies.
Research objectives
The main objective of this research is to evaluate the energy efficiency of the automotive industry and auto-parts producing industry by using data envelopment analysis and to compare the companies active in this field from the viewpoint of efficiency. On the whole, the research objectives can be summarized as follows:
- To measure the energy efficiency of the different companies in the automotive and auto-parts manufacturing industry.
- To measure the energy efficiency of the automotive industry and auto-parts producing industry during 2003-2008.
- To use the efficient companies as a benchmark for the inefficient companies so that the managers can raise their companies to the efficiency frontier by using the benchmark.
Research method, data collection and statistical population
Due to the fact that the main objective of this research is to identify the efficient companies and to follow their example, the research method is of a descriptive type. In this regard, there is accurate data on the input and output variables in the studies of the Iranian automotive industry and auto-parts producing industry. The statistical population includes the automotive industry and auto-parts producing companies admitted to the Tehran Stock Exchange, from among which 24 companies active during the years 2003-2008 were chosen and studied. The required data has been collected from the financial documents of the companies under study.
The model used in this research
DEA has two models: Charnes, Cooper and Rhodes (CCR) model and Banker, Charnes, Cooper (BCC) model (Banker et al., 1984). The CCR model is based on the assumption of constant returns to scale of activities, but the BCC model is based on the assumption of variable returns to scale of activities. There are two versions for each of the CCR and BCC models. One version of these models aims to minimize inputs without reduction in the output. This is called the input-oriented model. Another type of model, called the output-oriented model, attempts to maximize outputs without requiring more of any of the observed input values (Önut & Soner, 2007).
The model used in the present research is the input-oriented model of BCC and CCR, in which the goal is to minimize inputs.
The research variables
In order to evaluate the energy efficiency by the DEA method, the input and output variables are needed. In this research, the output variables are focused on the desired outputs such as the produced goods. In Table 1, the input and output variables are specified
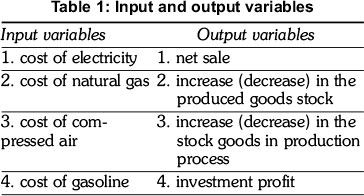
A brief explanation of each input and output variable of the model is given:
Output variables
- Net sale: total sum of sale minus discounts and returned goods within a definite period.
- Increase (decrease) in the produced goods stock: the end of the year stock of the produced goods minus the stock of produced goods at the beginning of the year.
- Increase (decrease) in the stock of the goods in the production process minus the stock of the production goods at the beginning of the year.
- Investment profit: interest of stocks, interest resulting from investment in other companies' stocks, interest of the short-term and long-term bank deposits.
Input variables
- Cost of electricity: the cost of the electricity used in the production, administration, and sales departments.
- Cost of natural gas: the cost of the gas used in the production, administration, and sales departments.
- Cost of compressed air: the cost of the compressed air used in the production department.
- Cost of gasoline: the cost of the gasoline used in the production, administration, and sales departments.
Data analysis
In this research, initially the energy efficiency of each of the companies was studied by using the average of the input and output variables during the years 2003-2008 applying the DEA method (based on the two assumptions of constant and variable returns to scale) and based on an input-oriented approach. Then, the energy efficiency of the automotive industry and auto-parts producing industry during these years was evaluated based on the two assumptions of constant and variable returns to scale. (In order to calculate the efficiency of each of the companies during the years 2003-2008, the average of the inputs and outputs of each company was calculated, and then based on the averages, the efficiency of each company was calculated).
Table 2 shows the results of data analysis of each company under the condition of variable return and constant return to scale.
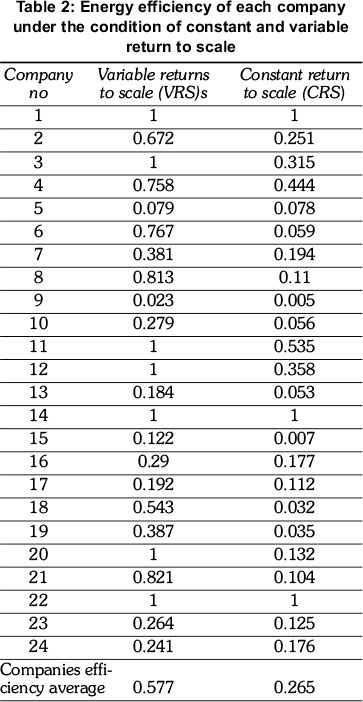
The results obtained from this table indicate that the energy efficiency average under the variable return to scale has been 57.5 percent. Of the 24 companies under study, 7 companies have 100 percent efficiency, and the rest have less than 100 percent efficiency. The energy efficiency average constant return to scale has been 26.2 percent. Of the 24 companies under study, 3 companies have 100 percent efficiency and the rest have less than 100 percent efficiency. This decreases the differentiation power of the model to a great extent. Company number 9 is rated as the least efficient company in comparison with the other companies according to CRS and VRS assumptions.
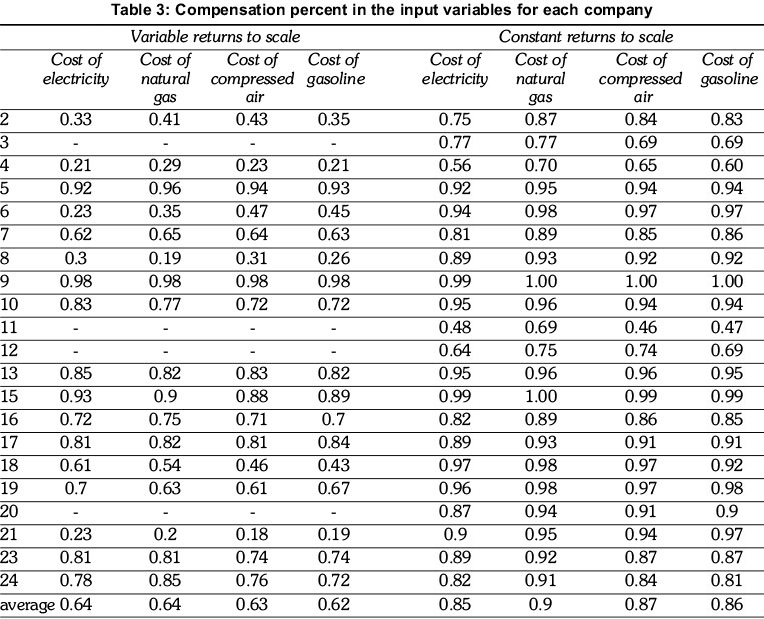
On the basis of the output of DEAP2 software and by using Microsoft Excel spreadsheets, the rate of decrease in the input variables average within the six years for each of the companies to reach 100 percent efficiency has been calculated and shown in Table 3 (For instance, the average cost of electricity of company number 2 during the six years is 548518 thousand rials, and the value given in the output of DEAP2 software for the same variable under the condition of variable returns to scale in order to reach the efficiency level is 234635 thousand rials; therefore, company number 2 should reduce its cost of electricity by 33 percent (348518 - 234635 / 348518 = 0 / 33) in order to reach 100 percent efficiency).
Table 3 shows the rate of decrease in the average of input variables within the six years for each of the companies in order to reach 100 percent efficiency.
In the present research, for both VRS and CRS methods, the input-oriented model has been used. In this model, the emphasis is on minimizing the input variables in order to reach 100 percent efficiency. In the VRS method, 21 companies are considered inefficient. Therefore, in order to increase the efficiency of these companies, the energy saving percent in each input variable has been shown in Table 3. On average, in both methods, the energy saving percent is higher in the cost of electricity in comparison with other energy conveyors.
Later on, the energy efficiency of the automotive industry and auto-parts producing industry was calculated for each of the years under study (For instance, the average of the inputs and outputs of the companies under study in the year 2003 was calculated, and then, on the basis of the average, the efficiency of each company was specified). The results of evaluating the energy efficiency of the automotive industry and auto-parts producing industry during the years 2003-2008 are shown in Table 4 and Figure 1.
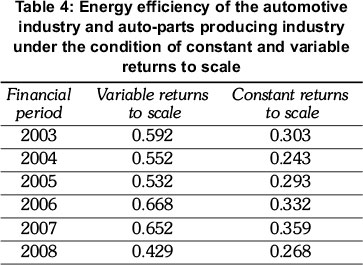
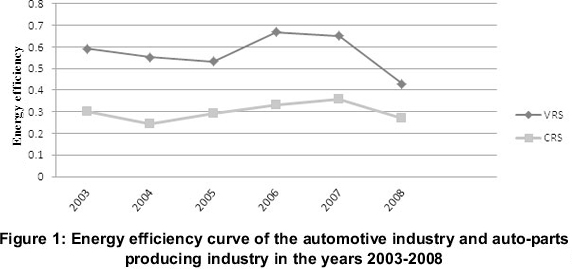
The figure and table show the energy efficiency in both VRS and CRS methods. In the VRS method, the energy efficiency shows a decrease in 2005 but a rising trend in the following year, and then, in the years 2007 and 2008, it decreases. In the CRS method, too, the energy efficiency was at the highest level in 2007 and at the lowest level in 2008. On the whole, in both methods, the energy efficiency has shown a decrease after a period of rise.
Table 5 shows the rate of reduction in the input variable of the automotive industry and auto-parts producing industry for the years 2003-2008 (for instance, the average cost of natural gas of the companies under study in the year 2003 is 504420 thousand rials, and the value given in the output of DEAP2 software for the same variable under the condition of variable returns to scale in order to reach the efficiency level is 4169454 thousand rials; therefore, the automotive and auto-parts producing industry should reduce its n cost by 88 percent (4169454 - 504420 / 4169454 = 0 / 88) in the year 2003 in order to reach 100 percent efficiency).
In the input-oriented model, reduction of inputs without reducing output variables is the focus of attention. By using the mentioned percentages, it will be possible to calculate the new costs for electricity, natural gas, compressed air and gasoline in order to raise the inefficient companies to efficiency level. For instance, under the condition of variable returns to scale, the companies should decrease their cost of compressed air by 63% in order to reach the efficiency level. In the industry under study, in variable returns to scale, electricity and natural gas have been used inefficiently and gaso6 line has been used efficiently in comparison to other input variables. The rate of decrease in energy consumption to reach the efficiency level in all the energy indices is higher than 50 percent, which is indicative of the high potential of this industry to reduce energy consumption.
In order to attain the goal of increasing the efficiency, the data envelopment analysis model introduces a series of efficient companies as references to the inefficient ones. Table 6 shows the inefficient companies and the set of reference companies for each inefficient company.
With regard to the results of the model in Table 6, for each inefficient company, reference companies have been specified, and the managers of the inefficient companies can raise their companies to the efficiency level by benchmarking the reference group set and be listed in the efficient companies' portfolio. Furthermore, by using the values of the input and output variables of the efficient companies, it will be possible to calculate the ratio of the improvement of the inefficient companies. These ratios serve as guidelines for the inefficient companies to become efficient by decreasing the input values with regard to the values of the input variable of the reference companies.
Conclusion
The present research has evaluated the energy efficiency of each of the companies active in the automotive and auto-parts producing industry by using the 6-year average of four variable inputs as the indices of energy, and by applying data envelopment analysis. Also, it has studied the energy efficiency of the mentioned industry through the years 2003-2008. The results show that on average, in the variable returns to scale method, the companies need to increase their efficiency by 42.3 percent in order to reach 100 percent efficiency, and in the constant returns to scale method, they need to increase it by 73.5 percent. In order to raise their efficiency to 100 percent, the inefficient companies should focus on the compensation percent of their input variable and also study the energy saving methods and production technology of the reference companies, thereby approximate their efficiency to that of the reference companies. The results obtained from the evaluation of energy efficiency in the industry under study shows the regressive trend of efficiency during the years 2003 through 2008. In order to improve the energy efficiency in the automotive and auto-parts producing industry, the companies active in this industry need to improve their production methods, energy saving techniques and management of energy consumption. The government, too, should employ energy saving policies for this industry.
References
Azadeh, A., Amalnick, M.S., Ghaderi, S.F & Asadzadeh, S.M. (2007). An integrated DEA PCA numerical taxonomy approach for energy efficiency assessment and consumption optimization in energy intensive manufacturing sectors, Journal of Energy Policy, 35(7), 3792-3806. [ Links ]
Banker, R. D., Charnes, A. & Cooper, W. W. (1984). Some models for estimating technical and scale inefficiencies in data envelopment analysis. Journal of Management Science, 30(9), 1078-1092. [ Links ]
Bian, Y. & Yang, F (2010). Resource and environment efficiency analysis of provinces in China: A DEA approach based on Shannon's entropy. Journal of Energy Policy, 38, 1909-1917. [ Links ]
Boyd, G. A. & Pang, J. X. (2000). Estimating the linkage between energy efficiency and productivity Journal of Energy Policy, 28(5), 289-296. [ Links ]
Chang, T.P & Hu, J.L. (2010). Total-factor energy productivity growth, technical progress, and efficiency change: An empirical study of China. Journal of Applied Energy, 87, 3262-3270. [ Links ]
Chauhan, N.S., Mohapatra, PK.J. & Pandey, K.P (2006). Improving energy productivity in paddy production through benchmarking-An application of data envelopment analysis. Journal of Energy Conversion and Management, 47, 1063-1085. [ Links ]
Filippín, C. (2000). Benchmarking the energy efficiency and greenhouse gases emissions of school buildings in central Argentina. Journal of Building and Environment, 35(5), 407-414. [ Links ]
Honma, S. & Hu, J.L. (2008). Total-factor energy efficiency of regions in Japan. Journal of Energy Policy, 36, 821-833. [ Links ]
Hu, J.L. & Kao, C.H. (2007). Efficient energy-saving targets for APEC economics. Journal of Energy Policy, 35(1), 373-382. [ Links ]
Lee, S.K., Mogi, G., Lee, S.K., Hui, K.S. & Kim, J.W. (2010). Econometric analysis of the R&D performance in the national hydrogen energy technology development for measuring relative efficiency: The fuzzy AHP/DEA integrated model approach. Journal of Hydrogen Energy, 35, 2236 - 2246. [ Links ]
Lee, W.S. (2008). Benchmarking the energy efficiency of government buildings with data envelopment analysis. Journal of Energy and Buildings, 40, 891895. [ Links ]
Malana, N.M. & Malano, H.M. (2006). Benchmarking productive efficiency of selected wheat areas in Pakistan and India using data envelopment analysis. Journal of Irrigation and Drainage, 55(4), 383-394. [ Links ]
Mandal, S.K. (2010). Do undesirable output and environmental regulation matter in energy. Journal of Energy Policy, 38(10), 6076-6083. [ Links ]
Mukherjee, K. (2008). Energy use efficiency in the Indian manufacturing sector: An interstate analysis. Journal of Energy Policy, 36, 662-672. [ Links ]
Mukherjee, K. (2008). Energy use efficiency in U.S. manufacturing: A nonparametric analysis. Journal of Energy Economics, 30(1), 76-96. [ Links ]
Nassiri, S.M. & Singh, S. (2009). Study on energy use efficiency for paddy crop using data envelopment analysis (DEA) technique. Journal of Applied Energy, 86, 1320-1325. [ Links ]
Omid, M., Ghojabeige, F, Delshad, M. & Ahmadi, H. Energy use pattern and benchmarking of selected greenhouses in Iran using data envelopment analysis. Journal of Energy Conversion and Management, Article in Press, Corrected Proof. [ Links ]
Önut, S. & Soner, S. (2006). Energy efficiency assessment for the Antalya Region hotels in Turkey. Journal of Energy and Buildings, 38, 946-971. [ Links ]
Önut, S. & Soner, S. (2007). Analysis of energy use and efficiency in Turkish manufacturing sector SMEs. Journal of Energy Conversion and Management, 48, 384-394. [ Links ]
Ramanathan, R. (2000). A holistic approach to compare energy efficiencies of different transport modes. Journal of Energy Policy, 28(11), 743-747. [ Links ]
Ramanathan, R. (2005). An analysis of energy consumption and carbon dioxide emissions in countries of the Middle East and North Africa Journal of Energy, 30(15), 2831-2842. [ Links ]
Rao, D.S.P, O'Donnell, C. J. & Battese, G.E. (2003). Metafrontier Functions for the study of Inter-regional productivity Differences. Centre for Efficiency and Productivity Analysis, School of Economics, The University of Queensland, Working Paper No. 01. [ Links ]
Shang, I. & Sueyoshi. T. (1995). A unified Framework for the selection of A Flexible Manufacturing System. European Journal of Operational Research, 85, Issue (Month): 2, 297-315. [ Links ]
Shi, G.M., Bi, J. & Wang, J.N. (2010). Chinese regional industrial energy efficiency evaluation based on a DEA model of fixing non-energy inputs. Journal of Energy Policy, 38(10), 6172-6179. [ Links ]
Wei, Y.M., Liao, H. & Fan, Y. (2007). An empirical analysis of energy efficiency in China's iron and steel sector. Journal of Energy, 32, 2262-2270. [ Links ]
Yeh, T.l., Chen, T.y. & Lai, Py. (2010). A comparative study of energy utilization efficiency between Taiwan and China. Journal of Energy Policy, 38, 2386-2394. [ Links ]
Zhou, P & Ang, B.W. (2008). Linear programming models for measuring economy- wide energy efficiency performance. Journal of Energy Policy, 36(8), 2911-2916. [ Links ]
Received 13 August 2011
Revised 9 October 2012

