


Servicios Personalizados
Articulo
 Inglés (pdf)
 Articulo en XML
 Referencias del artículo
Indicadores

Links relacionados
-
 Citado por Google
 -
 Similares en Google
Compartir

 Permalink
Journal of the South African Institution of Civil Engineering
versión On-line ISSN 2309-8775
versión impresa ISSN 1021-2019
J. S. Afr. Inst. Civ. Eng. vol.66 no.1 Midrand mar. 2024
http://dx.doi.org/10.17159/2309-8775/2024/v66n1a3
TECHNICAL PAPER
A comparison of traditional road safety assessment methods and the newly developed 'road safety deserts' approach
M J W A Vanderschuren; A G Newlands
ABSTRACT
Road fatalities were labelled a pandemic as early as 1973 (BMJ 1973). The number of road fatalities reached 1.35 million in 2016. Currently over 3 500 people perish every day on the world's roads. South Africa has one of the highest road fatality rates in the world, with a fatality rate of 25.9 deaths per 100 000 population (WHO 2018). In order to understand and improve the road safety situation of a region, effective road safety assessments must be carried out. This paper presents a comparison of four different road safety assessment approaches, both traditional and novel, and serves as a proof of concept for the 'road safety desert' methodology, a new technique adapted from the 'transit desert' concept. This new approach to road safety assessment explores the possibility of geo-coded supply and demand comparisons to identify 'road safety deserts' - areas that have a comparatively higher road safety risk. This paper shows that there are several unique and effective ways to assess road safety, and that each approach incorporates different characteristics within their methodologies. It is recommended that road safety analysis is conducted using a multitude of methods, so as to improve understanding and intervention selection.
Keywords: road fatalities, deserts, road safety deserts, road infrastructure, Cape Town
INTRODUCTION
"Road traffic deaths upend countless lives and cost countries around 3% of GDP each year," notes Dr Etienne Krug, Director of the Department for Social Determinants of Health, of the World Health Organisation (WHO). "This is an unacceptable price to pay for mobility. Putting safety at the heart of our mobility systems is an urgent health, economic, and moral imperative" (WHO 2022). Although road fatalities were labelled a pandemic as early as 1973 (BMJ 1973), fatalities have continued to climb, reaching a staggering 1.35 million in 2016. "The data shows that low- and middle-income countries bear the greatest burden of road traffic fatalities and injuries" (WHO 2018). Currently, over 3 500 people perish every day on the world's roads.
While many developing nations have been successful in reducing the number of road fatalities, the pandemic persists in Africa. Based on data released by the WHO in 2013 (WHO 2013), Vanderschuren and Zuidgeest (2017) determined that the average fatality rate in Africa is 24.1 fatalities per 100 000 population, which is substantially higher than the global fatality rate of only 17.0 fatalities per 100 000 population. Between 2010 (WHO 2013; Vanderschuren & Zuidgeest 2017) and 2016 (WHO 2018), road fatality rates in South Africa have reduced from 31.9 fatalities per 100 000 population to 25.9 fatalities per 100 000 population. Although this is a significant reduction, the rate of decrease is not nearly enough to meet the global and South African target of -50% fatalities in absolute terms between 2010 and 2020 (WHO 2018). Based on the latest Road Traffic Management Corporation (RTMC) data (RTMC 2022), the current fatality rate is approximately 20.5 fatalities per 100 000 population. This is mainly due to a continuing growth in population and stabilising absolute fatality rates.
According to the WHO (2018), 29% of all fatalities worldwide are car occupants, 28% motorised two- and three-wheelers, and 26% pedestrians. A total of 44% of all fatalities in the African region are pedestrians and cyclists, i.e. the most vulnerable road users. The second-largest group of fatalities in Africa are car occupants (40%), making it the region with the second-highest driver and passenger fatality rate (WHO 2018). The large number of (informal) public transport services on Africa's roads make a significant contribution to these values. The burden of road-related fatalities is very high in these low- and middle-income countries, as they have 93% of the world's fatalities and only 60% of the world's vehicles (WHO 2018). Given the growth in vehicle population, there is a likelihood that road fatalities on the African continent will continue to grow.
In order to understand and improve the road safety situation of a region, and thus decrease the number of road traffic crashes and fatalities through appropriate interventions, effective road safety assessments must be carried out. This paper investigates and discusses four approaches to assessing the state of road safety in an area. This paper also serves as a proof of concept for the 'road safety desert' methodology, a new analysis technique adapted from the 'transit desert' concept. From a transport justice point of view, this new approach to road safety assessment explores the possibility of using supply and demand comparisons per geographical area to identify 'road safety deserts' - areas that have a comparatively higher road safety risk than other areas.
METHODOLOGY
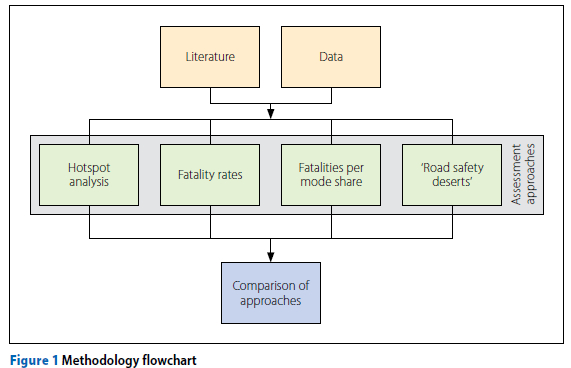
Based on a literature review and available data, a comparison of four different road safety assessment approaches was completed (see Figure 1). These four approaches are hotspot analysis, fatality rates, fatalities per mode share, and 'road safety deserts', a novel theory detailed in this study.
A literature review, including the authors' previous work, was conducted for the first three approaches to identify their key characteristics and calculation steps, and an example of a previous application of each approach was detailed. For the fourth approach, literature on earlier 'desert' theories ('food deserts' and 'transit deserts') was reviewed to inform the development of the 'road safety desert' theory and calculation process.
Based on data availability, specifically geo-coded information regarding road fatalities, the chosen case city for this research was Cape Town. Cape Town is the largest city in the Western Cape Province, and the second-largest metropolitan area, by population size, in South Africa (CoCT 2015a). The city continues to expand rapidly, with the population estimated to grow from 4 758 433 inhabitants in 2021 to 5 133 369 inhabitants in 2025 (Western Cape Government 2021). Cape Town has an average density of 1 915 persons/km2, which is relatively low compared to other major cities (Western Cape Government 2021). This density varies significantly within certain suburbs of Cape Town, with more affluent areas having much lower densities than poorer areas (Vanderschuren et al 2022).
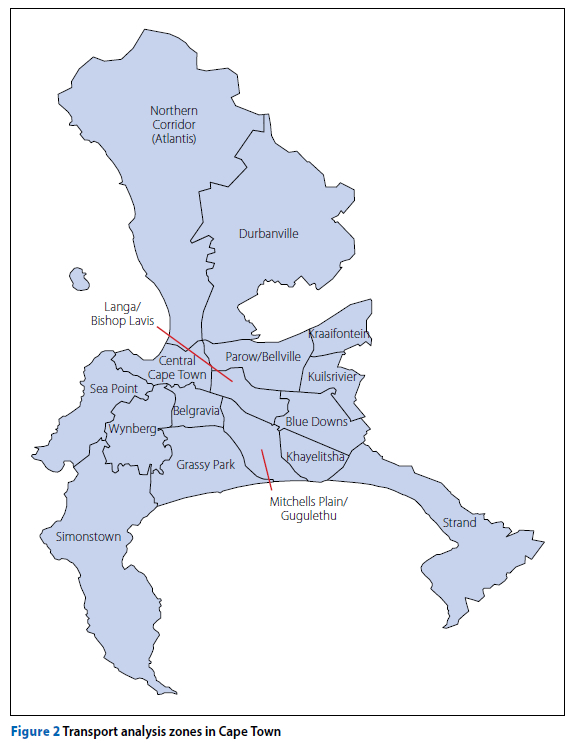
In this study, the City of Cape Town (CoCT) was separated into 16 transport analysis zones (TAZs), which are the smallest geographical areas used for city-wide travel demand model forecasting (see Figure 2 on page 21).
Road fatality data was sourced from the CoCT Forensic Pathology Laboratory (FPS) database and the Integrated Provincial Analysis System (iPAS) for 2011 - 2015 (CoCT 2015b). Data from the 2013 National Household Travel Survey (NHTS) was used to determine mode share and population counts (StatsSA 2013). The 'road safety desert' approach in this paper assesses road safety with respect to motorised and non-motorised transport.
The calculation process for each approach is detailed and applied to the case city, Cape Town. A comparison is then made between the four approaches, which is discussed further, followed by conclusions and recommendations.
HOTSPOT ANALYSIS
Background
A hotspot (or black spot) is a "location that has a higher expected number of crashes than similar locations, as a result of local risk factors" (TRACECA 2015). Hotspot analysis is an approach to road safety assessment that identifies these hazardous locations and enables targeted infrastructure implementations to be carried out to improve the safety of each location.
The definition of a hotspot differs internationally. For example, in Norway a hotspot is defined as any location, 100 m long, where a minimum of four crashes resulting in injuries have occurred during the past five years. In Switzerland, a hotspot on a motorway is any site (up to 500 m long) that has recorded a minimum of ten crashes, four injuries, and two fatalities within the last two years (Elvik 2008). These international classifications cannot be transferred directly to the South African context, as the state of road safety in South Africa is much worse. For example, Vanderschuren et al (2017a) found one location in Cape Town where 618 crashes occurred within a 100 m2 area in one year, while Gregory and Jarret (1994), in a study done in England, defined an area as a high-risk site if only 20 crashes were recorded over three years on a 100 m length of road. This illustrates that the road safety problem is much more severe in South Africa, and therefore an appropriate classification of hotspots needs to be defined for this context.
Hotspot application for the case of Cape Town
In 2017, a hotspot analysis was conducted for Cape Town (Vanderschuren et al 2017a). Geo-coded fatality data from iPAS and the CoCT's FPS database for 2015 was used in this analysis. This led to the use of the 'fishnet' tool in GIS, which clusters fatalities that occurred at the same location, i.e. hazardous locations or hotspots. The area size used was 100 m by 100 m, in accordance with international best practice (Elvik 2007). This was verified for the South African context via Google Earth where a typical South African intersection size was found to be approximately 100 m2. This area size, therefore, reduces the chance of links in the road network being included/ combined with the intersection area. As crossing traffic represents conflicts that could potentially lead to road crashes and fatalities, the authors wanted to ensure that intersections could be identified (Vanderschuren et al 2017a).
Fatality locations were plotted on a map of Cape Town, and a preliminary analysis of this map found that many fatalities occurred in the same location. It is important to note that the city questioned the accuracy of the location data. The authors are not in a position to verify the accuracy. While the authors (Vanderschuren et al 2017a) recommended that the accuracy of geo-location data be improved for practical application in South Africa, the method is conceptually sound and proven in multiple locations around the world.
For completeness, Figure 3 shows the top ten hazardous locations in Cape Town based on the 100 m × 100 m 'fishnet' tool approach. Fatalities were ranked into hotspots, listing the areas with the most fatalities in one year (in this case, the year 2015).
FATALITY RATES
Background
Absolute fatality numbers, while being useful for locating hotspots and implementing targeted interventions, do not allow for accurate comparisons of road safety across different regions with different populations and vehicle numbers. Fatality rates, such as fatalities per 100 000 population, crashes per 10 000 vehicles, and crashes per vehicle kilometres travelled, allow for this cross-regional comparison to occur. Road fatality rates per 100 000 population are commonly used by the WHO, who defines a road traffic fatality as "any person killed immediately or dying within 30 days as a result of a road traffic accident" (WHO 2013). While this definition is also used in South Africa, the total number of fatalities recorded may not be completely aligned with this definition. This is partly due to the fact that fatalities that occur days after a road traffic accident (and not immediately at the scene of the crash) are often not recorded as a road traffic fatality, due to poor feedback processes between the police and hospitals.
Fatality rate application for the case of Cape Town
A study completed by Vanderschuren et al (2017a) used road fatalities per 100 000 population to assess the state of road safety in Cape Town, using transport analysis zones (TAZs) as the geographical areas to be assessed (see Figure 2). Total fatality data, obtained from CoCT's FPS for 2011 -2015 (CoCT 2015b), was converted to average annual fatalities per 100 000 population per mode for each TAZ (see Figure 4 where the pie chart size indicates the total number of fatalities). The reader should note that, while the FPS data should be closely aligned to the definition of a road fatality, as defined by the WHO (2013), there is no guarantee. The authors, therefore, caution regarding direct comparison of the WHO and local fatality rates.
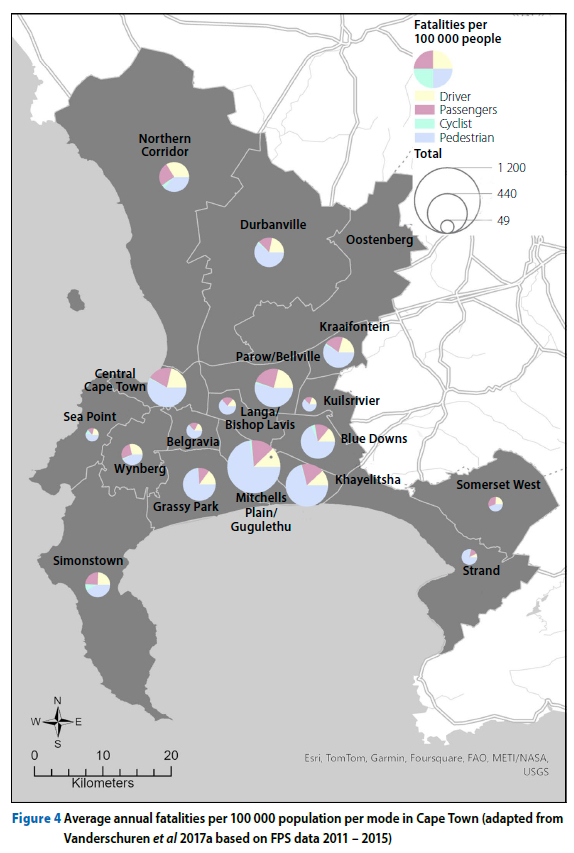
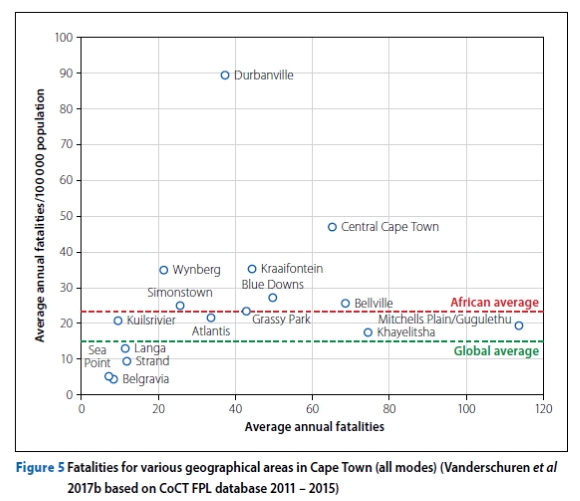
An interesting finding of the study by Vanderschuren et al (2017b) was the significant differences between absolute fatalities per TAZ, compared to the fatality rates per 100 000 population. This is illustrated in Figure 5. Without going into too much detail regarding the results, it is very clear that the TAZ that needs intervention based on absolute fatalities (Mitchells Plain, which is a high-density suburb) differs from the TAZ based on fatality rates per 100 000 population (Durbanville, a suburb with some major mobility corridors that are less congested and, therefore, have higher speeds and, hence, more fatalities, than mobility corridors closer to the CBD of Cape Town).
FATALITIES PER MODE SHARE
Background
Fatality rates (per mode) cannot be expected to be homogeneous across a TAZ or road category. For example, in the European setting, where conducive secondary and tertiary road networks are available, pedestrian fatalities on freeways hardly occur. This is because the mode (pedestrian) is absent in this environment. Based on this insight, it is likely that road fatalities are related to the mode share in an area. This is investigated in this section.
Fatalities per mode share application for the case of Cape Town
Vanderschuren et al (2017a) combined the analysis of mode distribution per TAZ and fatalities to calculate fatalities per mode share. The percentage difference between mode distribution and absolute fatalities (Y) is used. The percentage mode share was subtracted from the percentage of fatalities for that mode to generate a delta value.
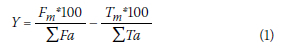
Where:
Fm = absolute fatalities
Tm = trips per mode.
Figure 6 shows the results for the various modes. In this method, "... a positive difference indicates that the percentage death toll for the road user type is higher (unwanted) when compared to the percentage of the population that utilises that particular mode, for their daily trips and vice versa ..." (Vanderschuren et al 2017a:18).
THE 'DESERT' APPROACH
Background
Over the past three decades, the equitable distribution of goods and services has been assessed via the 'desert' concept. In the academic literature, 'desert' is based on a comparison of supply and demand, while correcting for the area size (Clarke et al 2002; Whelan et al 2002; Wrigley et al 2002; Ver Ploeg et al 2011).
The 'food desert' concept started in the early 1990s, when a resident in the United Kingdom (UK) used the term 'food desert' for the first time. In 1995, the term was first adopted by the UK government (Beaumont et al 1995). Food deserts are characterised by areas where residents that do not have access to private cars or who are unable to access/afford public transport, are forced to shop at corner shops where prices are high and fresh produce is scarce, as opposed to more affordable supermarkets with healthy produce that are usually further away (Ver Ploeg et al 2011; Jiao & Dillivan 2013).
In the field of transport, the desert theory was first applied by David Hulchanski of the University of Toronto, who investigated 'transit deserts' in his Three Cities report (Hulchanski 2010). Jiao and Dillivan (2013) and Jiao (2017) refined the transit desert theory and defined "areas that lack adequate public transit service, given its contained population that is deemed transit dependent". The aim of the food desert methodology can be reworded to describe the aim of the transit desert methodology, namely "to achieve equitable access to high-quality, affordable public transport for everyone" (Newlands 2020). Vanderschuren et al (2021) then transferred and applied the transit desert theory to the South African context, proving that the methodology can be adapted and applied in different contexts, including cities in the global south.
This paper uses the knowledge gained by the authors regarding 'transit deserts' and adapts the theory to the field of road safety, investigating the possibility of using supply and demand comparisons per geographical area, with the aim to identify 'road safety deserts'. This 'road safety desert' methodology is useful in assessing the state of road safety in an area through the lens of justice, as it compares areas within the same region to each other, enabling the determination of the risk level of an area compared to the region's average.
As the application of 'road safety deserts' is novel, this section includes a more elaborate description of the calculations. For the previous sections, readers can refer to the literature for further calculation details.
Safety value calculation
The equations used to calculate the safety value per TAZ are provided in Equations 2, 3 and 4. Firstly, the demand for transport is calculated. This study utilises the available trips as per the National Household Travel Survey (NHTS) (StatsSA 2013). The demand (D) is determined by comparing the number of trips (Tm) to all trips (Ta) in a TAZ. In a similar way, the safety (S), based on iPAS data, is calculated by dividing fatalities per mode (Fm) by the total number of fatalities (Fa) in a TAZ. The final safety value (B) is determined by subtracting safety (S) from demand (D).
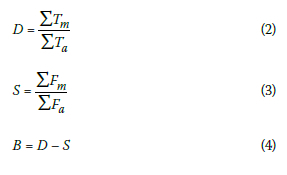
Supply quality value calculation
The supply quality value is calculated using infrastructure-related information in the iPAS system and is an indication of the overall road quality in each TAZ. The following attributes are included: built-up area (X1); junctions (X2); street lighting (X3); obstructions (X4); road alignment (X5); road marking type (X6) and condition (X7); road sign condition (X8); road surface type (x9), quality (x10) and condition (x11); cross-section characteristics (X13) and speed (X14). All supply quality attributes are currently included in a binary manner. For example, dry road conditions are assumed to be superior (positive) to all other road surface conditions (wet/water, loose gravel/sand, ice, snow, slippery). As for demand, the portion of good road supply is calculated.
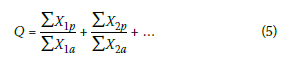
This paper currently does not include characteristics related to traffic signals, as research on this attribute is still under way. The equation used to calculate the supply quality value per TAZ is provided in Equation 5. The overall supply quality value (Q) is the sum of all attributes (xn), where the total positive cases (Ʃ,xnp) is divided by all cases (ƩXna).
Overall safety desert value calculation
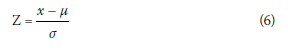
The Z-value calculation can begin once the results for safety (b) and supply quality (q) have been determined.
The safety and supply quality values are converted into Z-values to standardise the criteria. The Z-value indicates how many standard deviations (a) a TAZ is from the mean (average of all TAZs). In other words, a Z-value is a numerical measurement, used in statistics, where the value (x) is compared to the average of a group (μ). If a Z-value is 0, it indicates that the data point is identical to the mean value (Heyes 2019) (see Equation 6).
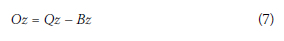
The next step is to subtract the safety values from the supply quality values to calculate the overall safety desert Z-value (Oz) for each TAZ (see Equation 7).
In this study, a positive overall safety desert value indicates that there is a lower road safety risk than the risk for the average Capetonian (group value). A negative final Z-value, on the other hand, reflects a less safe environment, i.e. a higher road safety risk. This methodology is similar to the way 'transit deserts' were identified in the literature but has been adapted to suit the field of road safety (Hulchanski 2010; Jiao & Dillivan 2013; Jiao 2017; Vanderschuren et al 2021).
'Road safety desert' application for the case of Cape Town
For the case study using Cape Town, the identification of 'road safety deserts' was done by subtracting the safety Z-values (BZ) from the supply quality Z-values (Qz), applying the methodology described in the previous section. Analysis zones with a higher overall road safety risk had Z-values below zero, and a 'road safety desert' was classified as a zone with a Z-value below negative two.
Figure 7 (motorised transport) and Figure 8 (non-motorised transport) show the Z-values for all TAZs in Cape Town, for supply quality (Qz), safety (-Bz) and the overall (Oz) safety desert values. To make it easier for the reader to understand the information displayed, the authors display the negative safety (-Bz) in the remainder of this paper.
As space is limited, only the results for motorised transport (Figure 7) will be discussed. The results for non-motorised transport (Figure 8) can be interpreted similarly. Ten TAZs (63% of zones analysed) in Cape Town were classified as having a higher overall road safety risk. Half of these zones have overall Z-values below negative one, which indicates a significantly high overall safety risk (see Figure 7c). No TAZ was identified as a 'road safety desert', as none of the Z-values are below negative two. However, one area (the Northern Corridor) has a value of -1.93 and is very close to being identified as a 'road safety desert'.
Analysis zones with a lower overall road safety risk had Z-values above zero, and a road safety 'utopia' was classified as a zone with a Z-value above positive two. Figure 7c also shows the TAZs in Cape Town with a low overall road safety risk, when compared to the other TAZs. Six TAZs (37% of zones analysed) were classified as having a lower overall road safety risk (Figure 7c). Four of these zones had overall Z-values above one, which indicates a significantly low overall safety risk.
DISCUSSION
This paper describes various road safety assessment tools that can be used to reduce the road safety burden in South Africa and beyond. Some tools use absolute fatalities as an output to assess the situation, while others convert the information to fatality rates, either per 100 000 population or per land area. Numerous literature items and tools argue that fatalities need to be analysed per mode, to improve the identification of measures. In the case of the 'road safety desert' theory, social justice and infrastructure characteristics are included in the methodology. Table 1 provides an overview of the characteristics included in the described road safety approaches.
All methods are based on absolute fatality rates. In the case of hotspots, these absolute numbers are used to identify locations that require road safety interventions, for example infrastructure improvements. While not demonstrated in this paper, hotspot analysis can be conducted per mode.
Fatality rates, as defined by the WHO (2013), convert absolute fatalities into rates per 100 000 population. In some cases, this is done for the various modes of transport, although this was not demonstrated in this paper. Displaying fatality rates per geographical areas does bring in a social justice component.
Fatalities per mode share is not a common tool. Although already applied in 2017, this approach has not been followed internationally. If applied per location (TAZ), the fatalities per mode provide a social justice aspect. In this paper the fatalities for drivers, passengers, pedestrians and cyclists are displayed, indicating which TAZ has an over- or under-representation of fatalities.
In this study, 'road safety deserts' have been established for the first time. The theory development is based on earlier work related to 'food deserts' (Clarke et al 2002; Whelan et al 2002; Wrigley et al 2002) and 'transit deserts' as described by Hulchanski (2010), Jiao and Dillivan (2013), Jiao (2017) and Vanderschuren et al (2021). Social justice is at the core of the methodology, while land area and infrastructure are part of the approach. Although not displayed in this paper, the method can be conducted for various modes. The paper includes motorised and non-motorised transport as an example.
The four approaches described in this paper each have a unique method in identifying locations where interventions are needed to reduce road fatalities. No approach is superior to another, and each approach results in valuable information about the road safety status quo of an area.
CONCLUSIONS AND RECOMMENDATIONS
This paper presents a comparison of four different road safety assessment approaches, i.e. three traditional approaches and the novel 'road safety deserts' approach. The methodologies of these four approaches have been discussed and applied to the City of Cape Town as an example of how they are used. The methodologies were then compared with one another, looking at characteristics such as land area, modes, social justice and infrastructure characteristics. The 'road safety desert' method includes more indicators. However, the traditional methods also have their place. The authors conclude that applying multiple methods increases the opportunities to combat road fatalities. Each of the included methods have a role to play.
The 'road safety desert' methodology is a new road safety assessment approach introduced in this paper. Both calculations in this methodology - safety and supply quality values - need further validation and fine-tuning. Vanderschuren et al (2021) identified that "the use of large TAZs hinders the development of detailed transit supply action plans". This study, similarly, uses large TAZs, due to data limitations. As smaller analysis zones are more conducive to the identification of detailed action plans, it is recommended that disaggregated transport information generated in the South African context be identified. From a road safety perspective, geographical coordinates would be optimal. It is, therefore, recommended that future applications of this methodology make use of smaller analysis zones to improve the accuracy of the results.
Additionally, the safety and supply quality calculations could differ, depending on the mode. For example, the current road supply quality characteristics are appropriate for assessing motorised transport, specifically. When performing the 'road safety desert' analysis for pedestrians, certain supply characteristics, such as the number of pedestrian crossings or the length of pedestrian walkways, should be included so that the supply quality value is accurate for that mode. In the current raw data, this information is not available. It is recommended that municipal asset registers, as well as the road safety database, add such information.
It must also be mentioned that safety value calculations in the 'road safety desert' method are based on trip-making by residents. Trips in practice go across TAZs, as the origin and destination of trips are not necessarily in the same TAZ. However, this is also the case regarding 'food desert' (Beaumont et al 1995; Clarke et al 2002; Whelan et al 2002; Wrigley et al 2002; Ver Ploeg et al 2011) and 'transit desert' (Hulchanski 2010; Jiao & Dillivan 2013; Jiao 2017; Vanderschuren et al 2021) calculations, as reported by various authors. The authors of this paper acknowledge that, in the case of tourists, events or other attractions, the use of resident-based mode share may hamper the accuracy of the calculations. In these cases, traffic counts that include drivers, passengers and pedestrians are recommended.
Within the 'road safety desert' approach, this paper uses the term 'utopia' for areas that demonstrate a much lower road safety risk than the risk for the average Capetonian. Although from a local context this terminology may be appropriate, the authors feel strongly that 'utopia' is only achieved once all road fatalities are eliminated globally.
Overall, this paper shows that there are several unique and effective ways to assess road safety and that each approach incorporates different characteristics within their methodologies. It is therefore recommended that road safety analysis is conducted using a multitude of methods, including hotspot analysis, fatality rates, and fatalities per mode share, as well as 'road safety deserts', mining the data to such an extent that an improved understanding is gained. This will lead to the best possible improvement approach.
ACKNOWLEDGEMENTS
The authors would like to thank Mr Robert Cameron for his work on applying the transit desert methodology to South Africa, and would like to acknowledge the Western Cape Road Safety Study completed in 2017 by Vanderschuren et al for its work on mode share and fatalities. Additionally, the authors would like to thank the Western Cape Government for access to the geo-coded road safety data via the Provincial Analysis System (iPAS). This work is based on research supported by the National Research Foundation of South Africa and the Council of Scientific and Industrial research (Grant Number 138142).
REFERENCES
Beaumont J, Lang T, Leather S & Mucklow C 1995. Report from the policy sub-group to the Nutrition Task Force Low Income Project Team of the Department of Health. Radlett, Hertfordshire, UK: Institute of Grocery Distribution. [ Links ]
BMJ (British Medical Journal) 1973. Road accidents epidemic. British Medical Journal, 17 (February 1973): 370-371. [ Links ]
CoCT (City of Cape Town) 2015a. City of Cape Town Cycling Strategy. Cape Town: Transport and Urban Development Authority. [ Links ]
CoCT 2015b. Forensic Pathology Laboratory. Data: 2011-2015. Cape Town Wide Database. [ Links ]
Clarke, G, Eyre, H & Guy, C 2002. Deriving indicators of access to food retail provision in British cities: Studies of Cardiff, Leeds, and Bradford. Urban Studies, 39: 2041-2060. [ Links ]
Elvik, R 2007. State-of-the-art approaches to road accident black spot management and safety analysis of road networks. Report 883. Oslo, Norway: Institute of Transport Economics. [ Links ]
Elvik, R 2008. A survey of operational definitions of hazardous road locations in some European countries. Accident Analysis and Prevention, 40: 1830-1835. [ Links ]
Gregory, M & Jarrett, D F 1994. The long-term analysis of accident remedial measures at high-risk sites in Essex. Traffic Engineering and Control, 35: 8-11. [ Links ]
Heyes, A 2019. Z-Score Definition. Available at: https://www.investopedia.com/terms/z/zscore.asp (accessed on 14 October 2020). [ Links ]
Hulchanski, D 2010. The three cities within Toronto: Income polarization among Toronto's neighborhoods, 1970-2005. University of Toronto. [ Links ]
Jiao, J 2017. Identifying transit deserts in major Texas cities where the supplies missed the demands. Journal of Transport and Land Use, 10: 529-540. [ Links ]
Jiao, J & Dillivan, M 2013. Transit deserts: The gap between demand and supply. Journal of Public Transport, 16: 23-39. [ Links ]
Newlands, A 2020. Public transit deserts in Cape Town and how the minibus taxi industry fills the gap. BSc Eng (Hons) Dissertation. University of Cape Town. [ Links ]
RTMC (Road Traffic Management Corporation) 2022. State of Road Safety Report in South Africa, January 2022 to December 2022. Pretoria: Department of Transport. [ Links ]
StatsSA (Statistics South Africa) 2013. National Household Travel Survey 2013. Pretoria: StatsSA. [ Links ]
TRACECA (Transport Corridor Europe Caucasus Asia Program) Regional Road Safety Project Safety Engineering Team 2015. Regional black spot management guidelines. Geneva, Switzerland: United Nations Economic Commission for Europe. [ Links ]
Vanderschuren, M & Zuidgeest, M 2017 Road Safety and Non-Motorised Transport in African Cities. Cape Town: Routledge. [ Links ]
Vanderschuren, M, Phayane, S, Sinclair, M & Janmohammed, A 2017a. Safety Implementation Framework: Cape Town. Cape Town: Western Cape Government. [ Links ]
Vanderschuren, M, Phayane, S & Janmohammed, A 2017b. Unpacking road safety at a district level: The case of Cape Town. Proceedings, 36th Annual Southern African Transport Conference (SATC 2017), 10-13 July 2017, Pretoria. [ Links ]
Vanderschuren, M, Cameron, R, Newlands, A & Schalekamp, H 2021. Geographical modelling of transit deserts in Cape Town. Sustainability, 13: 997. [ Links ]
Vanderschuren, M, Newlands, A & Wheeldon, A 2022. Improving non-motorized transportation provision in a socially inclusive way: The case of Cape Town. Frontiers in Sustainable Cities, 4: 775339. [ Links ]
Ver Ploeg, M, Breneman, V, Farrigan, T, Hamrick, K, Hopkins, D, Kaufman, P et al 2011. Access to affordable and nutritious food: Measuring and understanding food deserts and their consequences. Eating Right: The Consumption of Fruits and Vegetables, 1-138. doi: https://www.doi.org/10.22004/ag.econ.292130. [ Links ]
Western Cape Government 2021. Socio-economic profile: City of Cape Town 2021. Cape Town: Western Cape Provincial Treasury. [ Links ]
Western Cape Government. iPAS (Provincial Analysis System). Various years. [ Links ]
Whelan, A, Wrigley, N, Warm, D & Cannings, E 2002. Life in a food desert. Urban Studies, 39: 2083-2100. [ Links ]
WHO (World Health Organization) 2013. Global status report on road safety 2013: Supporting a decade of action. Geneva, Switzerland: WHO. [ Links ]
WHO 2018. Global status report on road safety 2018. Geneva, Switzerland: WHO. [ Links ]
WHO 2022. New political declaration to halve road traffic deaths and injuries by 2030 is a milestone achievement. Available at: https://www.who.int/news/item/30-06-2022-new-political-declaration-to-halve-road-traffic-deaths-and-injuries-by-2030-is-a-milestone-achievement (accessed on 28 September 2022). [ Links ]
Wrigley, N, Warm, D, Margetts, B & Whelan, A 2002. Assessing the impact of improved retail access on diet in a food desert: A preliminary report. Urban Studies, 39: 2061-2082. [ Links ]
 Correspondence:
Prof Marianne vandersghuren
Centre for Transport Studies
Civil Engineering Department
University of Cape Town
Private Bag X3
Rondebosch 7701
South Africa
E: marianne.vanderschuren@uct.ac.za
Alexandra Newlands
Centre for Transport Studies
Civil Engineering Department
University of Cape Town
Private Bag X3
Rondebosch 7701
South Africa
E: alexgnewlands@gmail.com

Prof Marianne vandersghuren (CEng, FSAICE, FICE) graduated from three different Dutch universities with a BSc Eng (1989), an MSc Eng (2000) and a PhD (2006). She has over 30 years' experience in the field of transport engineering and (smart) mobility. For more than ten years she worked in the Netherlands at TNO Inro, the Netherlands Organisation for Applied Scientific Research (a sister organisation of the CSIR), before joining the University of Cape Town in 2000. She was the 2022 President of the South African Institution of Civil Engineering, and received the NSTF 2022 Special Theme Award: Basic Sciences for Sustainable Development.

ALEXANDRA NEWLANDS is a Candidate Civil Engineer in the Roads Branch of the Department of Infrastructure, Western Cape Government. She is currently seconded to AECOM and is part of their Geometric Design team. She has recently completed her MSc Eng (Civil) at the University of Cape Town, with distinction. She has a passion for transport engineering and planning in South Africa, and the potential it has for improving both individuals' and society's quality of life. She is interested in road safety, non-motorised transport, public transport, and transport planning as a whole. Master's student at the time of preparing this paper

