


Services on Demand
Article
 English (pdf)
 Article in xml format
 Article references
Indicators

Related links
-
 Cited by Google
 -
 Similars in Google
Share

 Permalink
Journal of the South African Institution of Civil Engineering
On-line version ISSN 2309-8775
Print version ISSN 1021-2019
J. S. Afr. Inst. Civ. Eng. vol.65 n.4 Midrand Dec. 2023
http://dx.doi.org/10.17159/2309-8775/2023/v65n4a5
TECHNICAL PAPER
A climate-impact-related transport infrastructure risk assessment for the City of Cape Town
T E Lane-Visser; M J W A Vanderschuren
ABSTRACT
Climate-related severe weather events pose a threat to transport infrastructure. Damage to transport infrastructure, in turn, threatens access to socio-economic opportunities (such as employment, healthcare and education). The aim of this paper is to quantify the volume of transport infrastructure at risk of weather-related hazards in the City of Cape Town, and to estimate the direct economic value thereof. Geographical Information Systems are used to overlay areas that are highly exposed to climate-related threats on the city's transport network and infrastructure, enabling the identification and quantification of the volume of infrastructure at risk. Cost estimates for the rehabilitation or reconstruction of this infrastructure obtained from various experts in the South African transport arena are applied to calculate the economic value of the infrastructure at risk. In total, the transport infrastructure at high risk in the case city is valued at R20 billion. Fires and coastal flooding pose the greatest threat. The analysis presented can inform planners and decision-makers on how to improve the resilience and where to reduce the vulnerability of transport infrastructure in the city.
Keywords: climate impact, transport infrastructure, risk, GIS, mitigation
INTRODUCTION
The stability and predictability of global temperatures in the postwar era (1940s to 1980s) are things of the past. Annual mean global temperatures have been rising continually, with no definite end in sight. This change in mean temperatures drives changes to the global climate, which in turn affects weather patterns. Weather is defined as the state of the atmosphere at any given time and place, and refers to the temperature, precipitation, clouds and wind that can be experienced throughout the course of a day (EPA 2022). Climate, in turn, is the long-term average of the weather in any given place and can develop over decades or even centuries. Climate also refers to the type, frequency, duration and intensity of weather events experienced, such as heat waves, cold spells, storms, floods and droughts (EPA 2022).
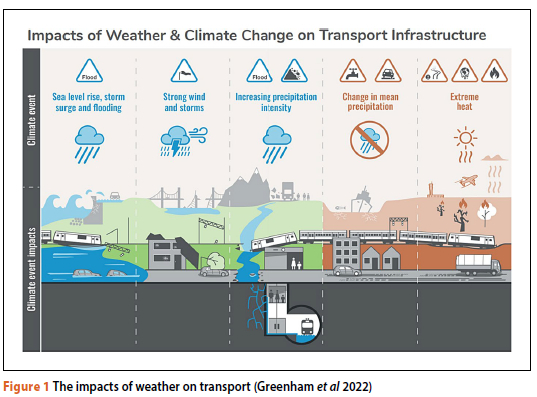
Markolf et al (2019) pointed out that transportation is both directly and indirectly vulnerable to weather and climate impacts. Direct vulnerabilities consist of impacts to physical infrastructure, as well as non-physical impacts on human health, behaviour and decision-making. Indirect vulnerabilities result from transport's interaction with and dependence on other critical infrastructure and social systems, including water, electricity, information and communication, and petroleum systems (Markolf et al 2019). Table 1 concatenates information found in Greenham et al (2022), Asphalt Jungle (2021) and Markolf et al (2019) into a list of transport infrastructure impacts of various climate and weather events, whilst Figure 1 graphically illustrates these impacts.

The City of Cape Town's climate forecast
There are four key climate change challenges confronting Cape Town (the case city) at present: (i) decreased annual average rainfall and a change in the seasonality of rainfall, (ii) increased mean annual temperatures with higher maximum temperatures (more hot days and more frequent and intense heatwaves), (iii) increased average wind strength, and (iv) increased intensity and frequency of storms, leading to short, high-intensity rainfall events and increased size and duration of coastal storms (OneWorld Sustainable Investments 2019). Sea level rise will, additionally, continue to occur. Both the frequency and intensity of the meteorological drivers of sea level rise in Cape Town are expected to increase with global warming (Cartwright 2008). Drought, fire, heatwaves, floods and strong winds, in this particular order, are expected to be the major climate-related risks that Cape Town will face in the future (OneWorld Sustainable Investments 2019).
The frequency of low-rainfall years in the city has already doubled (Wolski 2017), and the eye-opening 'Day Zero Drought' in Cape Town from 2015 to 2017 is still fresh in most Capetonians' memory.
Expected increases in temperature, combined with the effects of increased wind speeds and low humidity, result in the increased fire hazard risk - both for natural (veld) fires and urban fires (OneWorld Sustainable Investments 2019). Greater wind strength and prolonged winds exacerbate challenges for fighting and containing fires that have started, ultimately influencing the potential damage fires can cause. In October 2018, 4 000 people were displaced by a fire in Khayelitsha (Head 2018) and 500 informal dwellings were destroyed in Capricorn Park a week later (Isaacs 2018).
Strong winds are a well-known feature of Cape Town's weather and are expected to increase in severity and frequency going forward. Historical data analysis shows both increasing wind runs, as well as increasing one-hour gust speeds (OneWorld Sustainable Investments 2019). Should this trend continue, it will have significant implications for increasing fire danger on windy days, and the increased possibility of structural damage because of very strong winds. Operations at the Port of Cape Town are adversely affected by the occurrence of strong winds, as evidenced by port closures of 9.5 days in December 2019 and four consecutive days in January 2020 (Goddard 2020).
Cape Town recorded its highest-ever temperature (45.2°C) in January 2022 (Howie 2022). This exceeds the previous maximum by 3°C. Cape Town was the hottest place in Africa on that day. Inspection of historic temperature data for the city from 1950 to 2020 shows that daily temperatures are getting higher and that the peaks are increasing, as time goes by. The number of heatwave days experienced are projected to increase by up to 10 days per year between now and 2050 and by up to 20 days per year between 2070 and 2099 (OneWorld Sustainable Investments 2019).
A study by Dube et al (2021) found that 334 major flood events occurred in the Western Cape between 1900 and 2018. They found that the frequency of floods has increased during the past four decades, compared to the preceding periods, while flooding was mainly concentrated in areas near the coast (Dube et al 2021).
Flooding in June 2008 left 5 500 people homeless on the Cape Flats, only to be followed by floods in July 2008 that affected 16 000 people. Damages worth R1 billion (approximately US$55 million) were caused by floods in the Cape Winelands in November 2008 (Dube et al 2021). The most recent major flood in Cape Town occurred in September 2023, where widespread flooding, landslides and rockfalls forced the closure of all major roads leading into Cape Town (Tsobo & Erasmus 2023). The storm, intensified by climate change, claimed at least 11 lives and forced the evacuation of around 1 000 low-lying homes (Vecchiatto et al 2023). Although Cape Town is predicted to become drier, the seemingly contradictory occurrence of extreme rainfall events is expected to increase, due to changing weather patterns in the region (Van Diemen 2022; OneWorld Sustainable Investments 2019).
The observed rate of sea level rise along the west coast of South Africa over the last few decades was recorded to be 1.87 mm/year, with a rate of +1.48 mm/year recorded on the south coast (DEA 2018). These values are somewhat lower than the global rate of sea level rise. However, the rate of sea level rise along the South African coastline is likely to increase during the 21st century under enhanced levels of global warming, further exacerbating the severity of storm surges and their impacts. The recovery period between storm events is expected to shorten, leaving economies and livelihoods more vulnerable than they already are (OneWorld Sustainable Investments 2019).
This study is not the only one to recognise that climate change poses a threat to the City of Cape Town (CoCT). In 2018, a OneWorld team carried out a study to assess the climate-change-related sectoral hazards, vulnerabilities and risks for the city. The findings of their work are referenced throughout this article and the documentation can be downloaded from https://oneworldgroup.co.za/oneworld-projects/climate-change-assessment-capetown/(OneWorld Sustainable
Investments 2019). Additionally, De Wit et al (2023) published an economic risk assessment of climate change at city level, with Cape Town serving as case study. They considered six forms of capital-at-risk (financial capital, manufactured capital, human capital, intellectual capital, social capital, and natural capital) and identified the suburbs in Cape Town at greatest risk of each type of capital exposure. The city itself commissioned a comprehensive disaster risk assessment in 2009 where they identified various hazards threatening the city, the probability of the hazard occurring, a rating of the expected impact should the hazard occur, and a resilience and vulnerability assessment to guestimate how well the hazard can be coped with. This formed the foundation of the Municipal Disaster Management Plan adopted by the city (CoCT 2015) and included climate-and weather-related hazards such as flooding, droughts and storms, to name a few.
METHODOLOGY
The aim of this analysis is to uncover the extent to which passenger transportation infrastructure, specifically, is exposed to climate-related hazards in the City of Cape Town. The methodology used to determine this risk is depicted in Figure 2. Information on the weather-related hazards threatening the City of Cape Town (CoCT) was collected through a literature review and interrogation of the Green Book, an online tool published by the CSIR (https://riskprofiles.greenbook.co.za/). Spatial data on the extent of public transport, transport infrastructure and pertinent socio-economic infrastructure in the city was obtained from various sources, i.e. documents and industry experts.
Some of the most important opportunities related to passenger transport are accessibility to basic services, including healthcare, education and employment. It was deemed important to determine the extent of certain socio-economic infrastructure in areas of the city exposed to climate-related hazards, and to appreciate the consequences of adverse weather on access to opportunities for residents.
A GIS-based (Geographic Information System) analysis was done to calculate the quantum of transport and socio-economic infrastructure at risk. The results of this analysis were used as inputs for an economic risk analysis, where the value of the transport and socio-economic infrastructure at
risk was estimated. The scope of the analysis was restricted geographically to the city limits and only included passenger transport. Freight transport makes use of the same roads and railways as passenger transport in Cape Town and is, consequently, expected to be affected in a similar manner to passenger transport. Other freight infrastructure, such as the Port of Cape Town, is excluded from the analysis, as the scope of this study is limited to passenger transport. Mutombo et al (2017), however, provides information on the assessment of port infrastructure resilience to climate risks if this is of interest.
Although droughts, heatwaves and strong winds are some of the most critical hazards facing the city, their direct impact on transport infrastructure is not readily apparent, and therefore these hazards have been excluded from further analysis. In comparison to other cities in South Africa, Cape Town is not prone to sinkholes (the formation of which can be exacerbated by droughts), supporting the exclusion of droughts from the analysis. Nevertheless, droughts enhance the potential for fires, and fire-related risks have been estimated. The materials and construction methods typically used in South Africa are resilient when exposed to high temperatures, and the notoriously strong winds experienced in Cape Town are accounted for in infrastructure designs, supporting the exclusion from further analysis of heat waves and strong wind hazards.
TRANSPORT INFRASTRUCTURE RISK ANALYSIS
Determining the extent of risk
Quantifying the transport infrastructure at risk
Spatial data on the CoCT's road network (distinguishing between national and urban roads), minibus taxi routes, stops and ranks, bus rapid transit (MyCiti) trunk and feeder routes, MyCiti trunk stations and feeder stops, regular bus routes operated by Golden Arrow Bus Services (GABS), GABS stops, and the city's railway lines and railway stations was collected. Table 2 lists the data used in the analysis and its sources.

Hazards are defined as "... the potential occurrence of a natural or human-induced physical event that may cause loss of life, injury, or other health impacts, as well as damage and loss to property, infrastructure, livelihoods, service provision, and environmental resources ..." by the Intergovernmental Panel on Climate Change (IPCC 2012).
In 2019, an international research consortium published a study on a climate change hazard vulnerability and risk assessment for the CoCT (OneWorld Sustainable Investments 2019). They determined vulnerability scores for different areas in the CoCT as a function of exposure to hazards and the level of resilience (defined as the capacity of individuals, communities, institutions, businesses and systems within a city to survive, adapt and grow no matter what kind of chronic stresses and acute shocks they experience) (Rockefeller Foundation 2019) of the systems impacted. Exposure, in this context, was defined as the presence (location) of people, livelihoods, environmental services and resources, infrastructure, or economic, social, as well as cultural assets in places that could be adversely affected by physical events and which, thereby, are subject to potential future harm, loss, or damage (Lavell et al 2012). Total exposure per major suburb in Cape Town was calculated as the weighted sum of the following hazards: extreme rainfall days, fire risk areas, fire incidence, heat islands, high fire risk days, inland flood frequency, maximum temperature and mean temperature increase, very hot days, average windspeed, sea level rise inundation risk, and rainfall change percentage. Weighted sum analysis is further explained in Vanderschuren et al (2008).
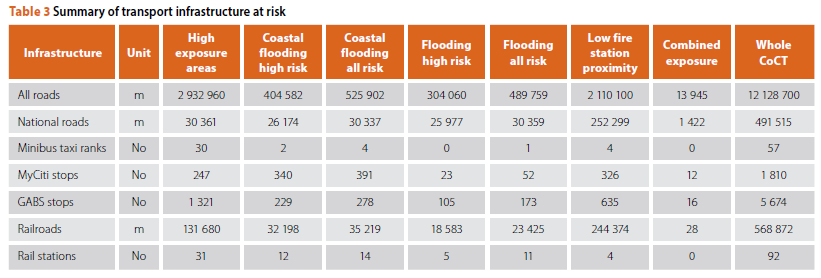
Figure 3 reveals the outputs from their analysis, clearly identifying the suburbs with the highest exposure to climate-related hazards. Using the data in Figure 3, as well as GIS maps of suburbs in the CoCT obtained from the city's Open Data Portal (https://www.capetown.gov.za/City-Connect/All-City-online-services/open-data-portal/), a new GIS layer was created that represents these high-risk suburbs geographically. The various transport and socio-economic infrastructure layers included in the analysis (see Table 2) were overlaid, and the areas of intersection determined. The quantum of infrastructure within the intersection areas was calculated to represent the transport infrastructure at risk of exposure to the combined climate-related hazards included in the OneWorld analysis (OneWorld Sustainable Investments 2019). Table 3 provides a summary of the outputs from this GIS analysis.

Some 24% of all roads within the city fall in the high exposure areas and are, therefore, deemed at risk of damage or destruction, due to adverse climate impacts. Even more concerning is the fact that more than half (52.6%) of all moderately sized taxi ranks in the city are located in these high-risk zones. Additionally, 13.6% of MyCiti stops and stations and 23% of GABS bus stops are highly exposed, whilst a third of all rail stations and 23% of railway tracks are located in high-risk areas. A low percentage of the national roads contained within the CoCT limits run through high-risk areas (6%).
In addition to this analysis, three specific climate-related hazards (coastal flooding, flooding of low-lying areas and fire vulnerability) were modelled individually to highlight their relative risk contributions and the geographical differences between their impacts. Figure 4 displays the geographic distribution of the various hazards analysed in this study.

The coastal flooding data outlines floodplains for five levels of flood risk, ranging from very low to very high. The elevation interval 0.0 - 2.5 m above mean sea level is categorised as very high risk, and 2.5 - 5.0 m as high risk (DEFF 2020). These two categories were combined to represent the areas at high risk of coastal flooding in this analysis. All five coastal flooding categories combined represent all areas in the CoCT with the potential to be affected by coastal flooding. In Cartwright (2008) scenarios based on 2.5 m, 4.5 m and 6.5 m sea level rise events are modelled at probabilities of occurring at 95%, 85% and 20%, respectively. This corroborates the assumption adopted in this study that coastal-adjacent elevations between 0.0 m and 5.0 m above mean sea level are highly exposed. As shown in Table 3, a low percentage of roads (3%), taxi ranks (3.5%), GABS stops (4%) and railroads (5.7%) fall within the coastal flooding high risk areas. However, 18.8% of MyCiti stops (around a quarter of which are on trunk routes) will potentially be impacted by coastal flooding, and 13% of railway tracks, too. Broadening the scope to all areas at risk of coastal flooding, no substantial increase in risk is evident for any mode.
The (non-coastal) flooding data received for low-lying areas in the city comprised seven different risk categories: 2-, 5-, 10-, 20-, 50-, 100- and 200-year flood lines, respectively. A 100-year flood is a statistical designation meaning that there is a 1-in-100 chance that a flood of this size will occur during any given year (Botes 2023). As with coastal flooding, the 2-, 5- and 10-year floodplains were combined into areas deemed at high risk of flooding. All seven flood categories combined represent the total exposure of low-lying areas to flooding in the CoCT.
Table 3 illustrates that the percentage of transport infrastructure at risk of flooding within the city is not high. No minibus taxi ranks of note are exposed to this risk. When all potential flooding risks are considered, the rail stations exposed increases to 12% of the city total, up from 5.4% when only high-risk areas are considered.
The US National Fire Protection Association (NFPA) Standard 1710 establishes a 320-second fire response time, and a goal of less than 10% of incidents being addressed beyond this time frame. Assuming an average travel speed of 60 km/h, fires in areas beyond 5 km from a fire station will thus not be responded to in good time and are, consequently, deemed at high risk. In Cape Town, 82.6% of all roads are within 5 kms of a fire station. Half of national roads and 43% of rail tracks in the city do not, however, fall within this radius. Very few rail stations are at risk (4%), whilst 7% of taxi ranks, 18% of MyCiti stops and stations and 11% of GABS stops are at high risk.
The areas where all four hazards investigated in this study (high risk areas, coastal flooding, flooding, and fire) intersect, were analysed as a final metric, forming the 'combined exposure areas' in Table 3 and are indicated by the green circles in Figure 4. None of the combined risk areas lie beyond 5 kms of a fire station, however. Less than 1% of any transport infrastructure category falls within these areas, but the infrastructure that does, can be regarded as the most exposed infrastructure in the CoCT. This information can be used by the municipality to develop custom mitigation plans for these infrastructure elements. Only two areas in the city are exposed to multiple climate-related hazards, i.e. parts of Paarden Eiland/ Maitland/Brooklyn, and parts of Strand. The high-risk nature of the Paarden Eiland area is particularly problematic, as the N1/M5 highway interchange, as well as railway infrastructure, runs through it. MyCiti trunk and feeder routes, GABS and minibus taxi routes will all be impacted if this road infrastructure is damaged. Issues on the N1, a critical access route to the city centre and harbour, will have devastating repercussions on traffic and transport flow in the CoCT.
The portions of Strand that are at risk are directly adjacent to the coast, with road infrastructure running on the opposite side of it. Depending on the scale of an event, these roadways, and the GABS and taxi services that use them, will be negatively impacted. There are, however, parallel routes that can be used in such an event, and the critical importance of the infrastructure here is not as severe as that in the Paarden Eiland area.
In general, the CoCT's roads are most exposed to fire risks, whilst the MyCiti system is vulnerable to coastal flooding, in particular. Around 15% of rail stations are also exposed to coastal flooding and 43% of rail tracks to fire hazards.
Although Cape Town International Airport is a major transport infrastructure landmark in the city, it does not reside in any of the hazard areas identified in this analysis and is, therefore, excluded from the analysis. Similarly, although the authors are aware that landslides occur on Chapman's Peak and other scenic drives in CoCT from time to time, these (typically elevated) roads do not fall in any of the four hazard zones investigated and have not been included in the analysis.
Quantifying the potential mobility impacts of the CoCT's weather-related hazards
Minibus taxis, the MyCiti BRT system and GABS buses all make use of the road infrastructure in the city. Several routes of each of these public transport systems can make use of the same stretch of road, however. Should adverse weather impacts damage the popular road stretches that are used by multiple service providers or for multiple routes, this will have a more devastating impact than road stretches that are almost never used by these transport operators. The distribution of routes for these three public transport modes is shown in Figure 5, whilst Table 4 presents an overview of how exposed the different road-based public transport services are to the various hazards. The darkest road segments indicate the segments utilised for the most routes, and the shading turns lighter as fewer routes traverse a road segment (Figure 5).
Nearly 27% of minibus taxi routes and 35% of their daily stops lie in high-risk areas. Adverse weather can, thus, cause massive disruption to almost a third of taxi routes in the city. The MyCiti network utilises large portions of the coastline on the Atlantis corridor, yielding around 15% of the network at risk of coastal flooding. The biggest threat to GABS bus services is related to the threats affecting the suburbs that the buses pass through. Around 20% of all taxi and MyCiti routes and 12.5% of GABS routes are not within 5 km of a fire station.
The N2, M7, M18 and R300 are the roadways in the city that service the greatest number of GABS and taxi routes concurrently. MyCiti BRT also uses the N2 on some of its routes. Consequently, these roads are critical in terms of public transport mobility in the city. It is fortunate that none of these routes are exposed to coastal flooding. Portions of the N2 and the M18 do, however, traverse low-lying areas prone to flooding. All of these roadways, but the R300 in particular, border high exposure areas in the city. Weather events impacting these areas could, thus, have dire impacts on public transport service provision in the city. Around 4 km of the M18 is not within 5 km of a fire station, but all the roads are within 10 minutes' reach by fire fighters.
Quantifying the potential socioeconomic impacts of climate-related hazards in the CoCT
Population and employment data from the national 2011 census was used to determine the quantum of the population exposed to climate-related hazards. A staggering 79.6% of Capetonians reside in high-risk areas. This number is alarmingly high, despite the fact that the city has good fire station coverage. Only 2.5% of residents live beyond 5 kms of a fire station. The main threat to residents appears to be settlements located in low-lying areas. Some 45.5% of the population live in areas at high risk of flooding, and a further 11% will be exposed to extreme cases of flooding. Coastal flooding events could potentially impact as much as 28.9% of the population. Employment levels are highly correlated to that of the population. Adverse weather can potentially negatively impact as much as 50% to 80% of the city's labour force.
Combining the network exposure estimates calculated in this study with household income and modal preference data from the 2020 National Household Travel Survey (NHTS) (StatsSA 2020), the potential average income that could be lost to households for each day that adverse weather conditions render the public transport system inoperable, is determined. It is estimated that up to R23.2 million in public transport users' daily income could be at risk in high exposure areas, and that between R2.3 and R7.4 million are exposed to flooding events. Furthermore, the CoCT's economic production per day (measured by its gross domestic product (GDP) contributions) is estimated to be around R5 billion (CoCT 2022). Closures of the transport network in the city threatens productivity in the city and can significantly dampen the city's GDP during the event, as well as during the repair and restitution period following an event.
The healthcare facilities dataset used contains the locations of primary health care facilities (hospitals, clinics and centres for disease control) within the CoCT. Both private and state facilities are included. Education is proxied by a dataset listing all primary and secondary schools in Cape Town.
The analysis shows that 15.2% of the city's schools and 28.8% of healthcare facilities are in high exposure areas. Extreme weather events can, thus, have a substantial impact on access to healthcare and, to a lesser extent, education opportunities in Cape Town. Reduced access to healthcare facilities in times of crisis can exacerbate injury and fatality counts. The greatest climate-related threat to schools, and consequently to education, is fire damage -almost half (49.4%) of schools lie beyond the 5 km safety threshold.
Table 5 summarises the potential quantum of socio-economic impacts related to weather hazards.
Economic evaluation of the extent of risk
Estimating the transport infrastructure value at risk
Road construction cost estimates were obtained from a professional engineer with decades of work experience in this domain. The costs are shown in Table 6. A distinction was made between the typical urban road in the city and the regional and national roads that are normally of greater stature than urban roads. The total volume (km) of each road type exposed to each hazard type (shown in Table 3) was multiplied by the appropriate cost factors to determine the maximum economic risk to transport infrastructure that could occur after extreme weather events in the CoCT. Results from this analysis are listed in Table 7. Both high and all-risk flooding and coastal flooding areas are included. The high-risk values provide a more conservative view, with the all-risk values indicating the potential maximum damage levels that could occur due to flooding events. Three categories of road repairs provide further sensitivity to the analysis. Lesser events, that only incur damage requiring light rehabilitation work afterwards, will incur lower (minimal) costs. This is, however, based on the assumption that all infrastructure of a certain type exposed to a certain hazard is damaged to its fullest extent, which, in itself, provides a maximum value at risk estimate.
Damage requiring heavy rehabilitation is substantially more expensive, and a costing for all infrastructure needing to be rebuilt provides the theoretical maximum economic exposure value. It is assumed that cycling infrastructure repair and reconstruction costs are included in these values, as they typically make use of road infrastructure in South Africa.
In high exposure areas, road infrastructure damage could potentially amount to between R4.6 billion (US$250 million) and R12.1 billion (US$670 million). These values include both urban and national roads. Accounting for the fact that national infrastructure falls under the purview of provincial and national government, the city could still be facing a repair bill of between R4.1 billion (US$230 million) and R9.3 billion (US$520 million) for its urban roads. Flooding risks alone (coastal or other) threaten between R344 million and R1.1 billion of urban road infrastructure, whilst fires could potentially cause between R1.5 billion and R3.5 billion's worth of damage. The value of the most exposed urban road infrastructure is between R12 million and R27 million.
To place these values into context, repairing the road infrastructure damage caused by the devastating floods in KwaZulu-Natal in 2022 was expected to cost around R6 billion (Mabaso 2022).
A BRT cost calculator was provided by a second transport infrastructure specialist and used to determine the costs associated with the construction of BRT infrastructure. The 2010 values provided were converted to 2021 equivalents using the South African Consumer Price Index as published by Statistics South Africa. The value of trunk busways was assumed to comprise asphalt busways with concrete at stations, lane separators in each direction (50 cm separator walls), busway colouration (tyre grip on asphalt), landscaping and bikeways on each side, amounting to R40.56 million/ km. Trunk stations were assumed to have two 5 m wide platforms, passing lanes at stations for express services (one lane in each direction), air conditioning, heating and mist generators, automatic sliding doors at boarding interfaces, two toilet facilities, maps and information kiosks, recycling receptacles at stations and station security in the form of security cameras, costing R13.36 million per station. Feeder routes are shared with roadways in the city and the costs are not allocated to MyCiti. Feeder stops, however, are assumed to cost around R330 000 on average, where a 50/50 split between full shelter stops and double-full shelter stops are assumed in each direction, along with maps.
Table 8 contains the cost estimates for bus and taxi infrastructure at risk in the CoCT. The greatest hazard threatening the MyCiti BRT is coastal flooding, due to the geographical location of the current network. A total of R3.26 billion's (US$180 million) worth of BRT infrastructure is at risk.
GABS routes also share the road infrastructure with other users in the city. The only infrastructure costs isolated for GABS pertain to their stops. BRT calculator values were used to cost the components assumed to be present at each stop. These include an assumed 80% of stops with signposts only and 20% with cantilever shelters and maps. The average cost per GABS stop equates to R56 476. Table 8 shows that R74.6 million's worth of GABS stops infrastructure is in high-risk areas and that fire hazards threaten as much as R35.9 million of GABS infrastructure.
Taxi ranks in Cape Town are split into five categories: super major (more than 35 000 daily departing passengers), major (> 10 000), medium (> 2 000), minor (> 500) and very minor (> 0). Consultants have recorded a cost of R644 000 per loading bay in one of their recent projects. The analysis was restricted to medium, major and super major ranks only, and assumes a more conservative R500 000 per bay, with approximately 20 bays in a medium rank, 100 bays in a major rank and 200 bays in a super major rank. There are only three super major taxi ranks in the CoCT, i.e. Bellville Station, Cape Town Station and Khayelitsha-Nolungile Station. The value of taxi ranks exposed to the various climate hazards is shown in Table 8. A total of 30 of the 57 taxi ranks included in the analysis lie within high exposure areas of the city, including the Bellville Station super major taxi rank. Cape Town Station taxi rank is within the coastal flooding all-risk zone. The Khayelitsha-Nolungile Station rank does not fall in any of the areas at risk of climate-related hazards in the city. Very few (four) taxi ranks lie beyond 5 kms of a fire station.
The value of all rail infrastructure in the city is estimated at between R17 billion and R23 billion (US$940 million and US$1.27 billion). Around 7% of rail infrastructure is exposed to coastal flooding, and between 3% and 5% to other flooding events. Conversely, 38% of rail infrastructure is not located within 5 kms of a fire station and could, thus, suffer severe fire damage. Table 9 displays the value of rail infrastructure at risk in the CoCT. These values are based on 2018 PRASA station platform rectification costs of R14 million per platform, assuming two platforms per station and an average of 50 m2 of buildings per station, built at an average building cost of R20 000/m2. Capital outlays for building new rail lines vary based on the groundworks required. Three variants (for level, small and steep slopes) provide a sensitivity estimate for the potential costs that could be imposed if rail infrastructure were badly damaged: R16.2 million/km (US$0.9 million/km), R22.5 million/km (US$1.25 million/km), and R27.9 million/ km (US$1.55 million/km), respectively. The track electrification costs for the overhead powerlines equal R9 million/km (US$0.5 million/km) and connecting the line to the electricity grid another R9 million/km. US$ costs were converted at a rate of R18/US$, as witnessed in February 2023. These values were provided by two railway experts in South Africa.
Estimating the socio-economic infrastructure value at risk
To calculate the value of healthcare infrastructure at risk of severe weather events in the CoCT, facilities were divided into two cost categories: hospitals and clinics. It was assumed that the care centres and centres for disease control (CDC) included in the GIS data would be similar in cost to clinics. The 2020 cost to build a new hospital is assumed at R1.5 billion (Juta Medical Brief 2020) and around R987 450 for setting up a small new clinic (Rivera 2015). These costs can be considered conservative. Again, 2015 cost estimates were updated to 2020 equivalents based on the 31.66% increase in the South African Consumer Price Index over this period. Table 10 (page 61) provides a breakdown of the clinics and hospitals exposed to the various hazards and their associated worth.
Around a third of all the capital invested in healthcare facilities in the city has been spent in high exposure areas (17 hospitals and 29 clinics). Only one hospital (Netcare Christiaan Barnard Hospital in the CBD) and one clinic (Muizenberg Clinic) are threatened by coastal flooding, whilst other flooding events could negatively impact two hospitals (Mediclinic Vergelegen and Melomed Tokai) and four clinics (Conradie Care Centre, Ikwezi CDC, Macassar Clinic and Somerset West CDC). It is concerning that two hospitals (Netcare Blaauwberg Hospital and Melomed Gatesville) and 14 clinics are beyond the 5 km fire safety buffer, leaving them exposed and vulnerable to harm.
The threat to healthcare in the city is not only based on physical damage to the healthcare infrastructure itself, but also in terms of access to these facilities. If a hospital is located in a high-risk area, and the transport infrastructure in that area is damaged to the extent that access to the hospital is impeded, the socio-economic impact of the weather event is amplified. The same principle applies to access to education facilities.
Two cost alternatives were used to estimate the value of schools at risk in Cape Town. Regular brick-and-mortar-constructed schools cost R22.45 million (US$1.24 million) on average and R1.67 million (US$93 000) per classroom in 2020 terms, whilst alternative construction methods could lower these costs to R14.24 million (US$790 000) per school and R1.07 million (US$59 000) per classroom (Mabuza 2013). Table 11 displays the total school value at risk of extreme weather events in 2020 terms. A total of 266 of the city's schools are located in high-risk areas and an alarming 49% of schools are not within 5 kms of a fire station.

Table 12 provides a summary of the total infrastructure value at risk of extreme weather events in the CoCT in 2021 equivalents. Although damage amounting to these total values are unlikely to be incurred in one singular event, the figures provide a sense of the maximum exposure that authorities could be facing.
R392 million's (US$21.73 million) worth of transport infrastructure is extremely exposed to climate-related weather events, being in areas that could be affected by multiple climate hazards. In total, around R20 billion's (US$1.11 billion) worth of transport infrastructure is in the pre-defined high-risk areas and, as such, subject to significant weather damage. Devastating fires could ruin up to R18.45 billion (US$1.02 billion) in transport infrastructure assets. It is important to remember that these values only pertain to the physical infrastructure and do not take the indirect costs (e.g., loss in productivity and mobility due to reduced access) resulting from the damaged infrastructure into account.
MITIGATION ACTIONS AND PLANS
Several mitigation actions and plans have been developed to improve the resilience of transport infrastructure. "A resilient transport network is one that is able to cope, respond or react in such a way that it retains its essential function" (Greenham et al 2022). Physical resilience can be improved by so-called "hard" infrastructure-related measures, for example building flood barriers or improving drainage, whilst operational resilience is amenable to "soft" approaches, such as scheduling of maintenance or transport services. Greenham et al (2022) tabled six approaches towards increasing transport resilience:
1. Anticipate - actions to prepare in advance to respond to shocks and stresses
2. Resist - actions taken in advance to help withstand or endure shocks and stresses
3. Absorb - actions that aim to lessen impacts (accepting that impacts will occur)
4. Recover - actions that help restore expected service levels quickly
5. Adapt - actions that modify the system to enable it to continue to deliver services
6. Transform - actions that regenerate and improve infrastructure systems.
Proofing and maintenance of infrastructure, adding new infrastructure, and development of appropriate response strategies are all prudent governance tasks that can minimise the risk that severe climate events pose to transportation systems. Specific interventions are, however, available to address each individual hazard posed. Examples for coastal flooding (https://riskprofiles.greenbook.co.za/) include avoiding development of high-risk coastal areas, considering a managed retreat from areas at risk, implementing soft-engineered solutions for coastal protection (e.g. dune restoration), or applying hard-engineered solutions in high economic value areas (such as seawalls and breakwaters). Flood mitigation can be achieved through preparedness (for instance implementing real-time road-flood warning systems) and infrastructure redesign. For more information on response approaches to flooding, see Watson and Ahn (2022). Enhancing inherent fire resistance through the choice of construction material, structural configuration, design parameters, or through the installation of suppression systems, improves transport infrastructure resilience (Kodur & Naser 2021).
CONCLUSIONS AND RECOMMENDATIONS
Severe weather events can wreak havoc in urban environments, and the City of Cape Town is no exception. The three main threats to the city are coastal flooding, flooding of low-lying areas and fire. Of these, flooding of low-lying areas poses the lowest risk to transport infrastructure in the city and fire hazards the largest. Coastal flooding events could incur between R6 billion and R7 billion's worth of damage, and the repair bill after a severe flooding event could equal between R2.5 billion and R5 billion. Fires pose a risk to the unencumbered operation of 12 892 km of public transport routes in the CoCT.
Areas defined as high risk, based on their composite risk to multiple weather-related hazards, contain transportation infrastructure assets worth R20 billion (US$1.11 billion). Damage in these areas will have devastating transport consequences, both directly on mobility and indirectly in terms of access to critical (socio-economic) services in the city. Almost a quarter of all the city's roads and more than half of all substantial taxi ranks will be affected. Adverse weather can cause massive disruption to almost a third of taxi routes in the city and potentially negatively impact as much as 50% to 80% of the city's labour force.
Infrastructure traversing the Paarden Eiland/Maitland/Brooklyn and Strand areas are the most exposed to climate-related hazards in the city and deserve special caution. Coastal flooding will mainly affect the MyCiti system, along with portions of the rail network, whilst the CoCT's roads are most exposed to fire risks. Investing in fire safety protocols and disaster response plans will be of benefit to the CoCT. Raised infrastructure can substantially decrease the threat that flooding of low-lying areas pose to transport mobility.
The outputs from this analysis can be used by the CoCT to identify and develop custom mitigation plans for critical infrastructure elements. It is evident that spatial planning cognisant of weather-related hazards can play a major part in reducing and curtailing climate-related risks to (transport) infrastructure. Similar studies in other cities are suggested, to increase climate readiness. It is also recommended to expand the study to include specific transport infrastructure (e.g. tunnels and bridges) in future analyses.
ACKNOWLEDGEMENTS
This work is based on research supported by the National Research Foundation of South Africa, and the Council of Scientific and Industrial Research (Grant Number 138142). The authors would like to thank Thomas Slingsby, Friedrich Slabbert, Ivandra Udoyen, Wasim Khan, Fatgie Moos, Jaap van der Merwe and Friedel Mülke for their inputs and the data provided for this analysis.
REFERENCES
Asphalt Jungle 2021. The impact of wildfires on asphalt pavement roads. Asphalt Jungle, 9 June 2021. Available at: https://www.theasphaltjungle.com/the-impact-of-wildfires-on-asphalt-pavement-roads.html. [ Links ]
Botes, K 2023. Information regarding flood risk and floodlines. Letter from Water and Waste Services, Department of Water and Sanitation, City of Cape Town. [ Links ]
Cartwright, A 2008. Phase three: Final report. A sea-level rise risk assessment for the City of Cape Town. Stockholm Environmental Institute. Available at: https://camilo-mora.github.io/Diseases/PDFs/SEI_-2008_-South-Africa-Cape-Town-SLR-Adaptation-Assessment.pdf. [ Links ]
CoCT (City of Cape Town) 2015. Municipal disaster risk management plan. Revision 8. City of Cape Town. Available at: https://resource.capetown.gov.za/documentcentre/Documents/City%20strategies,%20plans%20and%20frameworks/Municipal%20Disaster%20Risk%20Management%20(DRM)%20Plan.pdf. [ Links ]
CoCT 2022. EPIC: Economic performance indicators for Cape Town 2022, Quarter 2, City of Cape Town. Available at: https://www.investcapetown.com/wp-content/uploads/2022/12/34551-CCT-EPIC-Q2-2022_interactive.pdf. [ Links ]
De Wit, M, Rawlins, J & Petrie, B 2023. Economic risk assessment of climate change at the city level. The case of Cape Town, South Africa. International Journal of Urban Sustainable Development, 15(1): 118-140. doi:10.1080/19463138.2023.2193813 [ Links ]
DEA (Department of Environmental Affairs) 2018. South Africa's Third National Communication under the United Nations Framework Convention on Climate Change. Pretoria: DEA. Available at: https://unfccc.int/sites/default/files/resource/South%20African%20TNC%20Report%20%20to%20the%20UNFCCC_31°/o20Aug.pdf. [ Links ]
DEFF (Department of Environment, Forestry & Fisheries) 2020. National Coastal Climate change vulnerability assessment: Vulnerability indices. Technical Report. Pretoria: DEFF. [ Links ]
Dube, K, Nhamo, G & Chikodzi, D 2021. Flooding trends and their impacts on coastal communities of Western Cape Province, South Africa. GeoJournal, 87: 453-468. Available at: doi:10.1007/s10708-021-10460-z [ Links ]
EPA (Environmental Protection Agency, US) 2022. Climate change indicators: Weather and climate. Washington, DC: US EPA. Available at: https://www.epa.gov/climate-indicators/weather-climate. [ Links ]
Goddard, E 2020. Port of Cape Town gets welcome reprieve as winds die down. Freight News, 4 February 2020. Available at: https://www.freightnews.co.za/article/port-cape-town-gets-welcome-reprieve-winds-die-down. [ Links ]
Greenham, S, Workman, R, Ferranti, E, McPherson, K, Quinn, A, Street, R et al 2022. Climate-resilient transport: A policy guide for low-income countries in Africa and South Asia. Report prepared by the University of Birmingham and the Transport Research Laboratory, UK. [ Links ]
Head, T 2018. Khayelitsha shack fire: Here's how you can help the victims. The South African, 21 October 2018. Available at: https://www.thesouthafrican.com/news/khayelitsha-shack-fire-how-to-help. [ Links ]
Howie, M 2022. Global weather: Cape Town records its hottest ever temperature as Greece is blanketed in snow. Evening Standard, 24 January 2022. Available at: https://www.standard.co.uk/news/world/cape-town-record-temperature-heatwave-western-cape-south-africa-b978543.html. [ Links ]
IPCC (Intergovernmental Panel on Climate Change) 2012. Glossary of terms. In: Field, C B, Barros, T F, Stocker, D, Qin, D J, Dokken, K L, Ebi, M D et al (Eds). Managing the Risks of Extreme Events and Disasters to Advance Climate Change Adaptation A Special Report of Working Groups I and II of the Intergovernmental Panel on Climate Change (IPCC). Cambridge, UK: Cambridge University Press, 555-564. [ Links ]
Isaacs, L 2018. About 500 homes destroyed in Capricorn fire. Eyewitness News, 26 October 2018. Available at: https://ewn.co.za/2018/10/26/about-500-homes-destroyed-in-capricorn-fire. [ Links ]
Juta Medical Brief 2020. 6 new Gauteng hospitals likely to be at double the cost and building time - DA. Juta Medical Brief, 4 March 2020. Available at: https://www.medicalbrief.co.za/6-new-gauteng-hospitals-likely-to-be-at-double-the-cost-and-building-time-da/. [ Links ]
Kodur, V & Naser, M Z 2021. Fire hazard in transportation infrastructure: Review, assessment, and mitigation strategies. Frontiers of Structural and Civil Engineering, 15: 46-60. [ Links ]
Lavell, A, Oppenheimer, M, Diop, C, Hess, J, Lempert, R, Li, J et al 2012. Climate change: New dimensions in disaster risk, exposure, vulnerability, and resilience. In: Field, C B, Barros, T F, Stocker, D, Qin, D J, Dokken, K L, Ebi, M D et al (Eds). Managing the Risks of Extreme Events and Disasters to Advance Climate Change Adaptation A Special Report of Working Groups I and II of the Intergovernmental Panel on Climate Change (IPCC). Cambridge, UK: Cambridge University Press, 25-64. [ Links ]
Mabaso, N 2022. Rebuilding KZN's road infrastructure estimated to cost R6bn. Eyewitness News, 6 May 2022. Available at: https://ewn.co.za/2022/05/06/rebuilding-kzn-s-road-infrastructure-estimated-to-cost-r6bn. [ Links ]
Mabuza, M 2013. School Building Programme: Input by Public Works Deputy Minister and Independent Development Trust. Parliamentary Monitoring Group, 24 July 2013. Available at: https://pmg.org.za/committee-meeting/16101 . [ Links ]
Markolf, S, Hoehne, C, Fraser, A, Chester, M & Shane Underwood, B 2019. Transportation resilience to climate change and extreme weather events: Beyond risk and robustness. Transport Policy, 74: 174-186. doi:10.1016/j.tranpol.2018.11.003 [ Links ]
Mutombo, K, Olger, A I & Kuroshi, L 2017. A new approach to assessing port infrastructure resilience to climate risks and adaptive solutions prioritization. Journal of Maritime Research, 14(3): 56-67. [ Links ]
OneWorld Sustainable Investments 2019. Elaboration of a 'Climate Change Hazard, Vulnerability and Risk Assessment' study to the benefit of the City of Cape Town. Vulnerability and hazard assessment report. OneWorld, 20 June 2018. Available at: https://resource.capetown.gov.za/documentcentre/Documents/City%20research%20reports%20and%20review/Vulnerability_and_Hazard_Assessment_Report.pdf. [ Links ]
Rivera, E 2015. Clinic-in-a-box helps bring healthcare to Africa. The Borgen Project, 17 November 2015. Available at: https://borgenproject.org/clinic-in-a-box/. [ Links ]
Rockefeller Foundation 2019. What is resilience? 100 Urban resilient cities. Available at: https://www.rockefellerfoundation.org/100-resilient-cities. [ Links ]
StatsSA (Statistics South Africa) 2020. National Household Travel Survey, NHTS 2020. Pretoria: Department of Statistics. Available at: https://www.statssa.gov.za/publications/P0320/P03202020.pdf. [ Links ]
Tsobo, L & Erasmus, D 2023. 'Most intense storm' wreaks havoc in Western Cape. Business Day, 25 September 2023. Available at: https://www.businesslive.co.za/bd/national/2023-09-25-most-intense-storm-wreaks-havoc-in-western-cape. [ Links ]
Vanderschuren, M, Frieslaar A & Lane, T 2008. Assessment of the improvement strategies for the N1 corridor between Bellville and Cape Town. Proceedings, 27th Southern African Transport Conference, 7-10 July 2008, Pretoria. Available at: https://repository.up.ac.za/bitstream/handle/2263/6155/Vanderschuren.pdf?sequence=1. [ Links ]
Van Diemen, E 2022. The city that blows hot and cold: Cape Town's flood-drought dichotomy explained. Daily Maverick, 25 June 2022. Available at: https://www.dailymaverick.co.za/article/2022-06-25-a-city-that-blows-hot-and-cold-cape-towns-flood-drought-dichotomy. [ Links ]
Vecchiatio, P, Vollgraaff, R & Squazzin, A 2023. Climate change blamed as record rains flood South Africa's Cape. Bloomberg News, 26 September 2023. Available at: https://www.bloomberg.com/news/articles/2023-09-26/climate-change-blamed-for-south-africa-s-floods#xj4y7vzkg. [ Links ]
Watson, G & Ahn, J E 2022. A systematic review to increase transportation infrastructure resilience to flooding events. Applied Sciences, 12: 12331. doi:10.3390/app122312331 [ Links ]
Wolski, P 2017. How severe is the drought? University of Cape Town News, 31 August 2017. Available at: https://www.news.uct.ac.za/article/-2017-08-31-how-severe-is-the-droughta. [ Links ]
 Correspondence:
T E Lane-Visser
Centre for Transport Studies, Civil Engineering Department, University of Cape Town
Private Bag X3, Rondebosch 7701, South Africa
E: lane.tanya@gmail.com
M J W A Vanderschuren
Centre for Transport Studies, Civil Engineering Department, University of Cape Town
Private Bag X3, Rondebosch 7701, South Africa
E: marianne.vanderschuren@uct.ac.za

DR TANYA LANE-VISSER obtained her PhD from the University of Cape Town (UCT), and a BEng Industrial and Systems Engineering degree from the University of Pretoria. She has been working in the field of transport planning and modelling since 2007, with a particular focus on sustainable transport and freig ht transportation. She is currently a Postdoctoral Research Fellow at the Centre for Transport Studies at UCT. Management of energy use in transport systems, transport decarbonisation, safety and personal security of transport passengers, a just transition towards future transport networks and the economic impacts of changes to the transport system fall within her research scope.

PROFESSOR MARIANNE VANDERSCHUREN (CEng, FSAICE, FICE) graduated from three different Dutch Universities with a BSc Eng (1989), an MSc Eng (2000) and a PhD (2006). She has over 30 years' experience in the field of transport engineering and (smart) mobility. For more than ten years she worked in the Netherlands at TNO Inro, the Netherlands Organisation for Applied Scientific Research (a sister organisation of the CSIR), before joining the University of Cape Town in 2000. She was the 2022 President of the South African Institution for Civil Engineering, and received the NSTF 2022 Special Theme Award: Basic Sciences for Sustainable Development.

