


Services on Demand
Article
 English (pdf)
 Article in xml format
 Article references
Indicators

Related links
-
 Cited by Google
 -
 Similars in Google
Share

 Permalink
Journal of the South African Institution of Civil Engineering
On-line version ISSN 2309-8775
Print version ISSN 1021-2019
J. S. Afr. Inst. Civ. Eng. vol.65 n.4 Midrand Dec. 2023
http://dx.doi.org/10.17159/2309-8775/2023/v65n4a4
TECHNICAL PAPER
The value of Association Rule Analysis in understanding serious and fatal road traffic crashes - a case study of the N4 toll road between 2015 and 2019
A J Gelderblom; M Sinclair
ABSTRACT
In spite of the fact that the road traffic crash fatality rate in South Africa is significantly higher than the global average, the characteristics and causes of road traffic crashes are still not well understood. Without a clear understanding of the characteristics and causes, intelligence-led countermeasures to reduce crashes cannot be developed or applied. The analysis of local South African road crash data is of particular importance in identifying the underlying problems responsible for the high crash rates across the country. While descriptive analyses can be used to present a snapshot of the crash problem, they are largely inadequate when it comes to throwing light on the underlying patterns and relationships between the contributing factors and causes of the crashes themselves. This paper presents a study of the use of Association Rule Analysis (ARA) on data related to crashes on the N4 between Pretoria and the Mozambican border, between 2015 and 2019, to see what added value ARA may offer to standard descriptive analyses of crash data. Apriori Association Rule algorithm was employed on the dataset to identify what contributory factors were not initially evident in the occurrence of serious and fatal crashes. ARA revealed that pedestrians, negligent driving, overtaking and single-vehicle crashes are common factors likely to be present in a serious crash. However, this study found that descriptive statistical analysis and ARA methods are not mutually exclusive, but rather complementary. Where descriptive statistical analysis focuses on summarising and describing data, ARA focuses on identifying relationships and patterns within the data.
Keywords: road traffic crash analysis, Association Rule Analysis (ARA), Apriori algorithm, road traffic crash contributory factors
INTRODUCTION
Globally, the number of fatalities caused by road traffic crashes continues to rise. The World Health Organisation (WHO 2018) reports that around 1.35 million fatalities occur as a result of road crashes annually. Road traffic injury is now the leading cause of death for persons aged 5 to 29 years. Furthermore, the burden of road traffic deaths is disproportionately high among low-and middle-income countries in relation to the size of their populations and the number of motor vehicles in circulation. While the global average number of traffic deaths was 18 per 100 000 population in 2018, low-income countries had an average of 27.5 deaths per 100 000 population, with Africa reflecting a rate of 26.6 deaths per 100 000, even though the continent has the lowest motorisation level in the world (1% of vehicles and 13% of traffic deaths). This high fatality rate means that the risk of dying from a road traffic injury in African countries is around three times higher than in developed countries where the average rate is around eight deaths per 100 000 population. It is notable, too, that Africa has the highest proportion of pedestrian and cyclist fatalities (at 44% of all road traffic crash fatalities), compared to the global average of 26% (WHO 2018).
The road safety situation in South Africa is not dissimilar to that of the larger African continent, despite the country ranking as one of the wealthiest on the continent and having fairly sophisticated road networks and traffic legislation. According to the national Road Traffic Management Corporation (RTMC), in 2019, road crashes in South Africa were responsible for approximately 12 503 deaths (RTMC 2020). This number of road deaths equates to around 22 deaths per 100 000 of the population, comparing unfavourably to the global average of 18 fatalities per 100 000 of the population (WHO 2018), and suggesting significant room for improvement.
In 2009, South Africa became a signatory to the United Nations Decade of Action for Road Safety 2011-2020 (UNDA). In line with the UNDA resolution, South African authorities committed to reducing road fatalities by 50%, from the 2010 baseline figure of approximately 14 000 to 7 000 by 2020. Since the start of the Decade of Action, South Africa has experienced a modest decline in reported road fatalities, decreasing from 13 967 in 2010 to 12 503 in 2019. However, reductions in road fatalities did not reduce at the rate required for many countries, including South Africa, to achieve the targeted 50% reduction by 2020. In September 2020, the UN General Assembly adopted resolution A/RES/74/299: Improving global road safety, proclaiming the next Decade of Action for Road Safety 2021-2030, whereby signatories again committed to reducing road fatalities and injuries by 50% by 2030. With this resolution, the WHO and the UN regional commissions, in cooperation with other partners in the UN Road Safety Collaboration, developed a Global Plan for the Decade of Action, released in October 2021 (WHO 2021).
The South African National Road Safety Strategy 2016-2030 was developed as one of the UNDA actions to direct the activities needed to bring about faster and sustainable improvements in death rates. The strategy embodies the principles of the Safe System Approach to Road Safety, including shared responsibility for road safety, and quite critically, the goal of making crashes survivable. In accordance with South Africa's developmental approach, the National Development Plan 2030 (NDP 2030), largely seen as the country's strategy blueprint, also set a revised target to reduce injuries, crashes and violence by 50% from 2010 levels by 2030 (RTMC 2017). Under this plan, South Africa is committed to developing research programmes and interventions for road safety that embody the principles of the Safe System Approach. The considerable impact of crashes on the economy and society at large underlines the need to improve road safety in South Africa, and also provides a convincing case to undertake further research, and to improve research methods and practices, as far as possible.
STUDY OBJECTIVES
For South Africa to effectively reduce traffic fatalities, an improved understanding of crash causation is needed, more specifically the interactions between the road user, the road environment and the vehicles involved in crashes. This, in turn, requires rigorous analyses of crash data, often regarded as the best source for identifying safety deficiencies (Bai & Li 2006). As data capturing techniques become more innovative, electronic crash datasets have become more easily available for analysis. Internationally, the quantity and quality of crash datasets are increasing all the time, yet the large amount of information held within them can make it more difficult to analyse using existing and/or traditional data processing methods. Further, the identification of causal relationships between data entries typically requires advanced statistical expertise, which may fall beyond the skillsets of local transport professionals. New innovative research and crash data models are, therefore, needed to analyse large crash datasets.
Association Rule Analysis (ARA) is one of the new methods of crash data analysis that is growing in use in many countries. ARA is a data mining technique that identifies relationships and patterns in large datasets without the need for statistical interrogation. When it comes to analysing large crash datasets, ARA is believed to offer several advantages over conventional descriptive statistics. These include benefits relating to an improved comprehension of the factors behind crash causations, specifically through the identification of hidden patterns and associations, including categorical data, interpreting multi-dimensional data effectively, and identifying anomalies - unusual or rate patterns in crash data that may indicate emerging safety concerns.
ARA is also considered to have a useful predictive value - by identifying association rules in crash data, it is possible to anticipate the likelihood of certain factors leading to crashes in the future. This predictive capability is often not achievable with conventional descriptive statistics alone. Finally, ARA results can inform decision-making processes related to traffic management, law enforcement strategies, and infrastructure development. By better understanding the associations between different variables, authorities can implement targeted interventions to reduce accidents and improve road safety. ARA is being used increasingly in crash analyses, yet its value in the South African context, specifically given the challenges of South African crash data, has yet to be evaluated.
The main objective of this study was to assess the value of the application of ARA to the analysis of crashes on a portion of the N4 in South Africa. The primary goal was to determine whether ARA analysis could add value and improve the quality of the conclusions that could be drawn from the databases, compared with traditional descriptive analysis -specifically, whether ARA could produce an improved understanding of crash causation, and enhance our ability to predict and prevent crashes more than conventional descriptive analysis.
A secondary objective was to investigate, where challenges to applying ARA were identified, what the factors may be that are limiting the application of ARA, and how these can be improved to achieve better use of ARA in the future.
Scope
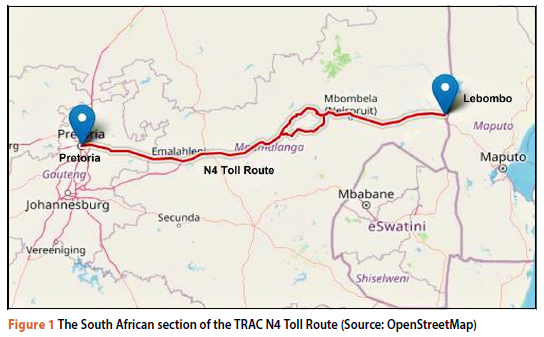
The scope of this research was limited to the analysis of the serious and fatal traffic crashes that occurred between 2015 and 2019 within the South African section of the N4 Toll Route, starting in Pretoria (Tshwane), Gauteng, and terminating at the Lebombo border post, located at the South Africa / Mozambique border. The freeway section spans a total length of 473 km (see Figure 1). While data for the route was available post-2019, it was decided that the uncharacteristic travel patterns during the Covid-19 pandemic (ITF 2021) would yield unrepresentative results, so the study was limited to normal traffic conditions before the Covid-19 pandemic.
Injury severity definitions
The Maximum Abbreviated Injury Scale (MAIS) was used in this study to define crash severity. The MAIS injury system uses a scale ranging from 0 to 6, where 0 represents no injuries, 1 represents minor injuries and 6 represents very severe injuries (Wang 2022). Contributory factors to vehicle crashes which resulted in MAIS 3 to MAIS 6 injuries were analysed in this study (MAIS 3 represents moderately severe to serious injuries which require immediate medical attention, whereas MAIS 6 represents the most severe life-threatening injuries). The term KSI (Killed/ Serious Injury) crash is used throughout this study to represent combinations of these types of high-severity crashes, a term which recognises that precipitating factors for these crashes tend to be similar.
LITERATURE REVIEW
The study collected and synthesised literature from two key areas - firstly, research on appropriate analytical techniques of crash data (specifically Association Rule Analysis), and secondly theories of crash causation - to make the best use of the available methods and to make the best sense of the results. For the purpose of this paper, only a brief summary of the salient elements of the literature review is included.
An overview of Association Rule Analysis
Typical crash data analysis has included descriptive statistics and regression modelling, both of which are subject to limitations in their potential to make sense of large datasets. Recently, several new data-mining techniques have been applied to overcome this shortcoming. Data mining uses different techniques (such as clustering, association, machine learning, data visualisation, classification, prediction, and algorithms) to recognise relationships in large datasets (Li et al 2017).
One of the most compelling new forms of data interrogation is Association Rule Analysis (ARA), which is a data-mining technique used to uncover meaningful associations and relationships within a dataset (Feng et al 2019). Using an Apriori algorithm based on Boolean association rules, ARA works to identify patterns of co-occurrence between items in a dataset by defining rules that indicate the likelihood of one item occurring relative to the presence or absence of another. According to Hsu & Chang (2020), an association rule can be described as a discussion of probability relationships, based on historical records, which attempts to explore relevance among data within a database. ARA, therefore, is a theory of conditional probability.
ARA relies on three measures to evaluate the strength of an association rule found during the analysis, namely the support value, the confidence value, and the lift value. The support value represents the frequency of a specific rule within the dataset, in other words, how frequently the items in the rule appear together. The confidence value measures the reliability of the rule by determining the proportion of times the rule holds true among all instances where the antecedent (the item or event being conditionally related) appears. The lift value is a useful metric to assess how strongly related two items or sets of items are in a dataset (Feng et al 2019). In short, ARA provides insights into the relationships between items in a large dataset which may not be otherwise easily identifiable.
Application of data mining in crash investigation research
A number of contemporary research studies in different countries have focused on predicting the factors in crashes using data-mining techniques. Some examples of the application are presented here.
■ Feng et al (2019) applied Apriori algorithm on mining UK traffic crash data ranging from 2005 to 2017. Here results showed that the crashes displayed have a strong correlation with environmental characteristics, speed limit, and the specific location. By using a network visualisation model, they managed to explain the association rules in more detail, and obtained more comprehensible insights into the results achieved.
■ In their study in the Russian Federation, Makarova et al (2020) applied both histogram plotting and association rules to analyse and identify the causes that significantly affected the risk and severity of crashes that occurred in Elabuga town between 2017 and 2018. Using Association Rule Analysis, the influence of weather conditions, the quality of road infrastructure and the quality of road marking could be established and explained in more detail.
■ AlMutairi et al (2021) applied Apriori algorithm to find the association rules between crash incidence and driving behaviour in Kuwait. Their study found that pedestrian-related crashes were related to a lack of driving-school experience and myopia (near-sightedness), and that 11% of people with myopia did not wear glasses while driving.
■ Tariq et al (2022) applied Association Rule mining, and Apriori algorithm in particular, to study and analyse road crashes that occurred in the city of Gujarat, Pakistan, between 2018 and 2020. Their study found that most crashes were caused by speeding motorcycles, and that the situation is most severe at open-market areas, during the middle of the week, and in the afternoon.
■ Xu et al (2018) applied Association Rule Analysis to investigate the contributing factors to serious and fatal road crashes, and their interdependency, in China between 2009 and 2013. First, descriptive statistics were used to illustrate the characteristics of the crashes. Association Rule Analysis was then applied to identify sets of crash contributory factors that often occur together. Results showed that experienced drivers are likely to be involved in a serious or fatal crash on highways. Speeding and improper vehicle operations in adverse weather conditions were identified as important contributing factors. As for undivided roads, the study found that improper operations of vehicles, such as unsafe lane-changing and dangerous overtaking, were likely to cause serious or fatal crashes, and these crashes are likely to be head-on collisions. ARA has thus shown itself to be a useful method of investigating multiple and associated factors in crash causation, across a wide range of factor types.
Contributory factors to vehicle crashes
Driving is a complex process in which a large number of variables with varying degrees of dependency engage with one another. The American Association of State Highway and Transportation Officials (AASHTO) reports that most crashes cannot be related to a single causal event; instead, crashes are the result of a convergence of a series of events that are influenced by several contributing factors (AASHTO 2010). These contributing factors influence the sequence of events before, during and after a crash. The contributors to crashes are the human (the road user, most often the driver of a vehicle, though pedestrians are also active road users), the road environment. and the vehicle. These three factors often combine in a chain of events that result in a crash. Due to the vast number of influences and inter-dependencies that exist during the moment of crash occurrence, the determination of causation of crashes can be difficult. That said, research over many decades and across all geographical regions of the world, has confirmed that the human factor is overwhelmingly implicated in precipitating crashes, either alone or in association with the other two contributing factors.
Human factors
Human factors relate to road user behaviour, the physical ability of road users, their performance, and failures (amended from NCHRP Report 600) (TRB 2015). They highlight what the road user did or did not do at the time of the crash, and such action or inaction is explained in light of a vast range of physiological and psychological competencies and conditions, to encompass both intentional and unintentional failings (amended from Austroads 2009). Determining the involvement of human factors after a crash is notoriously difficult - countries such as the United Kingdom define many multiples of variables in their crash reporting forms to help determine where and what human factors were at least partially involved. In South Africa (SA), the official accident reporting form only lists a possible 13 human factors and does not recognise the likelihood of multiple or associated factors in play at the same time. Consequently, the human factors analysis in the SA context is challenging. Despite this, the RTMC reported, in their Status of Road Safety Report: Calendar: January - December 2019, that human factors were found to have caused 85% of fatal road crashes in 2019 (RTMC 2020).
Really understanding human factors and their role in crash causation requires a more advanced approach than simply relying on the causation sections of crash reports. Errors and violations are not always appropriately reported. Errors may arise as a result of information-processing problems (Reason et al 1990; TRB 2015), most commonly seen in misjudgements of the speed and distance of approaching vehicles, and failure to recognise or respond to hazards on the road (SWOV Institute for Road Safety Research 2012). They can also emerge because of unfa-miliarity with a road or a driving task, or because their expectations of the driving task did not match the demands of the road environment (Cumming & Croft 1973; Garber & Hoel 2009; TRB 2015).
Intentional violations of traffic laws can be difficult to assess from crash reports. Typically, the most common factors resulting in fatal crashes are reportedly risky, negligent, aggressive, and reckless driving (AAA Foundation for Traffic Safety 2016), speeding (SWOV Institute for Road Safety Research 2012), drug/alcohol usage (Zhao et al 2014; Dultz et al 2011), and mobile phone usage (Dragutinovic & Twisk 2005). The distraction of road users is also being recognised as a serious problem in fatal crashes (Wang et al 1996; Oluwole et al 2014), as is fatigue (Thiffault & Bergeron 2003). Human factors also relate to who is driving, in terms of gender and age or driving experience. International literature reports higher involvement of male road users in traffic fatality statistics, even where normalised against the gender of all other road users (Massie et al 1995; Turner & McClure 2003; Jiménez-Mejías et al 2014). Males are reported to have riskier road user behaviour than females (Turner & McClure 2003; Oltedal & Rundmo 2006) and lower levels of compliance with traffic rules (Bener & Crundall 2008). Young road users are typically more at risk than older road users, probably because of their lack of experience (Alfonsi et al 2018; Regev et al 2018).
Vehicle factors
Vehicle factors influencing the risk and severity of crashes include all elements of the vehicle that can influence the likelihood of a crash, from the vehicle type and design to mechanical condition, on-board safety devices, braking system, and the condition of the head- and brake-lights. These affect a driver's ability to maintain control of the vehicle to avoid a crash. The malfunction of any vehicle factor can cause serious safety problems. The RTMC (2020) found that, in South Africa, 10% of crashes reported in 2019 were caused by vehicle factors. The reason for this high percentage may lie in the high number of unroad-worthy and unlicensed vehicles on South African roads. According to the RTMC (2020), nearly 1.2 million unroadworthy and unlicensed vehicles were recorded from December 2018 until December 2019 on South African roads. The real number is probably much higher than this - RTMC figures are predominantly from roadworthy tests which are usually only mandatory when a vehicle is sold.
Road and environmental factors
Road and environmental factors include the road surface conditions, the geometric design of the road, the traffic control devices, the state of road maintenance, the degree of visibility, the prevailing weather conditions, and any other non-driver or non-vehicle related factors. The RTMC (2020) found that, in South Africa, 5% of all reported crashes that occurred in 2019 were caused by road and environmental factors. As the majority of crashes cannot be related to a singular causal event, it is likely that the most significant environmental causes found by the RTMC, namely sharp curves/bends, poor visibility and wet/slippery road surfaces, were the result of a combination of the specific road or environmental factor and a human factor that prevented a safer or more appropriate response (TRB 2015).
In summary
The current design of the SA crash reporting form, which utilises exclusive categories of factors and minimises input choices, means that interdependencies between the categories of factors (human, vehicle, and road and environmental) or between factors within a single category, are unfortunately impossible to identify without some form of advanced associa-tional analysis.
METHODOLOGY
Data collection
Trans African Concessions (Pty) Ltd (TRAC) is a Southern African Concessionaire responsible for the 570 km N4 Toll Route between Pretoria in South Africa and Maputo in Mozambique. Road traffic crash data was obtained from TRAC's Traffic and Information Data System (TIDS) for information relating to the crashes that occurred along the N4 for a five-year period from 2015 to 2019. The TIDS database contains approximately 5 700 records of crashes that occurred within the South African part of the N4 Toll Road during this time. Of these records, the TIDS database contains 1 470 records of KSI crashes that occurred within this period. As mentioned previously, the study route comprises approximately 473 km of the N4 east of Gauteng. The TIDS system has been developed to include all the data contained in the original crash reports. A list of the variables, as per the major categories, is shown below:
1. Responsible driver - basic information, namely, the gender and the age of the driver
2. Time details - time and date variables of the crash
3. Environmental conditions - information such as the lighting and weather conditions during the crash
4. Crash location - information on the locality and section of the crash
5. Crash severity - information in terms of injury occurrence
6. Crash type - information on the type of crash and the number of vehicles involved
7. Contributory factors - factors listed as the cause of the crash.
The contributory factors are divided into the following categories to enhance the statistical analyses:
■ The human factors - speeding, negligent driving, alcohol, fatigue, etc.
■ The road and environmental factors -roadway condition, poor visibility, etc.
■ The vehicle factors - tyre burst, brake failure, etc.
Data preparation, data preprocessing and data refinement
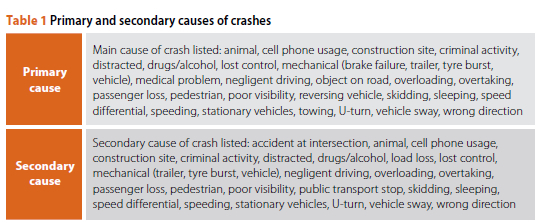
For all of the analysis that follows, the first important step towards analysis was the cleaning up and interpretation of the data. For the ARA in particular, the data analysis required simplified, formatted, and comprehensive information that could be readily fed into the analysis software. As such, data preparation had to be performed before the data could be analysed. During this process, irrelevant and duplicate information was removed from the dataset. Where possible, ambiguities and inconsistencies in the data entries were corrected or addressed. A manual (and extremely time-consuming) element of this process involved determining - from the crash description - the most likely primary and secondary causes of each reported crash. For the purposes of both descriptive statistical analysis and ARA analysis, the primary and secondary causes were identifiable from a common list of possibilities as shown in Table 1.
How these causes were found to be related to each other was unpacked in the analyses.
WEKA 3.8.3 software was used for the Association Rule Analysis. WEKA is a collection of machine-learning algorithms and data-processing tools which include, among others, the Apriori algorithm for Association Rule Analysis (Frank et al 2016). Like most crash data, the records obtained from the TIDS database were presented in Excel (XLS) format. However, WEKA's native data language is in Attribute-Relation File Format (ARFF), which consists of a list of the instances, of which the attribute values for each instance are separated by commas. As such, the data needed to be converted into the Comma-Separated-Value (CSV) format. To obtain the best results from an analysis performed by WEKA, the input data first had to be processed into readable WEKA language. WEKA code is highly sensitive to upper/lower casing and blank spaces; therefore, all spelling had to be presented consistently, and all numerical values converted to nominal values. It was also considered advisable to group large variable categories, such as the age into groups like "18-20" and "26-30", etc. This helped to minimise the number of variables and avoided a high number of fictitious and unreliable association rules being generated.
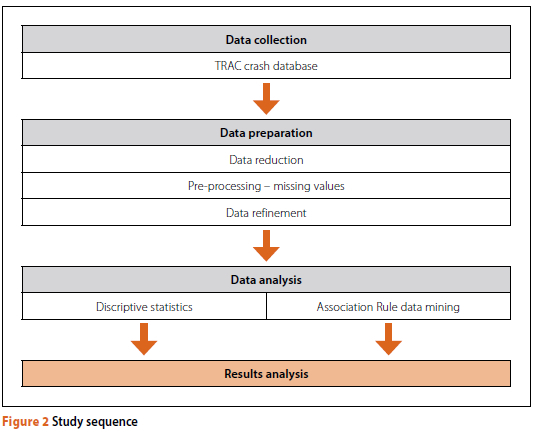
Sequence of analysis
The sequence of the study is schematically represented in Figure 2.
Data analysis method: Descriptive Analysis
The data was first subjected to fairly standard descriptive analysis techniques, to determine how informative they were in unpacking crash causation. Changes in the annual number of crashes and KSI crashes, the relative frequency of crash types, crash types by gender, crash frequency and crash types by time of day, and primary and secondary causes for all crashes and KSI crashes, were examined in this part of the analysis.
Data analysis method: Association Rule Analysis (ARA)
Each crash record included different types of information on the driver, the road (environment) and the crash. After pre-processing, eight different attributes covering the abovementioned types of information were developed. Table 2 illustrates these attributes with descriptions of their variables.
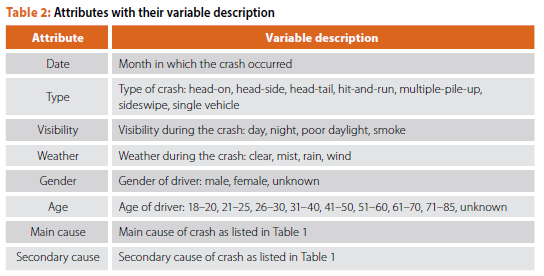
The full complement of data attributes available through ARA was applied to the database to determine what associations were discernible between the different factors and to identify associative relationships between attributes for all KSI crashes. While many algorithms can be used to discover association rules from the data to extract useful patterns, for this study the Apriori algorithm proposed by Agrawal and Srikant (1994) was used. The Apriori algorithm in WEKA 3.8.3 was used to implement the ARA.
RESULTS
Descriptive statistics
A selection of typical descriptive statistics is presented below, to give an idea of the findings that are commonly obtainable using standard analytical techniques.
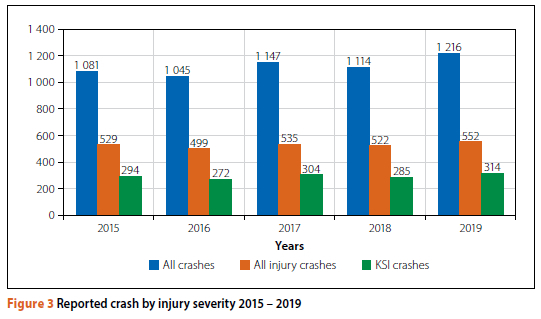
Figure 3 represents the annual number of reported crashes in the database between 2015 and 2019. The number of all injury crashes and KSI crashes gives some context to the crash history and quantifies the incidence of KSIs relative to the total crash numbers. A discussion of the crash rate at the level of the entire route is not presented here - individual crash rates were calculated for short sections over the entire length of the route, but that is beyond the scope of this paper. As is evident from Figure 3, the number of all forms of crashes has been fairly consistent over the five-year period. Roughly 47% of all reported crashes on this route are categorised as an injury crash, and about 26% involve at least one serious or fatal injury.
The relative frequency of crash types, and KSI crash types within the bigger dataset, is shown in Figure 4.
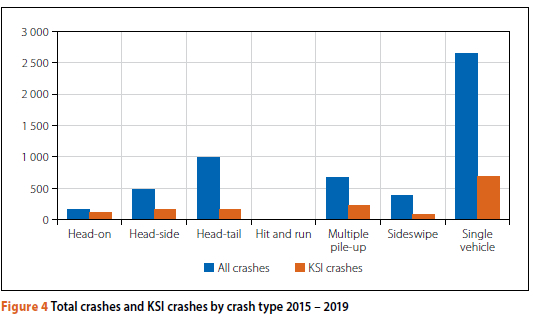
As can be seen, single-vehicle crashes are by far the most commonly reported crash types in the dataset. In terms of severity, 72% of head-on crashes in the overall database are classified as KSI, with a similar percentage applied to the (much smaller number of) hit-and-run crashes. Only head-tail crashes and sideswipe crashes are associated with a fairly low KSI outcome (16% and 22% respectively). Multiple pile-ups have a 36% KSI outcome, and 25% of single-vehicle crashes were classified as KSI. Figure 5 indicates the gender of the driver (where recorded) in the KSI database for each of the crash types.
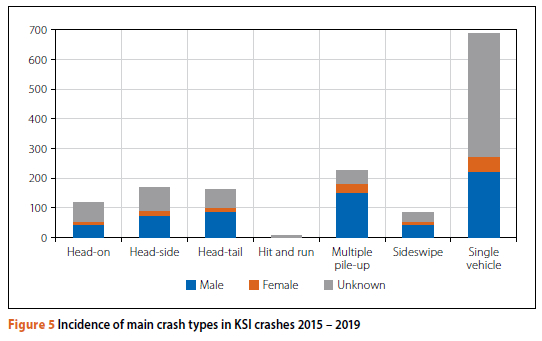
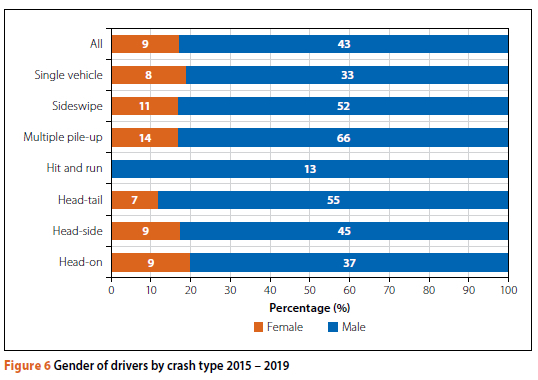
In statistical analysis, there is often an interest in the gender of drivers involved in crashes. Within this crash database, there are clearly two significant unknowns relating to gender - the first is the gender distribution of all drivers on the route, and the second is the 'unknown' entries in the database. It is worth noting that 48% of KSI crashes (n = 702) were missing gender information. As such, even those reports with the most serious injury outcomes were largely incomplete in the database (the same is true for the age of the driver). Where gender was recorded, however, the incidence of female drivers was notably less frequent than male drivers (134 female v 628 male), though the significance of this is unclear without normalising this against the dividing population for all crash types. For the cases where gender was recorded, though, it was possible to develop an indicative comparison of the relative involvement of male and female drivers in different types of crashes. Females were shown to be more likely to be involved in multiple pile-ups, and least likely to be in a single-vehicle crash or a head-tail crash than in the other crash types. Males have been shown to be involved in all types of crashes, with the highest involvement being hit and run, multiple pile-ups and head-tail crashes. Figure 6 refers.
The time of day, or the light available to drivers, is a factor in crash likelihood. Figure 7 represents the distribution of crash types by light - in this graph poor light condition is generally twilight (i.e. the transition period between night and day).
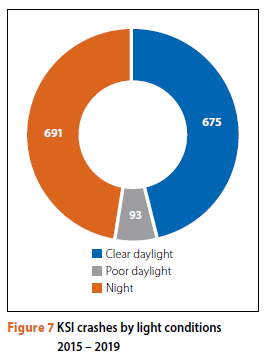
The breakdown of crash types by light condition does not indicate significant differences in crash numbers between day- and night-time conditions. Similar to the issue around gender, what this graph is missing is the number of vehicles on the roads during these times; night-time traffic volumes are notably far lower than daytime volumes, and so the relative risk of crashes will be significantly higher at night-time. The data did not show any significant elevations in risk by light condition for specific crash types - there was almost no variation in the number of day and night-time crashes. Multiple pile-ups were slightly more prevalent in darkness, and head-side crashes were slightly more prevalent during the day.
Poor weather seemed to have played a fairly insignificant role in the recorded KSIs - of the 1 467 records, 1 286 occurred during clear conditions (dry weather), 151 during rain and only 30 during mist or fog.
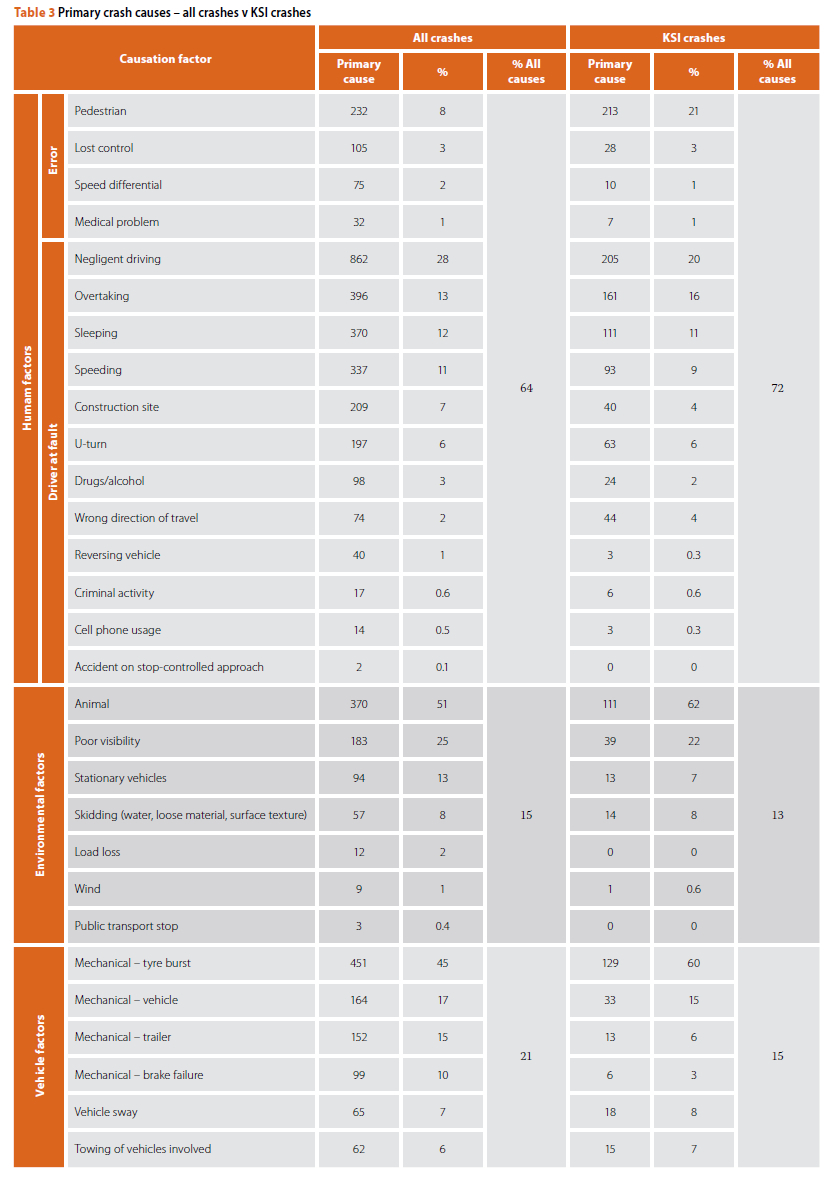
Looking at categories of crash causation, the database has been cleaned substantially, and the crash description was used as a basis to categorise the primary and secondary causes of the crash. The distribution of identified primary crash causes is laid out in Table 3.
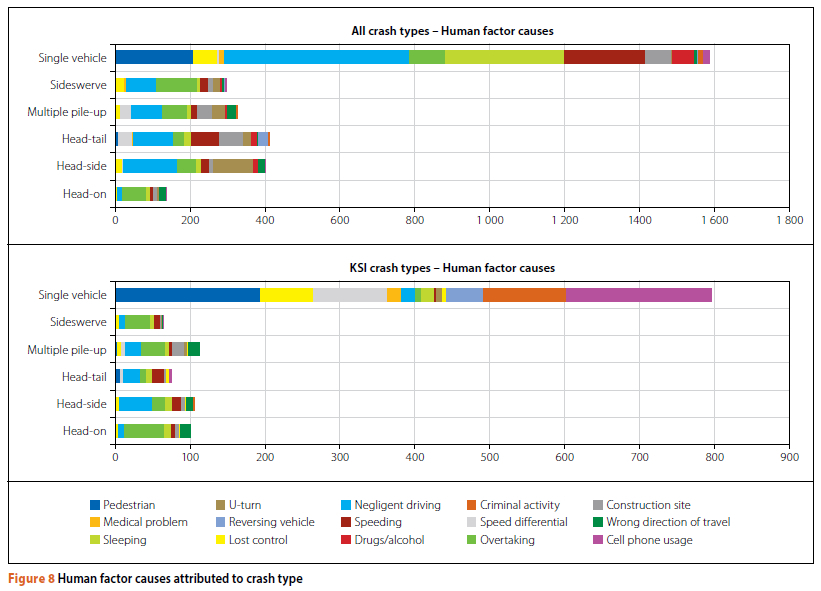
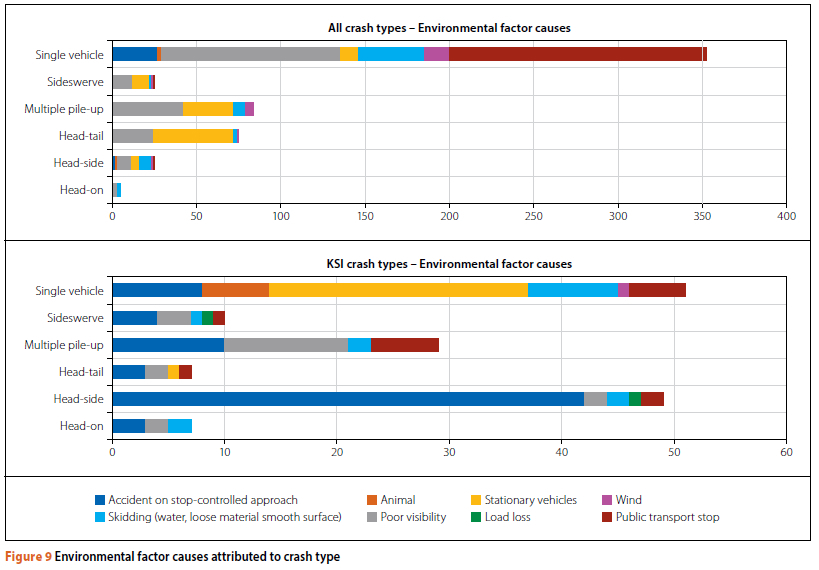
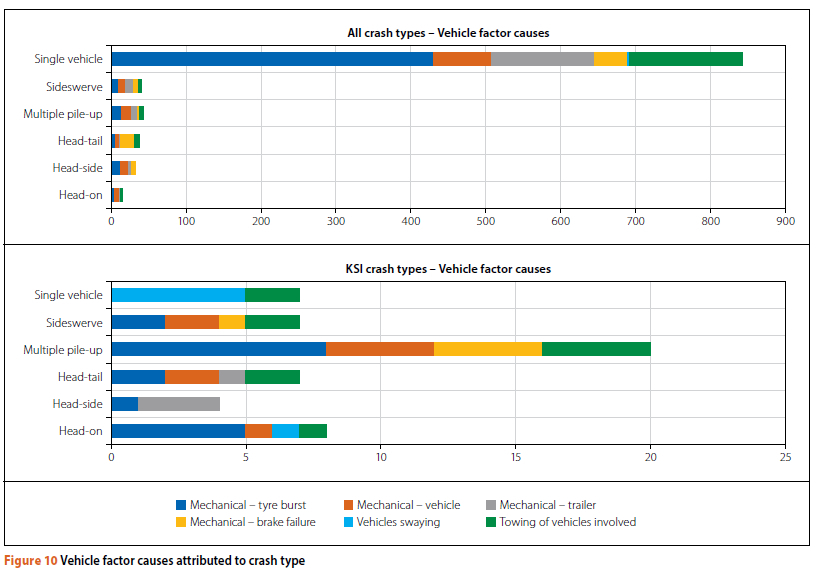
From Table 3 it can be seen that human factors are the primary cause of 64% of all crashes and 72% of KSI crashes. Environmental factors are attributed as the primary cause in 15% of all crashes and 13% of KSI crashes, and vehicle factors count slightly more, i.e. 21% of all crashes and 15% of KSI crashes. When looking at crash causation specific to crash type, a few interesting facts are identifiable (see Figures 8, 9 and 10). (Because of the very low number of hit-and-run crashes relative to other types, they were not included in this general analysis). In each case, the type of factor (human, environmental and vehicle) was isolated, and then the crash type by factor for all crashes and KSI crashes only, was displayed graphically.
The human factor analysis allows us to identify recurring and dominant patterns of human behaviour in the different crash types. From Figure 8 it is clear that negligent driving was a common factor in all KSI crash types, and that overtaking errors were implicated in almost all of them, apart from single-vehicle crashes. The use of cell phones, sleeping, speed differential and criminality were identified as key problems in the single-vehicle KSI crashes, and speeding was indicated as a factor in side-swerve, head-tail and head-side crashes.
Under environmental factors, it is interesting to see that public transport stops were associated with a high number of single-vehicle crashes in all crashes. Stationary vehicles appear to be more of a problem with KSI single-vehicle crashes. Poor visibility was a factor in many multiple-vehicle crashes (all crashes and KSI crashes). A large number of head-side crashes are caused as a result of stop-controlled approaches.
With the vehicle factors, tyre bursts were dominant in all crashes and in KSI crashes, multiple pile-ups and head-on crashes. Trailers, and swaying of vehicles were also issues.
As mentioned previously, the exclusive categories of causation defined in the South African accident reporting forms make it almost impossible to recognise where patterns of interdependencies may exist, and result in an oversimplified analysis. Even with the cleaning up that was done, the categories of causation factors were difficult to reconcile across the three categories of factors. The relative importance of each cause within the type of crash is helpful in understanding some of the factors that are most highly associated with a crash or a crash outcome, but even so, the findings are both speculative and incomplete.
Association Rule Analysis (ARA)
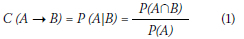
ARA describes the relationship between sets of items matching a given attribute A with an attribute B. In other words, if attribute A appears, X% of the probability will also have attribute B at the same time, which reads as "from A follows B" or A - B (Hsu & Chang 2020).
The general form of an association rule is as follows:
IF event A occurs THEN event B occurs as well, in C% of times, and this pattern occurs in S% of all events in the dataset.
This relationship is characterised by two main indicators, the Confidence (C) and the Support (S) values.
■ Confidence Value (C) is a measure of the rule accuracy, determined as the ratio of the number of occurrences containing both attribute A and attribute B to the number of occurrences containing only the attribute A. In other words, the Confidence Value indicates the probability of B appearing on the premise of A:
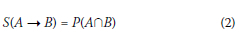
■ Support Value (S) is the number of occurrences containing both attribute A and attribute B. In other words, the Support Value indicates the probability of A and B appearing at the same time:
Setting the minimum Confidence and Support values is essential in ARA because it allows the user to control the quality and quantity of the generated rules by:
■ Reducing unreliable rules. ARA can generate a large number of rules, many of which may not be meaningful. By setting a minimum Confidence threshold, rules that do not meet a certain level of confidence are filtered out, ensuring that the rules generated are more reliable. This helps in focusing on the most significant associations.
■ Reducing computational complexity. Mining association rules can be computationally intensive, especially for large datasets. Setting a minimum Support threshold helps to reduce the number of item sets considered during rule generation. This pruning of infrequent item sets speeds up the analysis process and makes it more manageable.
■ Controlling the number of rules. Without a minimum Support threshold, the algorithm will generate a vast number of rules, making it difficult to interpret the results. By setting a minimum Support threshold, the number of frequent item sets is controlled as is, consequently, the number of generated rules. This ensures that a manageable set of rules can be obtained for analysis.
■ Balancing precision and recall. By adjusting the minimum Confidence and Support values, a balance between precision and recall can be achieved. High thresholds will result in fewer, but more reliable, rules. Lower thresholds will yield more rules, but with potentially lower reliability.
As in the case of international studies, for this analysis the minimum Confidence was set at 90% and the minimum Support was set at 10%. Setting the Confidence and Support at these values allows for a good balance between precision and recall. The high thresholds resulted in fewer but more reliable rules. Once the minimum Support and Confidence values were set, all the data from the database was analysed to determine the support of the first candidate item set - this generated the first high-frequency item set. According to the concept of candidate item sets, if the support of the candidate item set is greater than or equal to the minimum support, the candidate item set is regarded as a high-frequency item set. A combination
of all the high-frequency single-item sets was then used to generate a second candidate item set. After scanning the database to obtain the support of the second candidate item set, the second high-frequency item set was found and used in combination with the second high-frequency item set to generate a third candidate item set. The algorithm continued to scan the database repeatedly, comparing it with the lowest support level to generate high-frequency item sets, which were then combined to generate the next level of candidate item sets until all the high-frequency item sets were found within the database (Hsu & Chang 2020; Liao & Wen 2009).
Where the Support and Confidence are sufficiently high, it is possible to assert that any future occurrence that includes attribute A will also contain attribute B. However, it is also necessary to estimate the degree of independence of attribute A and attribute B to avoid the situation of obtaining "fictitious" rules, when both the Support and Confidence are high (Makarova et al 2020). The Lift Value is thus required as an indicator to measure the effect of association rules.
■ Lift Value (L): The probability of B appearing alone is compared with the Confidence:
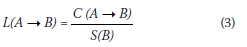
If the Lift Value is greater or equal to 1, it means the items in the rule are likely to be grouped together, suggesting a positive association. If the Lift Value is less than 1, it means that the items in the rule are not likely to be grouped together, suggesting a negative association. Therefore, the value must be at least 1 to indicate that the rule is valid.
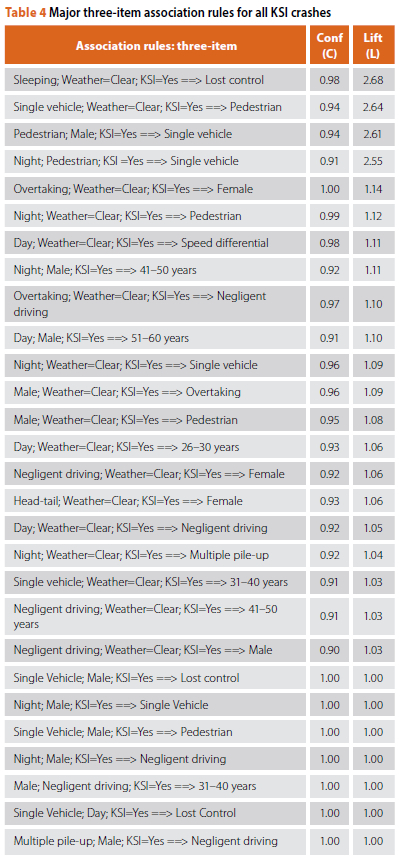
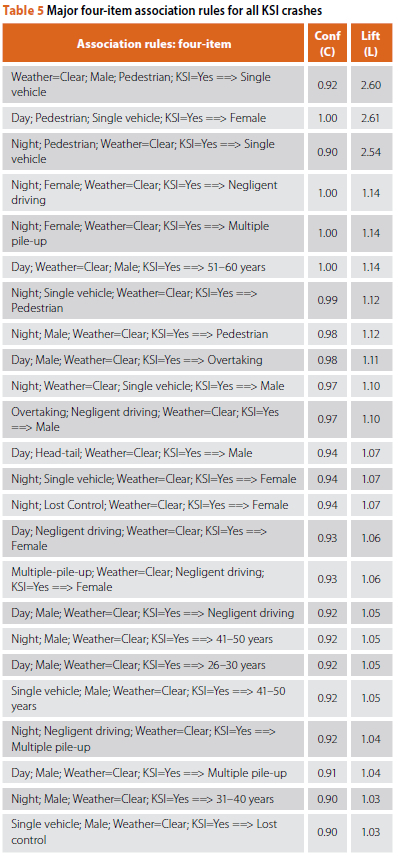
The best rules (rules with the highest Confidence and Lift values) generated during the analysis are summarised in Tables 4 and 5. The three-item and four-item association rules are reported separately, along with the Confidence and Lift Value of each rule. The rules were ranked according to their Lift Value. It should be noted that the Lift Values for the three-item and four-item rules are generally greater than those of the two-item rules. This is an indication that the KSI crashes are the result of a chain of several events (Xu et al 2018).
Association Rule Interpretation
An example to assist with interpreting Association Rules is as follows:
Considering the general Association Rule:
A - B, in C% of times, and this pattern occurs in S% of all events in the dataset, the the first three-item rule shown in Table 4 reads as follows:
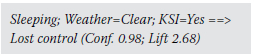
The rule has three items included under the antecedents (left-hand side of the association rule), which represent the items that were observed as a condition or premise. The antecedents specify what is occurring and is, thus, considered the starting point of the rule. These items include Sleeping, Weather=Clear and KSI=Yes.
The rule has one item as the consequent (right-hand side of the association rule), which represents the item that is found to occur in conjunction with the antecedents or predicted to occur in the future. The consequent indicates the outcome or the result that is associated with the group of antecedents. In this example, the item or result consists of Lost control.
The Confidence and Lift values should be interpreted as follows:
■ Confidence (0.98 or 98%): The probability that a recorded crash containing Sleeping, Weather=Clear and KSI=Yes will also contain Lost control.
■ Lift (2.68): The probability of finding Sleeping, Weather=Clear, KSI=Yes and Lost control occurring together is 2.68 times higher than finding any one of them independently in the dataset. The Lift value is greater or equal to 1, indicating that this rule can most likely be used for prediction rather than only a random guess.
The first iteration of the ARA provided 146 rules. However, it was observed that many of the two-item rules were also included under the three-item and four-item rules. As an example, a certain two-item rule reads as follows:
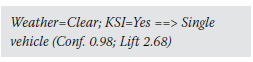
Although the above rule holds a high Confidence Value and the Lift Value is above 1, the information presented adds no real value in explaining the contributing factors to KSI crashes. However, the same rule is included under the first four-item rule shown in Table 5, where it reads as follows:
The additional information presented under the four-item rule adds more value in explaining the contributing factors to KSI crashes. The first ARA ruleset was, therefore, filtered by removing the shorter two-item rules also covered in the longer three-item and four-item rules. Similarly, to prevent the repetition of rules for this study, the second ARA ruleset was further filtered by removing the three-item rules covered in the longer four-item rules.
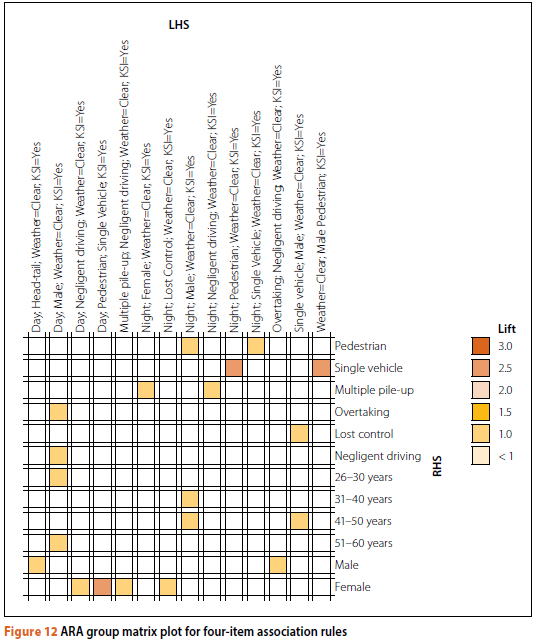
Figures 11 and 12 show the ARA results for the three-item and four-item association rules by using group matrix plots. Grouped matrix plots are a straightforward method of visualising association rules, and provide the rule antecedents grouped as columns and the consequents as rows. The different shades of colours are used as an indication of the measure of the aggregated Lift and signify the relative strength of the interdependency of the factors involved (Xu et al 2018). As previously discussed, where the Lift Value is less than 1 (cells where no colour is applied), it means that the antecedents and consequents are not likely to be grouped together (associated).
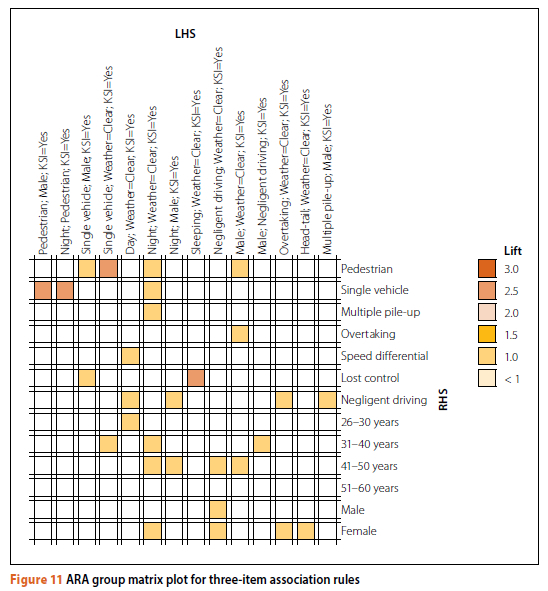
As shown in Table 4 and Figure 11, among the three-item association rules, the most important rules indicate that if a KSI crash occurs during the night, a pedestrian and a single vehicle are likely to be involved. Night-time crashes are also associated with negligent driving and lost-control crashes. Regarding the weather conditions, as with the earlier descriptive statistics, the ARA showed that KSI crashes predominantly occur during clear weather conditions. Important association rules related to the crash type indicate that KSI crashes are mainly associated with single-vehicle and multiple pile-up crashes. As for the causes, pedestrians, sleeping, negligent driving, lost control and overtaking are listed as the most common factors. When considering gender involvement, the three-item association rules indicate that male drivers are more likely to be involved in KSI crashes due to overtaking and negligent driving behaviour, whereas female drivers are more likely to be involved in head-tail and overtaking crashes. As for the age groups, the KSI crash distribution is fairly evenly divided across the different age groups involved, therefore drawing any meaningful conclusions about age group crash tendency may not be conclusive from the association rules.
As indicated in Table 5 and Figure 12, many of the four-item results are similar to those of the three-item results; however, the four-item rules provide an additional factor that has been observed as a condition of the crash. As previously discussed, an effort was made to filter and remove the three-item rules also covered in the longer four-item rules. This was done in an attempt to prevent the repetition of rules, and to ensure that the information presented under the four-item rules is of more value. It is evident from the four-item rules that negligent driving and overtaking were more common in male-driver KSI crashes, during the daytime, in clear weather conditions. Negligent driving and multiple pile-ups were more prevalent factors in female-driver KSI crashes, during the night-time, in clear weather conditions. As for the crash cause, the most common contributory factors for the night-time KSI crashes were shown as pedestrian, male-driver, single-vehicle crashes, whereas pedestrians were a primary contributory factor for the day-time female-driver, single-vehicle KSI crashes.
Comparison of Descriptive Analysis and ARA results
Through its various iterations, the ARA enabled more complex relationships between causal factors to be identified than was possible from the descriptive analysis. At the two-item level of ARA analysis, many of the relationships that had been
identified in the descriptive analysis were recognised; for example, the association between pedestrian involvement and KSI crashes, and the KSI crashes and night-time. However, these relationships were subsequently confirmed with three- and four-item rule analyses. More advanced identification of associations was clearly possible as the number of items increased. Here multiple factors were identified as being related to each other; the example where associations were found between pedestrians, daytime, female driver and single vehicle KSIs is a case in point - this relationship would have been difficult to identify with descriptive statistics alone.
CONCLUSIONS AND RECOMMENDATIONS
The main objective of the study was to determine whether ARA analysis can add value and improve the quality of the conclusions that could be drawn from the analyses of crash databases, compared with traditional descriptive analysis. Descriptive statistics were first employed to investigate the characteristics of KSI crashes. ARA was then applied to investigate the combinations of contributory factors that typically occur together in KSI crashes.
When comparing descriptive statistical analysis methods with ARA, this study found that each method has a specific importance and application in crash data analysis. Association analysis and descriptive statistical analysis serve different purposes and each was found to have distinct benefits. Descriptive statistical analysis was shown to be effective in describing the important characteristics of a dataset, such as the mean, median, mode, variance, and standard deviation, and can be used fairly easily to gain a better understanding of the data and to identify trends.
The descriptive analysis painted a fairly static snapshot of some of the main features of the crashes, and in so doing demonstrated quite clearly that the mechanisms of KSI crashes are somewhat different from those of the all-category crashes. However, there were limitations to what could be understood. Some of the findings needed secondary data as context to be useful. For example, the role of gender and time needed information about overall gender patterns and traffic volumes which are not immediately available, and so any conclusions about these two elements are speculative at best. Further, the nuanced relationships between the primary and secondary causes could not be analysed -the role of negligence in overtaking, for example, was impossible to establish.
ARA helped to avoid some of these issues by looking purely at the statistical probability of the relationship between factors, which allowed for greater depth of interrogation and understanding of the combination of factors that appear most commonly within the crash database. The study findings from the ARA analysis of KSI crashes clearly showed that the occurrence of such crashes is complex and typically involve various interactions between different contributory factors.
In this study, it was not possible to assess how well ARA could be used to predict what crashes to expect in the future. The more ARA analysis is carried out, the greater confidence may be had in its predictive ability. Assuming the relationships it identifies to be valid, however, the grouping of factors lend themselves to be looked at as areas where improvements - in engineering, enforcement or education - could be beneficial. In this way, the ARA does have superior potential to inform policy over conventional descriptive statistics.
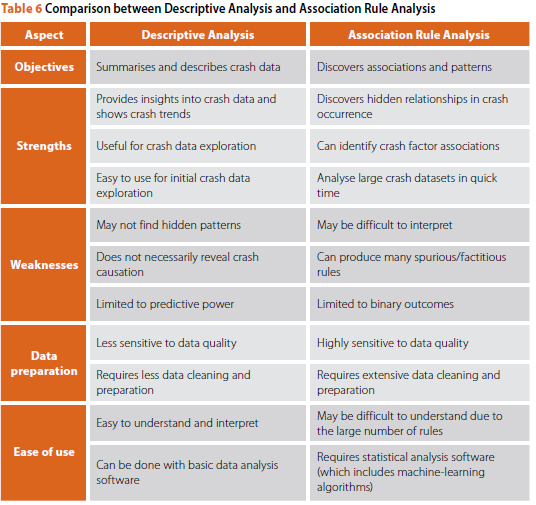
A common conclusion for both the ARA and the descriptive analysis is the fact that KSI causation analysis is complex and requires as many and as sophisticated methods of analysis as are available. In terms of the value to researchers in the future, Table 6 provides a general comparison between descriptive analysis and ARA that emerged from the study.
A secondary objective of the study was to determine what obstacles, if any, had obstructed the full and effective use of ARA. By far the most important obstacle in this regard relates to the quality of reported crash data. Crash data in South Africa has long been criticised for being incomplete and unreliable, and these issues pose serious challenges for any advanced analysis, especially ARA. Much of the problem is a consequence of the limited and oversimplified categories of contributory factors presented within the SA accident report. Crash reports do not cover, in detail, all primary and secondary crash causation factors, or give an indication of the confidence associated with the identification of each factor. This deficiency necessitates a time-consuming and subjective evaluation of individual crash reports to be carried out to determine the most likely combination of primary and secondary causes for each crash. A better-designed system of causation factor recording would significantly improve the raw data available for advanced statistical analysis in the future, and reduce the need for subjective evaluations to be made.
Overall, the application of ARA in this study was found to produce a richer understanding of the crash causes and strength of associations between them than was possible using descriptive analysis only. However, the cleaning up and interpretation of raw data to identify primary and secondary causes - which was a prerequisite for the analysis - was both time-consuming and introduced an element of subjectivity into the analysis. For ARA to become an effective and accessible tool for crash analysis in the future, the quality of the data, and in particular the recording of the contributory factors associated with each crash, must be improved. Until then we conclude that ARA can be a useful supplement to conventional descriptive analysis, but only with extensive data cleaning and interpretation.
ACKNOWLEDGEMENT
This work was supported by Trans African Concessions (Pty) Ltd (TRAC). The authors would like to thank TRAC for providing us with the traffic and crash data used in this research paper.
REFERENCES
AAA Foundation for Traffic Safety 2016. Prevalence of self-reported aggressive driving behaviour. Washington, DC: AAA. [ Links ]
AASHTO 2010. Highway Safety Manual. Washington, DC: American Association of State Highway and Transportation Officials. [ Links ]
Agrawal, R & Srikant, R 1994. Fast algorithms for mining association rules in large databases. Proceedings, 20th International Conference on Very Large Databases, 487-499. Available at: https://www.vldb.org/conf/1994/P487.PDF. [ Links ]
Alfonsi, R, Ammari, A & Usami, D S 2018. Lack of driving experience. European Road Safety Decision Support System. H2020 Project Safety Cube. Available at: https://www.roadsafety-dss.eu/assets/data/pdf/synopses/Lack_of_driving_experience_032018.pdf. [ Links ]
Al Mutairi, A, Al Kandari, D, Shummais, L, Al Ajmi, R & Toma, T 2021. Association rule mining for driving behaviors and road traffic accidents in Kuwait. Proceedings, 11th Annual International Conference on Industrial Engineering and Operations Management, 7-11 March 2021, Singapore, 7550-7757. Available at: http://www.ieomsociety.org/singapore2021/papers/1301.pdf. [ Links ]
Austroads. 2009. Guide to Road Safety Part 4: Safe Roads. Sydney, Australia: Austroads. [ Links ]
Austroads 2019. Passing Lanes. Safety and Performance. Sydney, Australia: Austroads. [ Links ]
Bai, Y & Li, Y 2006. Determining major causes of highway work zone accidents in Kansas. Report K-TRAN: KU-05-01. Lawrence, KS: University of Kansas. Available at: https://kuscholarworks.ku.edu/bitstream/handle/1808/20031/KTRAN.pdf?sequence=1&isAllowed=y. [ Links ]
Bener, A & Crundall, D 2008. Role of gender and driver behaviour in road traffic crashes. International Journal of Crashworthiness, 13(3): 331-336. doi:10.1080/13588260801942684 [ Links ]
Cumming R W & Croft P G 1973. Human information processing under varying task demand. Ergonomics Australia, 16(5): 581-586. Available at: https://pubmed.ncbi.nlm.nih.gov/4772983/134. [ Links ]
Dragutinovic, N & Twisk, D 2005. Use of mobile phones while driving: Effects on road safety. Leidschendam, Netherlands: SWOV Institute for Road Safety Research. Available at: https://www.researchgate.net/publication/251880438_Use_of_mobile_phones_while_driving_effects_on_road_safety_a_literature_review. [ Links ]
Dultz, L A, Frangos, S, Foltin, G, Marr, M, Simon, R, Bholat, O & Pachter, H L 2011. Alcohol use by pedestrians who are struck by motor vehicles: How drinking influences behaviors, medical management, and outcomes. Journal of Trauma, 71(5): 1252-1257. Available at: https://jhu.pure.elsevier.com/en/publications/alcohol-use-by-pedestrians-who-are-struck-by-motor-vehicles-how-d. [ Links ]
Feng, M, Ren, J & Xi, Y 2019. Association rule mining for road traffic accident analysis: A case study from UK. Proceedings, International Conference on Brain Inspired Cognitive Systems (BICS 2019), Guangzhou, China, 520-529. doi:10.1007/978-3-030-39431-8-50 [ Links ]
Frank, E, Hall, M A & Witten, I H 2016. The WEKA workbench. Appendix to Data Mining: Practical Machine Learning Tools and Techniques, 4th ed. Burlington, MA: Morgan Kaufmann. [ Links ]
Garber, N J & Hoel, L A 2009. Traffic and Highway Engineering, 4th ed. Toronto: Cengage Learning. [ Links ]
Hsu, Y & Chang, S 2020. Using association rule mining to analyze the accident characteristics of intersection with different control types. International Journal of Applied Science and Technology, 10(1): 45-54. [ Links ]
ITF (International Transport Forum) 2021. Road Safety Annual Report 2021: The Impact of Covid-19. Paris: OECD Publishing. [ Links ]
Liao, S H & Wen, C H 2009. Data mining and business intelligence, 1st ed. Taipei City: Yeh Yeh Book Gallery. [ Links ]
Jiménez-Mejías, E, Prieto, C A, Martínez-Ruiz,V, Luna del Castillo, J, Lardelli-Claret, P et al 2014. Gender-related differences in distances travelled, driving behaviour and traffic accidents among university students. Transportation Research. Part F: Traffic Psychology and Behaviour, 27(PA): 81-89. doi:10.1016/j.trf.2014.09.008 [ Links ]
Li, L, Sharad, S & Gongzhu, H 2017. Analysis of road traffic fatal accidents using data mining techniques. Proceedings, 15th International Conference on Software Engineering Research, Management and Applications, 7-9 June 2017, London, 363-370. Available at: https://ieeexplore.ieee.org/stamp/stamp.jsp?tp=&arnumber=7965753. [ Links ]
Makarova, I, Yakupova, G, Buyvol, P, Mukhametdinov, E & Pashkevich, A 2020. Association rules to identify factors affecting risk and severity of road accidents. Proceedings, 6th International Conference on Vehicle Technology and Intelligent Transport Systems, 614-621. Available at: https://www.scitepress.org/Papers/2020/98365/98365.pdf. [ Links ]
Massie, D L, Campbell, K L & Williams, A F 1995. Traffic accident involvement rates by driver age and gender. Accident Analysis and Prevention, 27(1): 73-87. doi:10.1016/0001-4575(94)00050-V [ Links ]
NDP (National Development Plan, South Africa) 2030. Available at: https://www.gov.za/issues/national-development-plan-2030. [ Links ]
Oltedal, S & Rundmo, T 2006.The effects of personality and gender on risky driving behaviour and accident involvement. Safety Science, 44(7): 621-628. doi:10.1016/j.ssci.2005.12.003 [ Links ]
Oluwole, A M, Rani, M R B A & Rohani, J M 2014. Developing a conceptual road safety framework to construct road safety regression outcome. ARPN Journal of Engineering and Applied Sciences, 9(4): 536-541. Available at: http://arpnjournals.com/jeas/research_papers/rp_2014/jeas_0414_1068.pdf. [ Links ]
Reason, J, Manstead, A, Stradling, S, Baxter, J & Campbell, K 1990. Errors and violations on the roads: A real distinction? Ergonomics, 33(10-11): 1315-1332. Available at: https://www.researchgate.net/publication/261592120_. [ Links ]
Regev, S, Rolison, J J & Moutari, S 2018. Crash risk by driver age, gender, and time of day using a new exposure methodology. Journal of Safety Research, 66(2018): 131-140. Available at: https://www.sciencedirect.com/science/article/pii/S0022437517307600. [ Links ]
RTMC (Road Traffic Management Corporation) 2017. National Road Safety Strategy 2016-2030 (NRSS). Johannesburg: RTMC. [ Links ]
RTMC 2020. Status of Road Safety Report: Calendar: January-December 2019. Johannesburg: RMTC. [ Links ]
SWOV Institute for Road Safety Research 2012. The relation between speed and crashes. SWOVFact sheet. Leidschendam, Netherlands: SWOV. [ Links ]
Tariq, M, Mehmood, N & Mahfooz, S 2022. Discovering associated factors behind road accidents using association rule mining: A case study from Gujarat, Pakistan. World Journal of Advanced Research and Reviews, 15(3): 1-11. doi:10.30574/wjarr.2022.15.3.0885 [ Links ]
Thiffault, P & Bergeron, J 2003. Monotony of road environment and driver fatigue: A simulator study. Accident Analysis and Prevention, 35(2003): 381-391. Available at: https://web.ics.purdue.edu/~duffy/IE486_Spr07/IE486_p14_Accid%20Anal%20Prv.pdf. [ Links ]
TRB (Transportation Research Board) 2015. Human factors guidelines for road systems. NCHRP Report 600, 2nd ed. Washington, DC: TRB, National Cooperative Research Program. Available at: https://onlinepubs.trb.org/onlinepubs/nchrp/nchrp_rpt_600second.pdf. [ Links ]
Turner, C & McClure, R 2003. Age and gender differences in risk-taking behaviour as an explanation for high incidence of motor vehicle crashes as a driver in young males. Injury Control and Safety Promotion, 10(3): 123-130. doi:10.1076/icsp.10.3.123.14560 [ Links ]
Wang, J S, Knipling, R R & Goodman, M J 1996. The role of driver inattention in crashes: New statistics from the 1995 Crashworthiness Data System. Proceedings, 40th Annual Conference of the Association for the Advancement of Automotive Medicine, 7-9 October 1996, Vancouver, Canada. Available at: https://trid.trb.org/view/476093. [ Links ]
Wang, J-S 2022. MAIS(05/08) Injury probability curves as functions of Delta V. Report DOT HS 813 219 -May 2022. Washington, DC: National Highway Traffic Safety Administration. [ Links ]
WHO (World Health Organization) 2018. Global status report on road safety 2018. Available at: https://www.who.int/publications/i/item/9789241565684. [ Links ]
WHO 2021. WHO kicks off a Decade of Action for Road Safety. Available at: https://www.who.int/news/item/28-10-2021-who-kicks-off-a-decade-of-action-for-road-safety. [ Links ]
Zhao, X, Zhang, X & Rong, J 2014. Study of the effects of alcohol on drivers and driving performance on a straight road. Mathematical Problems in Engineering, 2014 (1): 1-9. doi:10.1155/2014/607652 [ Links ]
Xu, C, Boa, J, Wang, C & Liu, P 2018. Association rule analysis of factors contributing to extraordinarily severe traffic crashes in China. Journal of Safety Research. doi:10.1016/j.jsr.2018.09.013 [ Links ]
 Correspondence:
A J Gelderblom
SNA Civil and Structural Engineers (Pty) Ltd
PO Box 72727 Lynnwood Ridge Pretoria 0040 South Africa
E: gelderblom.a@sna.co.za
M Sinclair
Department of Civil Engineering, Stellenbosch University
Private Bag X1, Matieland 7602, South Africa
E: msinclair@sun.ac.za

ANDRÉ GELDERBLOM is the Technical Manager for Traffic and Transportation Engineering at SNA Civil and Structural Engineers (Pty) Ltd. He has more than 18 years of experience in the field of transportation engineering, which includes the supervision, construction and design of various road infrastructure projects. He holds a BSc (Hons) degree from the University of Pretoria and an MEng (Civil Engineering) from Stellenbosch University, specialising in Transportation Engineering. His key areas of experience include contract administration, project management, traffic capacity studies, road safety analysis, and transport economics. His fields of interest include road safety engineering and traffic capacity studies.

PROF MARION SINCLAIR is an Associate Professor in Transportation within the Department of Civil Engineering at Stellenbosch University. Her specialist field is road safety, focusing on human factors contributing to road risk, as well as on societal problems emerging from traffic crashes and injuries. She has spent the last 20 years working in this field, shared between international road safety planning and implementation, and research and teaching of road safety problems and solutions in South Africa. In her current post she is responsible for teaching road safety to undergraduate and postgraduate civil engineering students, and for carrying out research and commercial projects.

