


Servicios Personalizados
Articulo
 Inglés (pdf)
 Articulo en XML
 Referencias del artículo
Indicadores

Links relacionados
-
 Citado por Google
 -
 Similares en Google
Compartir

 Permalink
Journal of the South African Institution of Civil Engineering
versión On-line ISSN 2309-8775
versión impresa ISSN 1021-2019
J. S. Afr. Inst. Civ. Eng. vol.65 no.4 Midrand dic. 2023
http://dx.doi.org/10.17159/2309-8775/2023/v65n4a3
TECHNICAL PAPER
Structural assessment of an ASR-affected reinforced concrete bridge
H Kirchner; J van Rooyen; P F van der Spuy; G P A G van Zijl
ABSTRACT
ASR (alkali-silica reaction) has long been acknowledged as a key consideration when designing concrete structures in South Africa. This study raises awareness of the influence of ASR on the structural behaviour of reinforced concrete bridge structures. Aggregate type plays a role in how the ASR develops over the structural life cycle. Greywacke aggregate is found to be prominent in ASR-affected structures within the Western Cape region, and in the structure that was investigated. ASR decreases concrete tensile strength, compressive strength, and E-modulus over time. To develop a standardised approach that can be replicated on other bridge structures, a simply supported rectangular reinforced concrete bridge deck slab was analysed. The slab was modelled according to the construction drawings, including the reinforcement detailing, to determine the ultimate shear and moment resistance according to the code (BS 1972) used for the original design, and current Eurocode standards, for both unaffected and ASR-affected concrete. Traffic load was determined from the relevant TMH7 standard, and from weigh-in-motion data collected at a station on the high-traffic-volume route crossing the bridge. Due to compressive strength being the least affected material property by ASR deterioration, the ultimate resistance to original design loads was found to be sufficient.
Keywords: bridges, concrete, ASR, structural deterioration, weigh-in-motion, greywacke
INTRODUCTION
The first case of alkali-silica reaction (ASR) in South Africa was identified in a structure in Cape Town by Oberholster and Brandt (1976). The prevalence of ASR-induced deterioration is most pronounced in the Western Cape, primarily attributed to the usage of reactive greywacke rocks (sourced from the Malmesbury Group) as coarse aggregate. It explains why ASR is a relevant deterioration process affecting concrete structures within the regional infrastructure network. Concrete mix design regulations have since been standardised, and elaborate guidelines are given on how to either avoid the use of reactive aggregates, or how to appropriately proportion mix ingredients to avoid or limit the reaction in new structures (refer to the latest reference documents:
SANS 50206 2015; Fulton 2021). Following the diagnosis of ASR in a concrete structure, the main focus up until now has been on addressing and supressing existing ASR development from a material perspective, and on performing visual inspection for recurrence of symptoms when conducting routine inspection at subsequent, regular intervals. Pertinent consideration of the overall remaining service-life of ASR-affected structures and the influence of ASR on the structural behaviour is rare in literature and is also not evident in liaison with local bridge engineers. The reader is referred to a compilation of cases on the structural effect of ASR on concrete (Blight & Alexander 2011).
ASR affects infrastructure in general, and the focus of this paper is on bridge structures within the Western Cape. According to the South African National Roads Agency Limited (SANRAL), South Africa has 754 600 km of integrated road network which includes many bridges and culverts as supporting structures. To assist with managing this extensive infrastructure network, a bridge management system (BMS) was adopted. SANRAL implemented the BMS in 1998 shortly after its introduction to South Africa two years earlier by the National Rail Authority (Nordengen & De Fleuriot 1998). Due to many of the existing bridges predating the implementation of this system, accurately quantifying service-life, including any form of long-term tracking of bridges, is significantly complicated.
Mbanjwa (2014) investigated bridge and culvert structures within the Western Cape. The dataset that was used formed part of the STRUMAN Bridge Management System and was obtained from the Western Cape Government. The research consisted of a total of 791 bridges that were evaluated based on the bridge inspection data collected through routine maintenance conducted by certified bridge inspectors. The data was then grouped into various categories, including bridge type, span length, and age. The study also focused on the condition and priority indices of the bridges outlined in Technical Methods for Highways (TMH), most notably the overall condition index (OCI) and overall priority index (OPI).
Concrete degradation due to ASR
Continued crack development due to ASR could influence the overall structural behaviour. Petrographic tests were conducted by Saouma et al (2015) to assist with predicting ASR development with time. The extent of ASR correlates with the following four stages of deterioration, also illustrated in Figure 1(a):
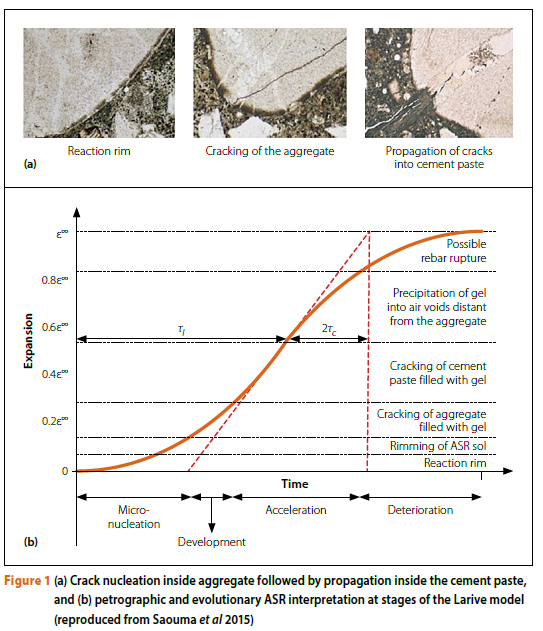
■ Stage 1: Micro nucleation - ASR commences at the edge of the aggregate, also known as the reaction rim, without any expansion taking place.
■ Stage 2: Development of the reaction -expansion of alkali-rich ASR gel stored within the micro-textures of the reacting aggregates commences.
■ Stage 3: Surge in the rate of the reaction and degradation process - the cement paste starts cracking and is accompanied by gel-filling, which leads to an increase in crack width and density; the deterioration becomes visible to the naked eye.
■ Stage 4: Significant degradation of material - active concrete expansion leads to severe damage and structural failures; these failures include loss of structural integrity, distortion, and possible rupture of rebar.
Larive model
The Larive kinematic model expresses the ASR extent ξ(t) as a normalised function of time as:
in which the time scale parameters for ASR evolution are the latency time τι and characteristic time τ0 depicted in Figure 1(b). The ultimate expansive ASR strain ε" for a particular concrete scales the extent to ASR strain:
The sigmoid-shaped curve is corroborated by experimental data regression, from the relatively low initial expansion rate characterised by τι to the reduced strain rate beyond the inflection point captured by the characteristic time. Both latent and characteristic times are functions of temperature, incorporating increased ASR reaction rate at elevated temperatures (Ulm et al 2000; Pourbehi et al 2019; Alaud & Van Zijl 2017). Jones and Poole (1986) reported that high moisture levels are required within the concrete for alkali-silica gel to absorb water and expand. The internal relative humidity levels are required to be above 75-85%, and this can be maintained when the concrete is exposed to continuous wetting (as in concrete dam structures), periodic wetting, damp environments, or exposure to sea spray in concrete bridge structures.
When an affected structure reaches the stage where the reaction has slowed down enough, maintenance and structural repairs can be done without subsequent severe damage being caused by ASR. Structural repair at earlier stages should consider the potential structural effects of continued expansion.
IDENTIFICATION OF AN ASR-AFFECTED BRIDGE
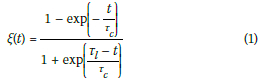
The Sir Lowry's Pass Viaduct on National Route 2 (N2) was identified as a suitable structure for further investigation, motivated by its role as critical infrastructure that connects the Eastern Cape and the Western Cape. The pass originates from nearly two centuries ago, and the most recent addition of the widened viaduct under consideration, shown in Figure 2(a), was designed in the late 1970s and construction was completed in 1984. Bridge inspection reports for the viaduct confirm localised ASR, also in the reinforced concrete (RC) bridge deck slabs. Upon further research into the history of the structure, as captured in the field inspection reports since 1998, it was noted that the affected elements had been identified as severely affected more than 20 years ago during some of the first inspections. This led to cores being extracted from a specific slab, denoted S7, which was the worst affected. Petrographic test results confirmed the presence of ASR in the element in question, followed by remedial works in 2001. Subsequent BMS bridge inspection sheets reflect that the condition of the bridge improved in the years after the remedial work, while the inspection reports of 2012 and since indicate the return of and increased ASR deterioration. The history confirms the arrest of ASR evolution by sealing intervention, but continuation once favourable wetting by moisture penetration recurs. For example, once waterproof sealing applied during remedial intervention deteriorates, and is not restored, the ASR process continues.
In the following section the bridge condition will be assessed in terms of ASR progression from BMS inspection reports, and the viaduct condition will be evaluated in the context of the Western Cape regional bridge infrastructure, all towards motivating the selected case study and deriving ASR-deteriorated concrete strength and stiffness properties for the structural integrity assessment of a viaduct deck slab.
BMS report findings
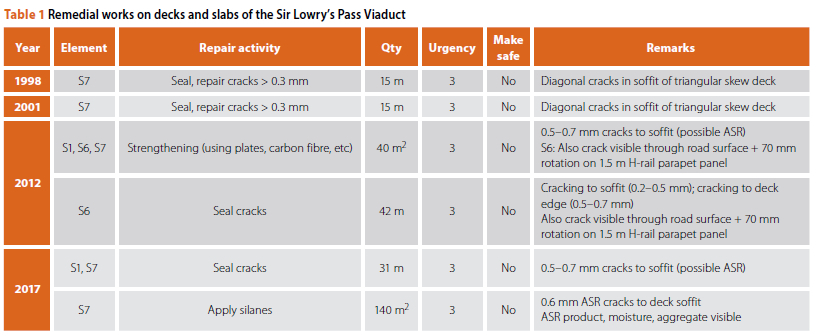
The STRUMAN BMS report consists of 21 inspection items, which include structural elements such as beams, piers, spans and abutments. It is accompanied by a list of rehabilitative recommendations to address identified problems or defects. The report provides information on two aspects. Firstly, it identifies problematic sections within the structure, and secondly, it expresses the increase in remedial work necessary to rehabilitate affected sections. ASR was listed as a structural defect in the viaduct in 6 of the 21 inspection categories, indicating widespread presence in the structure. The affected elements are classified as structural concrete elements outlined in TMH19 (2018). A summary is presented in Table 1 Three deck slab spans, denoted as S1, S6 and S7, showed signs of ASR degradation. The slab layout is indicated in Figure 2(b). Between 1998 and 2017 the degree rating for these elements ranged from warning to severe, the extent from more than local to less than general, and the relevancy from structural integrity or safety compromised to potentially a serious impact on structural integrity and/or user safety. Cracking was the most prevalent structural defect noted consistently in the deck slab elements, stretching as far back as 1998 for slab S7. Table 1also briefly remarks on the remedial works performed.
Determining the ASR level of expansion and structural severity rating
An empirical relationship was established with the Council for Scientific and Industrial Research (CSIR) in the Western Cape, as an approach to approximate the level of ASR-expansion from the mean ASR-induced crack width as follows (Putterill & Oberholster 1985; Oberholster 2009):

with eASR% being the ASR strain expressed in % and the mean crack width wc in mm.
Measurements on concrete beams, exposed to local Western Cape outdoor environmental conditions, were conducted to develop this relation. To evaluate the reinforcement restraint to ASR expansion and crack width, the test beams included reinforced and unreinforced specimens. It should be noted that Equation 3 is an approximation to be used with care, and crack widths used for the approximation should exclude effects of mechanical action, imposed drying shrinkage and/or thermal expansion. A method to accurately establish the actual ASR expansion in a structure does not exist yet. An alternative method of approximation could be to extract cores from affected and unaffected regions from the structure, and to subject them to accelerated ASR laboratory tests. Pourbehi (2019) and Kongshaug et al (2022) have also simulated original concrete mixes, cast and tested concrete specimens for mechanical characteristics as well as ASR expansion in accelerated tests, and performed inverse computational analyses of the structure with characterised mechanical and ASR model parameters to establish likely ASR expansion in the affected structure by simulating actual, monitored displacement and cracking responses.
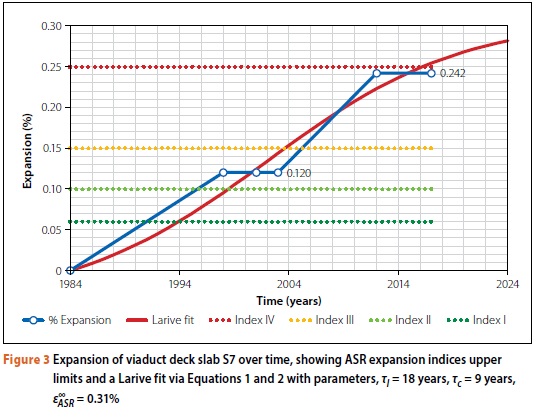
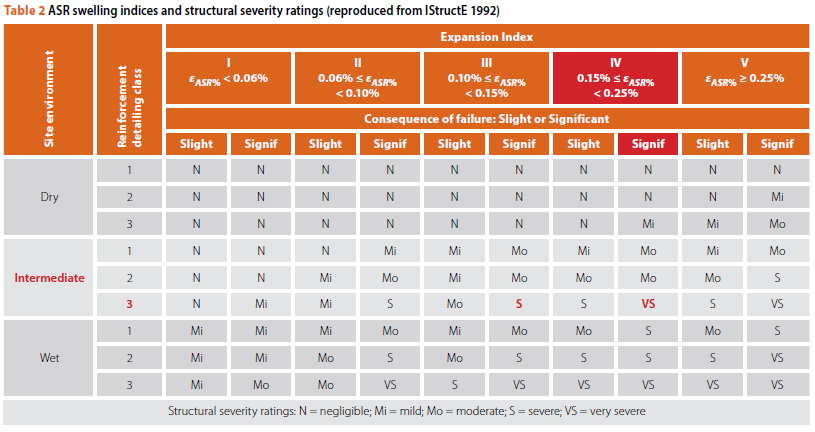
From Equation 3 typical ASR crack widths in the range of 0.15 to 0.90 mm are associated with ASR expansion of 0.07% (0.7 mm/m) and 0.30% (3.0 mm/m). Figure 3depicts the ASR expansion of concrete in viaduct deck slab S7, derived from the crack widths reported in Table 1and substituted into Equation 3. The data obtained from the reports was then used to fit a curve based on the Larive model for this specific ASR-affected structure. The British Institution of Structural Engineers categorises ASR expansion indices from I to V, as summarised in Table 2(IStructE 1992). The deterioration in the viaduct deck slabs has evolved to index IV (Figure 3. Given the reinforcement detail, coastal proximity and significant consequence of failure, the viaduct slab elements are deemed to be in the very severe structural deterioration rating category.
Condition assessment
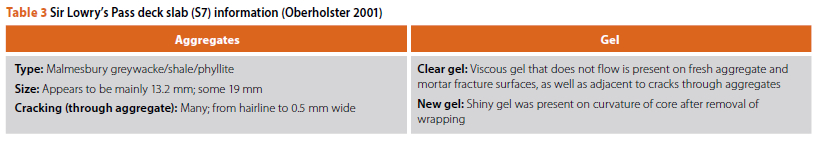
During a rehabilitation project on the viaduct in 2001, two cores were taken from an abutment and deck slab S7, respectively. The reason for only two cores being taken can be attributed to scope limitations which only allowed for a minimalist assessment approach. Points of interest about the core taken from deck slab S7 are summarised in Table 3 The report concluded that ASR appeared to have been extensive and was still active. Cracks of up to 0.5 mm wide confirmed a severe to very severe structural category already in 2001.
Overall condition and priority indices
From the BMS reports the respective OCI and OPI ratings for the inspection sub-items, main items, and overall structure were obtained. The OCI and OPI indices are used to prioritise repair and rehabilitation for bridge structures. The indices are predetermined by the BMS database itself from the accredited bridge engineering inspector's ratings, and the values range from 0 to 100, with 100 denoting a perfect condition. The condition categories and index ratings for both OCI and OPI are elaborated in TMH22 (2013).
Overall Condition Index (OCI) evolution
Figure 4shows how the Sir Lowry's Pass Viaduct compares to other categories of bridges within the Western Cape, as expressed by the OCIs gathered from BMS inspection reports. The dashed line representing the viaduct shows a sudden spike in 2006 and subsequent steep decline to 2012. The upward spike is considered an anomaly, motivated by the fact that no record of intervention could be found for the period 2003 to 2006, together with the low OCI reported in the 2012 BMS report. The solid line in Figure 4representing the viaduct OCI score replaces the outlying value for 2006 with the average of those for 2003 and 2012. From Figure 4it can be seen that the OCI of the Sir Lowry's Pass Viaduct lags behind the averages for bridge structures in its category, i.e. simply supported decks with span lengths between 5 m and 9.99 m located in and managed by the City of Cape Town Municipality. The latter results are reported research results by Mbanjwa (2014), based on BMS results of bridges managed by the City of Cape Town. The OCI values of bridges in this category have remained at an average value of 82. The average reference age refers to the average OCI rating for structures of the same age (38 years) as the Sir Lowry's Pass Viaduct. Compared to the average reference age rating the viaduct is in a significantly worse condition than the average trend.
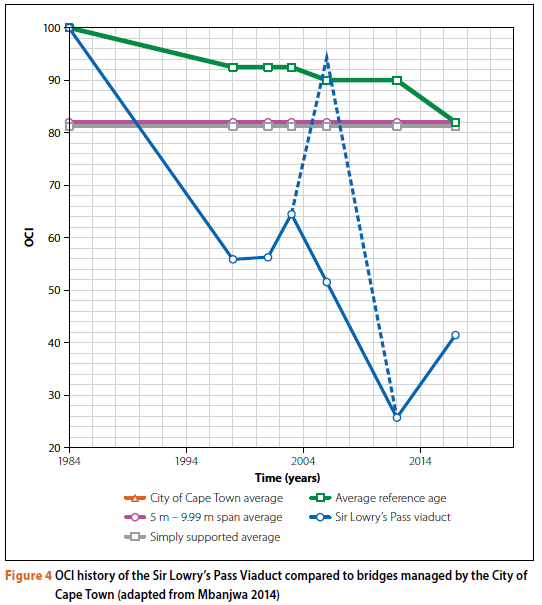
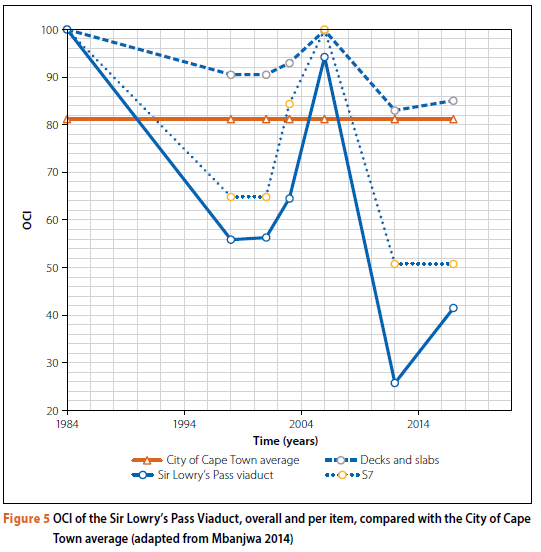
Figure 5(on page 27) compares the OCI evolutions for the Sir Lowry's Pass Viaduct decks and slabs inspection item, as well as sub-item S7 to the viaduct overall OCI and the City of Cape Town averages, confirming that deck slab S7 in particular is in poor condition.
Overall Priority Index (OPI) evolution
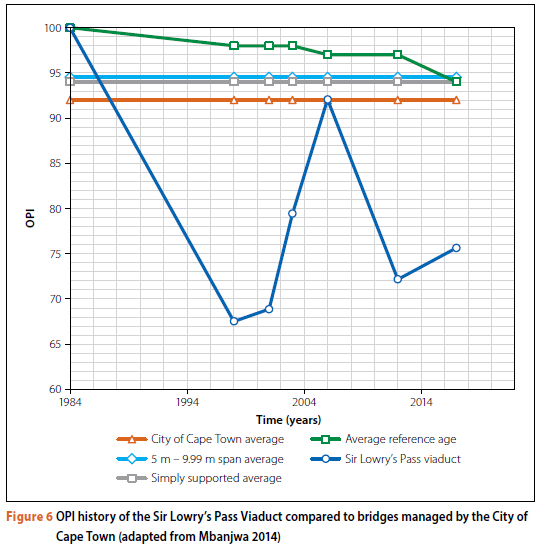
Figures 6and 7 show the OPI evolution over the Sir Lowry's Pass Viaduct life span since 1984, compared with OPI values for the City of Cape Town bridges reported by Mbanjwa (2014). From these figures it can be seen that the OPI for the Sir Lowry's Pass Viaduct and the structural elements under investigation there, are lower than those for other bridge structures in the region in the same category. The viaduct decks and slabs, including slab S7, have particularly low ratings and are therefore a concern.
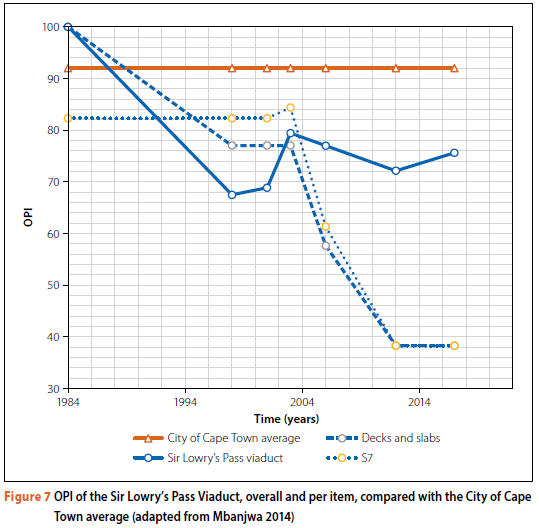
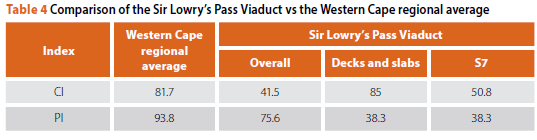
Mbanjwa (2014) reported that the average OCI and OPI for RC bridges in the Western Cape was 81.7 and 93.8 respectively. The average OPI greater than 75 suggests that the majority of the structures were in a good condition. The current condition index for the Sir
Lowry's Pass Viaduct is significantly lower than the standard warning level of OCI < 70 and is indicative of the need for prioritisation and remedial work activities. The priority index for the viaduct was found to be significantly below the regional average. The viaduct is compared to the Western Cape region in Table 4 Decks and slabs are severely affected, and specifically sub-item S7 is identified as a critical structural element that warrants further investigation. Both the OCI and OPI of this slab are low, with the OPI being of particular concern.
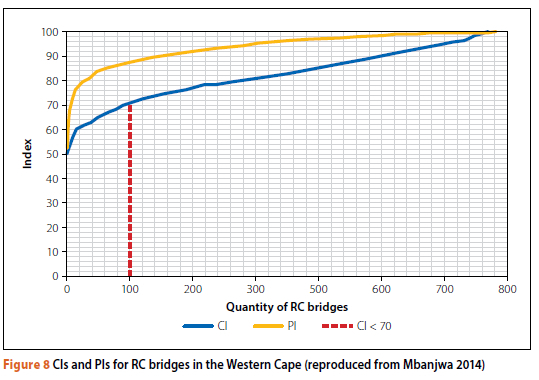
Mbanjwa (2014) found that 103 reinforced or prestressed concrete bridges from a total of 791 in the Western Cape had an OCI of less than 70, as can be seen in Figure 8 This places the Sir Lowry's Pass Viaduct at the end of this spectrum. The OPI of 75.6 (Table 4 also places it on the lowest 15% of the recorded 791 bridges, and the lowest OCI value.
REDUCTION OF MATERIAL PROPERTIES
Empirical ASR-induced concrete strength and stiffness reduction
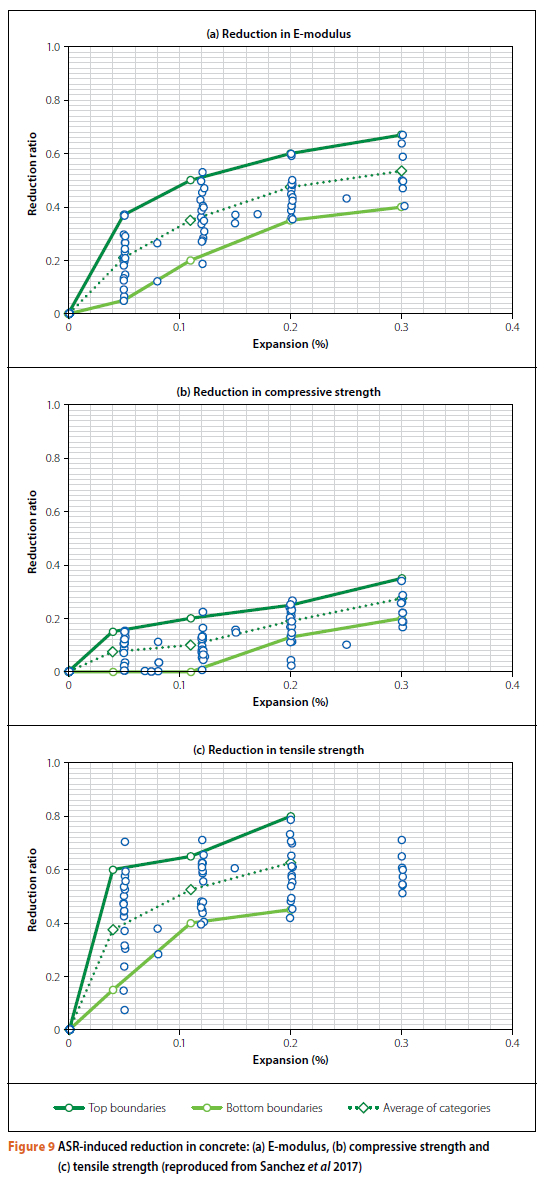
From the results of an extensive experimental research programme on ASR expansion, consequential microscopic damage, and mechanical strength and stiffness reduction, Sanchez et al (2017) proposed the ASR-induced concrete deterioration categories presented in Table 5 These five categories are not dissimilar to the five Severity Index categories in Table 2 Notably, the categories are presented independently from the concrete strength class, aggregate type, or binder composition, implying that the deterioration in strength and stiffness is related to ASR-induced swelling, and not to the particular concrete composition.
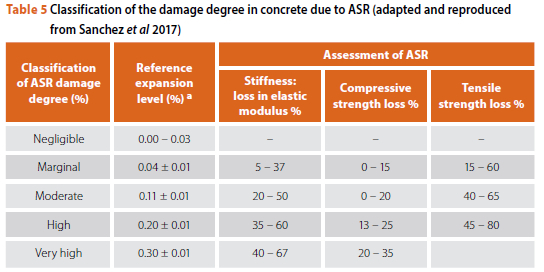
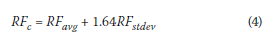
The lower and upper limits of the ASR deterioration categories in Table 5are depicted in Figure 9 also showing the test data points from the elastic stiffness (E-modulus), compressive and tensile strength tests performed (Sanchez et al 2017). The averages between the upper and lower bounds are plotted as dashed lines on the graphs and are proposed as first estimate of reduction in concrete mechanical properties based on ASR expansion estimated from Equation 3. This does not replace meticulous structural assessment, but informs the infrastructure management process. Once a decision is made to apply remedial structural strengthening and/or stiffening, appropriate characterisation tests should be performed on the actual structural concrete. In a structural reliability approach, a characteristic value of strength reduction could be determined and used together with appropriate material resistance factors. This requires sufficient strength and stiffness test data, from which for a normal distribution the ninety-fifth percentile characteristic reduction factor RFc is calculated from the average RFavg and standard deviation RFstdev as follows:
Estimated strength and stiffness reduction in the Sir Lowry's Pass Viaduct
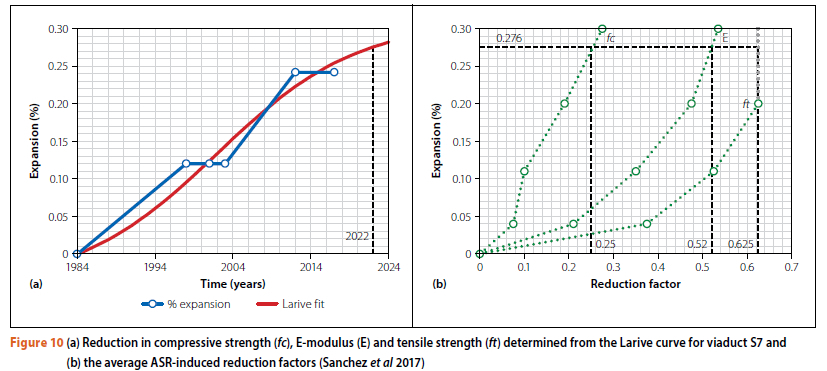
The 2017 ASR expansion in viaduct deck slab S7 is estimated to be 0.242% (see Figure 3, based on recorded ASR crack widths in the slab (Table 1 and Equation 3. Subsequent BMS inspection reports are not available to confirm to what level ASR expansion progressed since 2017 to 2022 at the date of this research. An estimate presented in Figure 3 using Equations 1 and 2 with parameters τι = 18 years, tc = 9 years and ε°Asr = 0.31% reasonably fits the ASR evolution of S7. It must be noted that these parameters remain to be confirmed for the viaduct concrete, whether by appropriate standardised ASR expansion tests, or from more recent BMS site inspection reports including ASR-induced crack widths. From the empirical relation in Equation 3, a crack width of 0.92 mm is associated with the asymptote ultimate swelling strain of 0.31%.
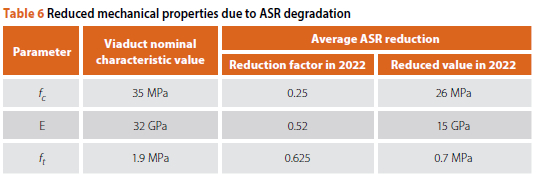
Figure 10illustrates the determination of the 2022 ASR-induced reduction factors for strength and stiffness, and collates the ASR evolution for S7 from Figure 3and the reduction factors for E-modulus, compressive strength and tensile strength of Figure 9 Note that average reduction factors (RFaVg) are used. Should sufficient strength and stiffness reduction data become available by extraction of cores and testing of ASR-affected infrastructure, characteristic reduction factors (RFc) may be derived as proposed by Equation 4. For 2022, the average reduction factors are shown to be 0.25, 0.52 and 0.625 for compressive strength, E-modulus and tensile strength respectively.
In lieu of characterised data, the viaduct S7 concrete design mechanical strength is assumed based on the class 35 MPa concrete specified on the construction drawings. In the South African context, this is a characteristic compressive cube strength. The nominal E-modulus and characteristic tensile strength associated with this compressive strength class is 32 GPa and 1.94 MPa, respectively (EN 1992-1-1) (EN 2004). Although it is known that concrete strength and stiffness typically increase beyond the 28-day compressive strength classification, the nominal values are used here for illustrative purposes. Table 6summarises the original and current ASR-deteriorated mechanical properties for viaduct deck slab S7.
BRIDGE TRAFFIC LOADING ON THE VIADUCT
Bridge design guidelines and standards CPA (1977) and TMH7 (1981) have been used in South Africa, with the latter being the current standard. More recently, traffic load models have been proposed based on weigh-in-motion (WIM) data collected from various WIM stations across South African road networks (Lenner et al 2017; Van der Spuy 2020). WIM data has been recorded on South African roads for more than a decade, guided by Committee of Transport Officials South Africa (COTO) guidelines and standards (TMH14 2013; TMH8 2014; TMH3 2016). WIM-based traffic load models indicate significantly increased bridge loads compared with CPA (1977) and TMH7 (1981).
The investigation of structural integrity of the Sir Lowry's Pass Viaduct considered resistance models and traffic load models used at the time of design, as well as current approaches. The authors acknowledge that remaining structural service life and cost considerations complicate design considerations for existing infrastructure, which, together with human safety, are significant factors in the determination of reliability indices and calibration of partial factors for structural design (Steenbergen et al 2015; Way et al 2022).
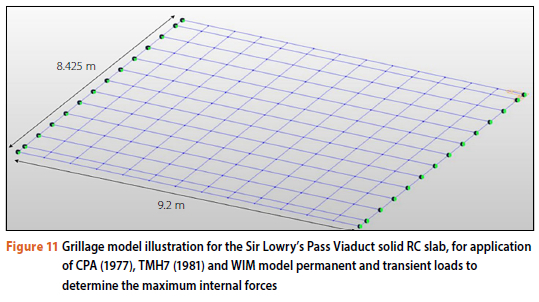
Maximum bending moments and shear forces in a representative rectangular, simply supported, 9.2 m span RC slab of the viaduct were determined with commercial grillage software MIDAS Civil (2022) according to the CPA (1977), the TMH7 (1981) and WIM traffic load, as proposed by Van der Spuy (2020). The worst affected viaduct deck slab S7 has a triangular shape accommodating the intersection with a rail underpass, complicating the illustration. A neighbouring rectangular solid RC slab S4 was considered instead, with a simply supported span of 9.2 m, thickness of 0.650 m, and width of 8.425 m to accommodate a shoulder and two traffic lanes for vehicles travelling in the north-westerly direction towards Cape Town.
CPA and TMH7 traffic loads
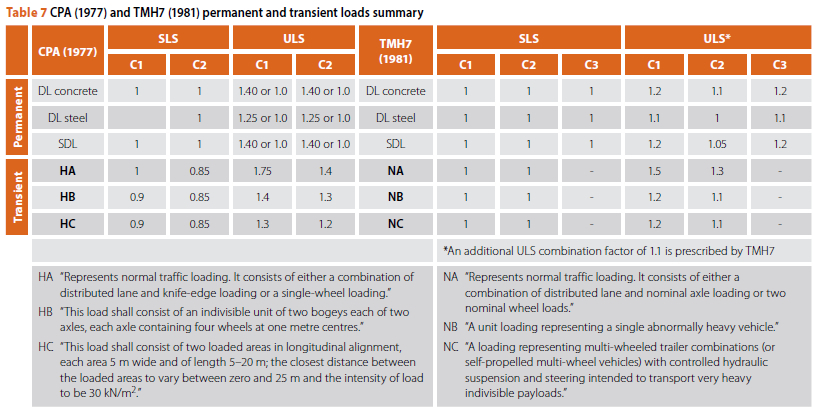
Standard procedures were followed to determine maximum traffic loads on the considered deck slab. The summarised dead, superimposed dead and transient loads and load factors for CPA (1977) and TMH7 (1981) in Table 7were applied systematically in a MIDAS grillage model of the deck slab shown in Figure 11 From the table similarities in vehicle categories are apparent, and differences in partial factors for both permanent and transient vehicle loads. The standards have the same categories of notional lanes based on the carriageway width. The 8.425 m wide viaduct slab under consideration falls in the width range of 7.4 - 11.1 m for which three notional lanes must be considered.
Weigh-in-motion traffic loads
Data from the Kinkelbos east-bound WIM station, located between Grahamstown and Port Elizabeth in the Eastern Cape, was used to set up the vehicle load models for the transient load cases. The WIM site, number 3106, is located on the N2 in the Eastern Cape, essential for transporting goods and services between the Eastern and Western Cape, passing over the Sir Lowry's Pass Viaduct. The Kinkelbos WIM station is permanent and has been in operation since the end of 2015. It consists of two lanes running in both travel directions and has a speed limit of 120 km/h.
A notional lane width of 3 m proposed by Van der Spuy (2020) was adopted for the WIM approach. Three lanes were therefore used for the viaduct, with a slow outer lane load assumed to predominantly carry the heavy vehicle loads. The WIM-based traffic load model suggests simplification in transient load modelling by using a unified traffic load model for normal and abnormal vehicles, although this is the focus of continued research (Van Rooyen 2023; Van der Spuy et al 2019). Lane factors are applied (Van der Spuy 2019), acknowledging the heavy vehicles in the outer lane with unit factor (1.0), and lower factors in the other.
Two load categories were considered, namely working and characteristic loads. Working loads were measured from the WIM station and represented the load induced by the actual traffic. This was done by sorting the data represented by every vehicle measured at the WIM station and creates a convoy based on the speed and distance between the vehicles. This was subsequently passed over various spans of bridges to obtain the maximum daily values for sagging and hogging bending moments, and shear force, obtained by statistical extrapolation to characteristic values. For this study, the simply supported bridge deck with span length of 9.2 m was specified, and the daily maxima were determined for this data set by statistical extrapolation.
For characteristic loads the dataset used for working loads was extrapolated to a return period of 975 years with extreme value theory. This theorem states that if a function is continuous on a closed interval, then the function must have a maximum and a minimum on the interval. The Weibull distribution was used for the extrapolation by fitting the distribution to the extreme tail of the available data.
Figures 12 and 13 illustrate the applied vehicle loads for the working and characteristic loads respectively, showing combinations of point loads representing heavy vehicle axle loads and uniformly distributed load (UDL), as proposed by Van der Spuy (2020).
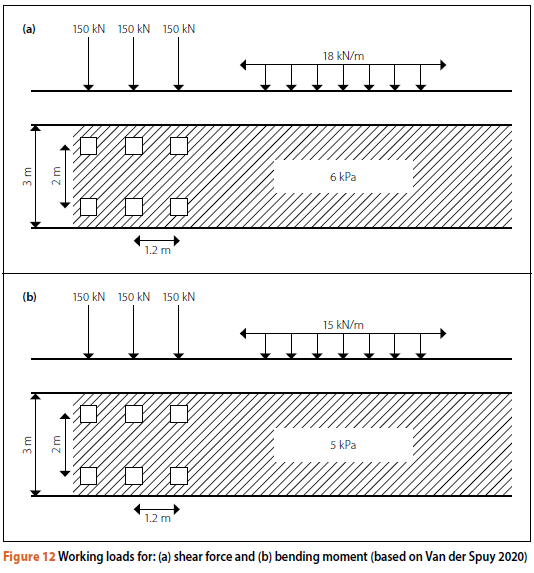
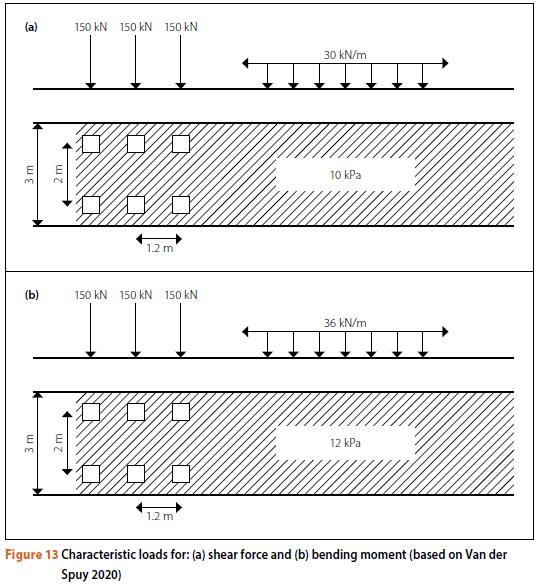
It should be noted that these models differ from the TMH7 industry standard where the axle loads are lower at 10 kN/ axle and the UDL is higher at 30 kPa. The reason for this is that load models comprise a balance between the axle loads and UDL. The 150 kN used in the proposed models were calibrated by Van der Spuy (2020).
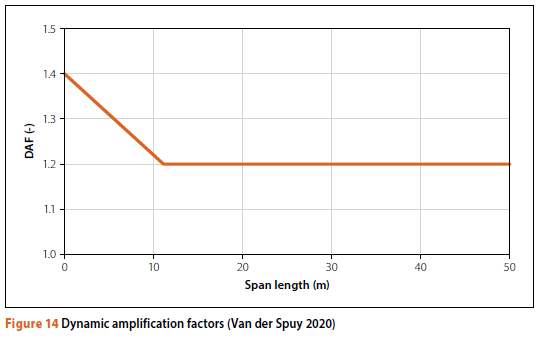
Wheel impact and bridge dynamic response amplify vehicle loads. To simplify engineering design, the dynamic vehicle force from the WIM is calibrated to an equivalent static load. The DAFs depend on span length, the traffic convoy characteristics including speed and vehicle type, as well as typical pavement roughness and settlement of the bridge approach. From the simple span-length-dependent DAF relation proposed by Van der Spuy and Lenner (2019), a DAF of roughly 1.3 (taken from Figure 14 applies to the short 9.2 m viaduct deck span considered here. The DAF concept is included in the CPA (1977) and TMH7 (1981) traffic load models.
Finally, lane factors of 1.0, 0.68 and 0 were assigned to traffic loads in the three notional lanes of the viaduct slab to account for the reduced probability of extreme vehicles simultaneously in all lanes, based on Van der Spuy (2020) for determination of the maximum sagging bending moment, from the outermost slow lane, inwards. For determination of the maximum shear force, lane factors of 1.0, 0.62 and 0.16 were applied. These lane factors emanate from multiple lane measurement of traffic loads in South Africa.
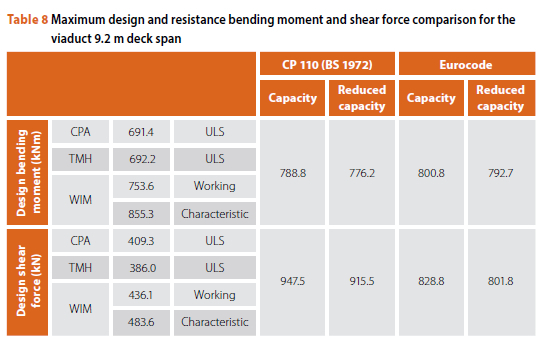
From multiple permutations of the loads described in Table 7 and the WIM load traffic model, the final maximum sagging bending moments and shear forces obtained from applying the CPA (1977), TMH7 (1981) and WIM models to the 9.2 m viaduct deck are summarised in Table 8 The WIM working and characteristic bending moments exceed the maximum of CPA and TMH7 ULS value by 9% and 25% respectively, while the WIM shear forces are 7% and 18% higher.
Bending moment and shear force resistance
Table 8also presents the design and ASR-deteriorated bending moment and shear force resistances of the investigated viaduct deck slab. These values were calculated from the design and ASR-reduced compressive strengths in Table 6 reinforcing steel characteristic yield strength of 410 MPa at the time (BS 1972; CPA 1977) and as-built steel reinforcement detail for the viaduct deck slab. The ultimate resistances in the table represent the regions of maximum reinforcement, which coincide with the positions of maximum bending moments and shear force obtained from the MIDAS analysis in the previous sections. In the position of maximum bending moment, which is in the slow outermost lane, the total compressive and tensile steel cross section area is 1 884 mm2 and 4 899 mm2 respectively, comprising 12 mm, 16 mm and 32 mm diameter bars. The specified cover depth was 60 mm. Vertically placed, high-tensile strength stirrups of 16 mm diameter encaged the longitudinal steel and presented shear reinforcement of highest concentration in the heavily loaded slow lane. For current relevance, the resistances were also calculated according to Eurocode (EN 1992-1-1) (EN 2004). Both CP 110 (BS 1972) and Eurocode use RC flexural models based on the compressive block concept, and minor differences lead to the differences in bending moment resistance calculated from the two design standards in Table 8 A more significant difference was found for maximum shear resistance, with lower resistance calculated from Eurocode roughly 88% of the CP 110 shear resistance.
From Table 8it is apparent that the ASR-reduced bending moment and shear capacity meet the CPA, TMH7 and WIM working load internal bending moment and shear force demand. However, the bending moment resistance of the original and the ASR-affected viaduct deck slab are lower than the characteristic internal bending moment demand from the WIM model reflecting current traffic loads, which raises concern.
It should be noted that full resistance of the reinforcing steel is considered in the calculation of the resistances in Table 8 despite the coastal proximity and known ASR-induced cracking in the RC deck. The emphasis here has been on ultimate resistance, for which the standardised flexural and shear resistance models consider the compressive strength but ignore concrete tensile strength. From literature, and in Table 6 it is clear that tensile strength is worst affected by ASR. E-modulus is also significantly affected, warranting scrutiny of deck short-term and long-term deflection, and likely significantly altered dynamic response.
CONCLUSIONS
Several bridge structures in the Western Cape are affected by ASR. This paper studied an affected reinforced concrete viaduct on the N2 highway, given access to as-built drawings and field inspection reports for the last two decades. The relevant original and current design standards were used, together with a recently proposed traffic load model for South African bridge design based on weigh-in-motion data. The following conclusions are drawn:
■ The strength and stiffness of ASR-affected reinforced concrete bridges are reduced. The tensile strength and elastic modulus are reduced more than compressive strength. Structural analysis is required to determine whether sufficient structural resistance to loads acting on the structure is retained.
■ In addition to the constructed geometry and reinforcement, several material parameters are required for structural analysis. Given the long-term process of ASR deterioration, cost and restricted accessibility of bridge infrastructure carrying high traffic volumes, empirical models for condition assessment are invaluable. Empirical correlation between ASR-induced crack width and ASR swelling enable estimation of ASR extent. Ranges in reduction factors of ASR-affected concrete strength and stiffness enable first estimates of structural resistance, and planning of condition assessment and strengthening interventions.
■ Field inspection reports containing recorded measurements of crack widths of ASR-affected concrete bridges provide the link for estimating ASR swelling and reduction in concrete strength and stiffness. For the Sir Lowry's Pass bridge deck investigated, ASR-induced reductions of 62.5%, 52% and 25% are estimated for tensile strength, elastic modulus and compressive strength, respectively, from reported crack width evolutions and empirical correlation.
■ The ASR-reduced compressive strength in the RC viaduct deck slab considered here results in reduced bending moment and shear resistance, but the internal force demand as per the original design standard is met. However, the internal bending resistance is found to be lower than the bending moment in the viaduct based on weigh-in-motion data collected from a station on the relevant highway (N2), according to recent research culminating in a proposed WIM traffic load model for South African bridges.
It is emphasised that empirical approaches have been followed as first estimate of the condition of the viaduct studied here. Condition assessment to determine the actual condition from appropriate testing programme is recommended.
ACKNOWLEDGEMENTS
The first author was sponsored by SANRAL to conduct the MEng research reported in this contribution. Local consulting bridge engineers Tiago Massingue, Philip Ronne and Stephen Agar are gratefully acknowledged for their contributions ranging from providing construction drawings, inspection report data and reports, ASR affected bridge repair insights, and accompanied site visits.
REFERENCES
Alaud, S M, Van Zijl, G P A G 2017. Combined action of mechanical pre-cracks and ASR strain in concrete. Journal of Advanced Concrete Technology, 15(4): 151-164. [ Links ]
Blight, G E & Alexander, M G 2011. Alkali-Aggregate Reaction and Structural Damage to Concrete, Engineering Assessment, Repair and Management. Leiden, Netherlands: CRC Press. [ Links ]
BS (British Standard) 1972. BS CP 110 1972. Code of Practice for Structural Use of Concrete. London: British Standards Institution. [ Links ]
CPA (Cape Provincial Administration) 1977. Code of Procedure for the Design of Provincial Bridges and Culverts. Cape Town: CPA, Department of Roads. [ Links ]
EN (European Standard) 2004. EN 1992-1-1 2004. Eurocode 2: Design of Concrete Structures. Part 1-1: General Rules and Rules for Buildings. Brussels: European Committee for Standardization (CEN). [ Links ]
Fulton 2021. Alexander, M G (Ed) Fulton's Concrete Technology, 10th ed. Midrand, South Africa: Cement and Concrete South Africa. [ Links ]
IStructE (Institution of Structural Engineers) 1992. Structural effects of alkali-silica reaction: Interim technical guidance on the appraisal of existing structures. London: The Institution of Structural Engineers. [ Links ]
Jones, T N & Poole, A B 1986. Alkali-silica reaction in several U.K. concretes: The effects of temperature and humidity on expansion, and the significance of ettringite development. Proceedings, 7th International Conference on Concrete Alkali-Aggregate reactions, Ottawa, Canada. [ Links ]
Kongshaug, S S, Larssen, R M, Hendriks, M A N, Kanstad, T & Markeset, G 2022. Load effects in reinforced concrete beam bridges affected by alkali-silica reaction: Constitutive modelling including expansion, cracking, creep and crushing. Engineering Structures, 245: 112945. doi:10.1016/j. engstruct.2021.112945 [ Links ]
Lenner, R, De Wet, D P G & Viljoen, C 2017. Bridge loading and traffic characteristics in South Africa. Journal of the South African Institution of Civil Engineering, 59(4): 34-46. doi:10.17159/2309-8775/2017/v59n4a4 [ Links ]
Mbanjwa, T 2014. An investigation of the relationships between inventory and inspection data of RC Bridges and RC culverts in the Western Cape Province. MSc Dissertation. University of Cape Town. [ Links ]
MIDAS Civil 2022. MIDAS Civil 2022 Version 1.1 computer software. Retrieved from: https://www.midasoft.com/bridge-library/civil/products/midascivil. [ Links ]
Nordengen, P A & De Fleuriot, E 1998. The development and implementation of a bridge management system for South African road and rail authorities. Pretoria: National Roads Agency of South Africa, Department of Transport. [ Links ]
Oberholster, R E 2001. Project H1450 31: Final report on the examination of concrete cores from bridges on the N2, Cape Town, for the presence of alkali-silica reaction. Submitted to BKS (Pty) Ltd Engineering and Management, October. [ Links ]
Oberholster, R E 2009. Alkali-silica reaction. Chapter 10. In Owens, G (Ed). Fulton's Concrete Technology, 9th ed. Midrand, South Africa: Cement and Concrete Institute, 189-218. [ Links ]
Oberholster, R E & Brandt, M P 1976. Report on reactive concrete aggregate from the Cape Peninsula, South Africa. Proceedings, Symposium held in London, September 1976. [ Links ]
Pourbehi, M S, Van Zijl, G P A G & Strasheim, J A B 2019. Analysis of combined seismic loads and alkali-silica reaction in concrete dams considering key chemical-physical-mechanical factors and fluid-structure interaction. Engineering Structures, 195: 263-273. doi:10.1016/j.engstruct.2019.05.087 [ Links ]
Putterill, K E & Oberholster, R E 1985. Investigation of different variables that influence the expansion of concrete caused by alkali-aggregate reaction under natural environmental conditions. CSIR Research Report BRR 626. Pretoria: Council for Scientific and Industrial Research. [ Links ]
Sanchez, L F M, Fournier, B, Jolin, M, Mitchell, D & Bastien, J 2017. Overall assessment of Alkali-Aggregate Reaction (AAR) in concretes presenting different strengths and incorporating a wide range of reactive aggregate types and natures. Cement and Concrete Research, 93: 17-31. doi:10.1016/j.cemconres.2016.12.001 [ Links ]
SANS (South African National Standard) 2015. SANS 50206:2015 Concrete: Specification, Performance, Production and Conformity. Pretoria: SABS Standards Division. [ Links ]
Saouma, V E, Martin, R A, Hariri-Ardebili, M A & Katayama, T 2015. A mathematical model for the kinetics of the alkali-silica chemical reaction. Cement and Concrete Research, 68: 184-195. doi:10.1016/j.cemconres.2014.10.021 [ Links ]
Steenbergen, R D J M, Sykora, M, Diamantidis, D, Holicky, M & Vrouwenvelder, T 2015. Economic and human safety reliability levels for existing structures. Structural Concrete, 3: 323-332. doi:10.1002/suco.201500022 [ Links ]
TMH7 1981 Parts 1 and 2. Code of Practice for the Design of Highway Bridges and Culverts in South Africa. Pretoria: Department of Transport. [ Links ]
TMH14 2013. South African Standard Automatic Traffic Data Collection Format. Pretoria: SANRAL. [ Links ]
TMH22 2013. Road Asset Management Manual. Pretoria: SANRAL. [ Links ]
TMH8 2014. Traffic and Axle Load Monitoring Procedures. Pretoria: SANRAL. [ Links ]
TMH3 2016. Specifications for the Provision of Traffic and Weigh-in-Motion Monitoring Services. Pretoria: SANRAL. [ Links ]
TMH19 2018. Manual for the Visual Assessment of Road Structures. Part A: Road Structure Management Information. Pretoria: SANRAL. [ Links ]
Ulm, F, Kousy, O, Kefei, A & Larive, C 2000. Thermo-Chemo-Mechanics of ASR expansion in concrete structures. Journal of Engineering Mechanics, 126: 233-242. doi: 10.1061/(ASCE)0733-9399(2000)126:3(233) [ Links ]
Van der Spuy, P F 2020. Derivation of a traffic load model for the structural design of highway bridges in South Africa. PhD Thesis. Stellenbosch University. [ Links ]
Van der Spuy, P F & Lenner, R 2019. Towards a new bridge load model for South Africa. Structural Engineering International, 29(2): 292-298. doi:10.10 80/10168664.2018.1561168 [ Links ]
Van der Spuy, P F, Lenner, R, De Wet, T & Caprani, C 2019. Multiple lane reduction factors based on multiple lane weigh in motion data. Structures, 20: 543-549. doi:10.1016/j.istruc.2019.06.001 [ Links ]
Van Rooyen, J 2023. A regional characterisation and calibration of load effects for normal and abnormal vehicles for the structural design of highway bridges in South Africa. MEng Dissertation, Stellenbosch University. [ Links ]
Way, A C, De Koker, N &Viljoen, C 2022. Target reliability for new road bridges in South Africa. Journal of the South African Institution of Civil Engineering, 64(3): 10-19. doi:10.17159/2309-8775/2022/v64n3a2 [ Links ]
 Correspondence:
H Kirchner
Department of Civil Engineering SANRAL, Stellenbosch University
20 Shorewood Drive, Private Bag X1 Bay West, Matieland 7602 Port Elizabeth South Africa. South Africa
E: kirchnerh@nra.co.za
J van Rooyen
Department of Civil Engineering Zutari, Stellenbosch University 1 Century City Drive
Private Bag X1 Century City, Matieland 7602 Cape Town 7441, South Africa. South Africa
E: jacquesVR@zutari.com
P F van der Spuy
Department of Civil Engineering Zutari, Stellenbosch University
1 Century City Drive, Private Bag X1 Century City, Matieland 7602 Cape Town 7441, South Africa. South Africa
E: pierrevds@sun.ac.za E: pierre.vanderspuy@zutari.com
G P A G van Zijl
Department of Civil Engineering, Stellenbosch University
Private Bag X1, Matieland 7602, South Africa
E: gvanzij l@sun.ac.za

HUGO KIRCHNER (MEng, AMSAICE) is a Candidate Engineer at SANRAL (South African National Roads Agency Limited) based in the Southern Region. He is currently working as an Assistant Resident Engineer on the N2 Green River upgrades in Qonce (formerly King Williams Town) in the Eastern Cape. He graduated with a Bachelor and a Master's in Civil Engineering from Stellenbosch University in 2020 and 2022 respectively.

JACQUES VAN ROOYEN is a structural engineer at Zutari in Century City, Cape Town, and has been working in the bridges team for the last year. He completed both his undergraduate (BEng) and postgraduate (MEng) studies at Stellenbosch University. His research focused on probabilistic traffic loading on highway bridges and the structural reliability thereof.

DR PIERRE VAN DER SPUY (PrEng, FSAICE) is an Associate Design Director with Zutari and an Adjunct Associate Professor in Structural Engineering at Stellenbosch University. He specialises in the design of bridges and civil structures.

PROF GIDEON VAN ZIJL (PrEng, DEng, FSAAE, FSAICE) is Distinguished Professor of Structural Engineering at Stellenbosch University (SU). After graduating as Bachelor and Master in Civil Engineering at SU, and PhD in Civil Engineering at Delft University of Technology, The Netherlands, he joined SU in 2001 as Professor of Structural Engineering. He established the Centre for Development of Sustainable Infrastructure (CDSI) in 2002, with research interests in structural, computational and durability mechanics.

