


Servicios Personalizados
Articulo
 Inglés (pdf)
 Articulo en XML
 Referencias del artículo
Indicadores

Links relacionados
-
 Citado por Google
 -
 Similares en Google
Compartir

 Permalink
Journal of the South African Institution of Civil Engineering
versión On-line ISSN 2309-8775
versión impresa ISSN 1021-2019
J. S. Afr. Inst. Civ. Eng. vol.65 no.3 Midrand sep. 2023
http://dx.doi.org/10.17159/2309-8775/2023/v65n3a4
TECHNICAL PAPER
http://dx.doi.org/10.17159/2309-8775/2023/v65n3a4
Thermal performance of cavities in 3DPC building façades
M Moelich; G van Zijl; W de Villiers
ABSTRACT
In the quest for sufficient and comfortable housing in South Africa, attention to building orientation and thermal transmittance principles has significantly improved thermal performance in local houses. Thermal simulation and monitoring of houses in the Joe Slovo Phase Three development in Cape Town confirms improved performance by solar radiation blockage and shading. This paper simulates the thermal performance of a housing unit in this development. The house was instrumented with thermocouples, and monitored from March to December 2013 by Sustainable Energy Africa in collaboration with the National Department of Human Settlements. Sustainable Energy Africa reported significant improvement when compared to a nearby traditional Reconstruction and Development Programme house that had been monitored during the same period. With the benefit of the monitored thermal data, complete drawings, and specification details of the Joe Slovo Phase Three unit, the current research modelled and calibrated a simulation model in DesignBuilder. DesignBuilder was selected given its accreditation status for Green Star Rating of buildings in South Africa. An additional motivation for investigating this unit was the availability of recorded weather data from the nearby Cape Town International Airport, captured in the DesignBuilder climate data base for 2013, which was assumed relevant in lieu of complete weather station data measured at the location of the housing unit. The study aimed to simulate the monitored temperatures in the house with acceptable agreement, and to investigate further potential improvement in occupant thermal comfort by alternative 3D-printed concrete walling developed by the authors. Systematic finite element analysis (FEA) iteratively solved cavity radiation and convection in wall cavities to calibrate thermal transmittance parameters for DesignBuilder. The FEA results acceptably simulated temperatures monitored in this physical wall experiment. The calibrated DesignBuilder model simulated the indoor temperatures of the monitored house with acceptable agreement, and predicted significant improvement in occupant thermal comfort if the walls were 3D-printed with a particular cross-sectional design.
Keywords: 3D-printed concrete, housing, thermal simulation, thermal monitoring
INTRODUCTION
According to the Bill of Rights in the Constitution of the Republic of South Africa (RSA 1996), "Everyone has the right to have access to adequate housing". To this end the government introduced the Reconstruction and Development Programme (RDP). With an increase in population, housing is becoming a significant problem. The total number of households increased from 9 million in 1996 to 16.9 million in 2016, of which 79.2% lived in formal dwellings, 7% in traditional dwellings and 14% in informal dwellings, as classified by Statistics South Africa (2016). It is clear that there is a housing shortage in the country. However, developing low-density buildings that are inexpensive to build and uncomfortable to live in, is not sustainable.
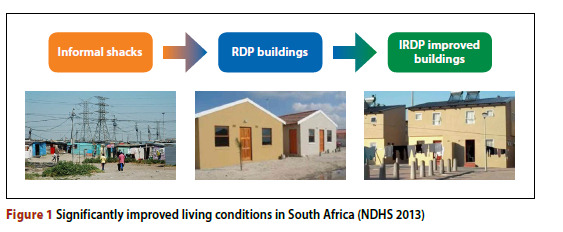
The National Department of Human Settlements (NDHS) in South Africa launched a new approach for the sustainable delivery of housing under the Integrated Reconstruction and Development Programme (IRDP) initiative. The third phase of the Joe Slovo project was the flagship of this initiative for more sustainable housing, with 2 886 subsidised homes on 27 hectares (NDHS 2013). Despite the improvement in living conditions, illustrated in Figure 1 the project also focused on sustainable energy interventions, such as solar water heaters and energy-efficient lighting. The most significant change, however, was the optimised thermal design, which included:
■ A double-storey design that improves population density and allows for dual living spaces, with the upstairs space being slightly warmer than the downstairs.
■ Roof overhangs that provide partial shade on windows during summer while allowing solar gain during winter.
■ Inside living spaces that are oriented to be north-facing as per the SANS 10400-XA:2021 recommendations (SANS 2021). This orientation allows other rooms to screen the unwanted western sun and prevent heat loss on the south-facing façades.
■ Ceiling insulation and external façade plaster and paint to improve the thermal comfort for occupants by reducing the global thermal transmittance of the building.
The NDHS (2013) confirmed improved indoor thermal conditions by instrumenting and monitoring a Joe Slovo house and an older RDP house in close vicinity for the periods March to December 2013, and March to October 2013 respectively. The research leading to this paper aimed at developing a computational modelling strategy for the prediction of indoor thermal conditions in local houses, towards proposing further potential improvements. The objectives of the study were: (i) to model thermal conduction, radiation and convection to reasonable accuracy, including those in wall cavities typical of these structures, (ii) to compute equivalent thermal transmittance coefficients for cavity wall systems, required (iii) for use in a commercial building thermal simulation package (DesignBuilder 2022) that enables realistic modelling of a complete house, its surroundings relevant to its thermal performance, as well as weather conditions over the period of study, and (iv) to quantify the occupant thermal comfort of the Joe Slovo house and further potential improvement should 3D-printed concrete walls replace the actual cavity walls of this house.
BACKGROUND
Thermal comfort for occupants
Thermal comfort is a duration value of the period of time that occupants feel comfortable indoors, based on humidity and temperature. It was used in this research to quantify the possible improvement in comfort for occupants of the proposed 3DPC (three-dimensional printed concrete) housing. Thermal comfort in buildings is challenging to define since it depends on the occupant's perception of comfort. While temperatures in the range 18°C to 24°C are generally considered appropriate for health and thermal comfort (Ormandy & Ezratty 2012), adaptive thermal models have been proposed by De Dear and Brager (1998) and standardised in ASHRAE Standard 55 (2020) and BS EN 16798-1:2019 (BS 2019).
ASHRAE Standard 55 (ASHRAE 2020) - on the Thermal Environmental Conditions for Human Occupancy - concludes that thermal comfort for occupants in an environment depends on six factors, namely metabolic rate, clothing insulation, air temperature, radiant temperature, air speed, and humidity. The metabolic rate of occupants is their effective sensible heat loss to the environment. On average, this is 75 W per person according to ASHRAE Standard 55 and can range from 235 W for intense physical exercise to 40 W during sleep. Clothing worn by occupants can act as insulation. Walking shorts with a short-sleeved shirt have a factor of 0.36 insulation, while trousers with a T-shirt and long-sleeved sweater have a factor of 1.01 (ASHRAE 2020). These first two factors are characteristics of the occupant and can be self-adjusted. The remaining four factors are conditions of the thermal environment and are generally dependent on the building envelope.
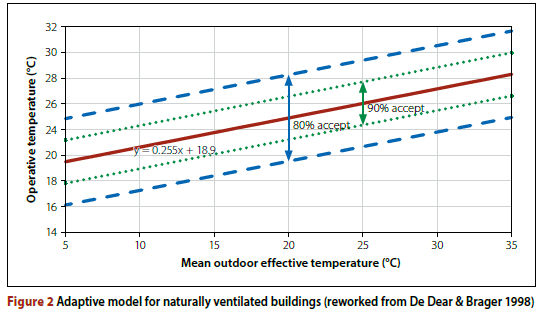
De Dear and Brager (1998) developed an adaptive thermal comfort model. The primary assumption was that people in warm climate zones would prefer warmer indoor temperatures than people in cold climates, i.e. a reduced difference between indoor and outdoor temperatures. For naturally ventilated buildings, an environment is seen as comfortable when the operative temperature is within either the 80% or 90% acceptability range of a linear regression predicted ideal operative temperature, as per Figure 2
In South Africa, there is a lack of guidance as to designing for occupant comfort. The South African Bureau of Standards set out SANS 204:2011 for energy efficiency in buildings (SANS 2011) and SANS 10400-XA:2021 for energy usage in buildings (SANS 2021). These regulations make design recommendations for the building orientation, thermal performance of floors, walls, windows and roof elements, building sealing and air infiltration, and building services and air conditioning systems. The building should ideally be orientated with the most used living spaces facing north. For the coastal region from Cape Town to Gqeberha (previously Port Elizabeth), the minimum thermal resistance of 1.9 m2K/W and a thermal capacity and resistance product of 80 hours are proposed for façades with a surface density of less than 270 kg/m2, such as the material used in this research. Modelling conditions such as ambient temperatures ranging from 19°C to 25°C, average sensible heat gain per person of 75 W, and occupant behaviour are also proposed.
Thermal energy transfer
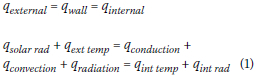
The principle of energy conservation is used in finite element analysis (FEA) to model the heat transfer through a wall with cavities. Thermal energy in the form of ambient temperature and solar radiation is applied to the external face of the wall. The energy is absorbed by the wall dependent on the surface area, surface roughness, solar emis-sivity and thermal conduction. Through the three heat transfer mechanisms (conduction, convection and radiation), the energy is then transferred to the inner face and internal environment. The principle of energy balance should hold throughout this process without any energy loss in a controlled environment, as per Equation 1, where q is the heat flux through a unit area (Bergman et al 2011).
A 2D approach is taken to simplify the problem. The section is homogenous in height and the only variable to be accounted for is the convection inside the cavities. Due to the height of the walls, natural convection will occur with warmer and less dense air moving up in the cavity, and colder, more dense air moving down, accounted for by calculations of the con-vective heat transfer coefficient.
Conduction interaction
The conduction interaction can be derived as thermal energy flowing through a solid, or through stationary fluid. Fourier's law describes the thermal energy flowing through the solid parts of the section as expressed in Equation 2 (Bergman et al 2011), where the product of thermal conductivity and temperature difference between two connected nodes in the section is calculated.
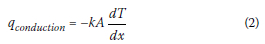
Where: q is the heat flux (W), A is the surface area that is exposed to the heat flux (m2), and  is the negative temperature gradient due to thermal energy dissipation through the solid (K/m).
Convection interaction
The convection interaction of moving fluid in contact with a surface or in cavities can be represented by Equation 3 (Bergman et al 2011):
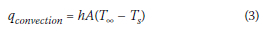
Where: h is the convection heat transfer coefficient (W/m2K) and (Too - Ts) refers to the difference between surface and fluid temperatures, respectively (K). The convection heat transfer coefficient is the only unknown and depends on the conditions in the boundary layer, influenced by surface geometry, the nature of fluid motion, and fluid thermodynamic and transport properties.
For calculation of the convection heat transfer coefficient, two conditions exist -either forced convection where air is driven by external factors (such as an HVAC system, frontal wind, and convective macro environmental wind), or natural convection where air is driven by temperature differences. On the external surface of the façade air is driven by the wind and forced convection is used. In the façade internal cavities, no external driving factors are present and natural convection is used. On the internal face where no external driving factors or cavities are present, a maximum heat transfer coefficient of 25 W/m2K is applied according to Bergman et al (2011). The coefficient can be solved from the Nusselt (Nu) number according to Table 1 dependent on either the Reynolds number (Re), or the Grashof (Gr) and Prandlt (Pr) numbers. These can be calculated from Equations 4 to 7:
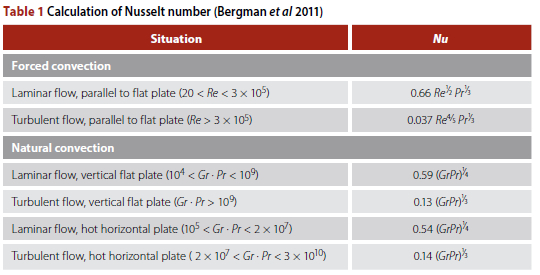

Where: l is the height of the wall (m), uM is the average wind velocity on the external face of the façade (m/s), fi is the inverse of air temperature (K), AT is the difference in air and surface temperatures (K), and k, v, a, p and f are the thermophysical properties of air at atmospheric pressure and 300K.
Radiation interaction
The radiation interaction is presented by Equation 8 (Bergman et al 2011):
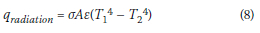
Where: a is the Stefan-Boltzmann constant of 5.67 X 10⁻⁸ W/m2K4, e is the emissivity of the surface from which the radiation is emitted, and T1 and T2 are the surface or environment temperatures (K).
Steady state
When a system is in steady state, the conservation-of-energy principle is satisfied where the energy into a system is equal to the energy out of the system and no energy is created or lost. Equation 1 must therefore be satisfied, but with the time-dependent specific heat term included. Without, the problem has no intrinsic meaningful timescale. This is why a transient analysis is used with the backward Euler method which is unconditionally stable for linear problems to determine when steady state is reached (Dassault Systemes Simulia 2020). In this transient analysis, external temperature and solar flux are applied at specific time intervals, but since the heat flux in the cavities is unknown, an iterative approach is required.
Determining thermal transmittance
The thermal transmittance was calculated by computationally simulating the Hot Box procedure according to ASTM C1363:2014 (ASTM 2014). This value effectively quantifies the amount of thermal energy that is transferred through the section. It is calculated from Equation 9:
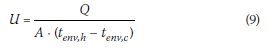
Where: U is the thermal transmittance of the section (W/m2K), Q is the average time rate of heat flow (W), A is the area on which the external temperature and solar flux is applied (m2), and tenv h and tenv c are the ambient temperatures on the hot and cold surfaces, respectively. The thermal resistance (R) is the reciprocal value of thermal transmittance.
Joe Slovo Phase Three
Block 6 on the northernmost land was selected for analysis in this research. The building was constructed to comply with the regulations of the National Home Builders Registration Council (NHBRC) of South Africa. It consists of six double-storey 50 m2 apartments, each comprising a living area, kitchen and bathroom down-stairs, and two bedrooms upstairs.
Floors
The 75 mm thick ground-floor slab is constructed of 10 MPa cube strength concrete on 250-micron membrane and a 150 mm layer of compacted subsurface. The first-floor slab is a hollow core precast class 25 MPa concrete slab with a maximum stone size of 6 mm. The slab bears on the walls with a 90 mm overlap.
Roof
The roof is covered with Widedek Zincalume sheets with a Colourbond finish. All overhangs are at least 500 mm to provide additional shade. The 4 mm Nutec ceilings are at the minimum height of 2.4 m and insulated with 40 mm Isotherm mineral wool.
Windows and doors
All windows consist of 3 mm thick plane glass following SANS 10400-N:2012 (SANS 2012) with 10 mm Cliscoe-type steel window frames. The external doors are of 40 mm hardwood and the internal doors are of 40 mm masonite-faced hollow flush panels.
Walls
The external ground-floor loadbearing walls are compressive strength class 7 MPa, 140 mm wide hollow blocks, while the first-floor walls are class 3.5 MPa following SANS 10400-K:2015 (SANS 2015). The walls are plastered with a 12 mm mortar and painted with two coats of water-resistant acrylic paint externally. The internal partitions are 90 mm wide masonry blocks.
Thermal performance and monitored data
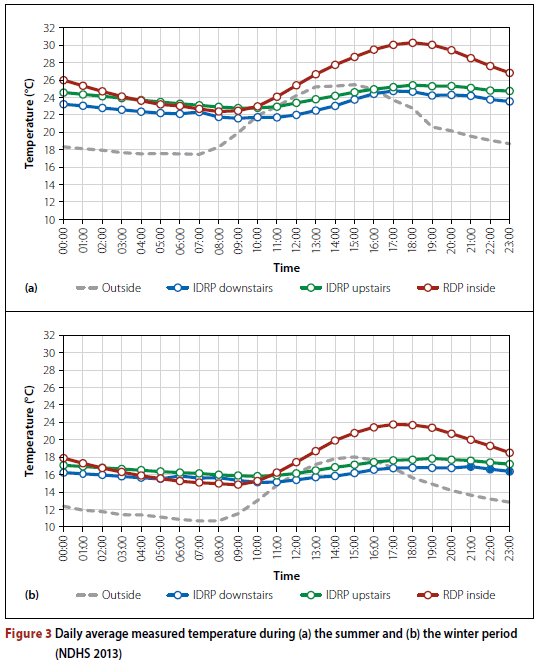
In December 2013 the Department of Human Settlements in South Africa, in collaboration with Sustainable Energy Africa, released a case study report on the lessons learnt from the project after the thermal performance was monitored to evaluate the improvement over traditional RDP buildings (NDHS 2013). From the study, it was clear that the thermal performance had significantly improved under the new IRDP initiative. The temperature peaks were reduced by between 4°C and 5°C for both summer and winter periods, as illustrated in Figure 3
3D-printed concrete
Typical RDP buildings are constructed using traditional masonry methods, which are unproductive in terms of labour and time. Three-dimensional (3D) printed concrete (3DPC) construction and the rapid shift to 3D building information modelling (BIM) mitigate these problems by the high-precision and versatile nature of construction from digital models that inherit all construction details. This can be seen as the fourth industrial revolution for construction (Kruger 2019).
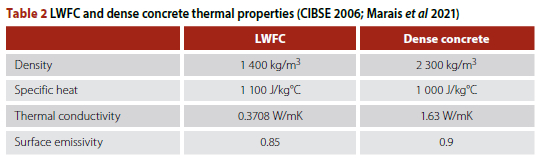
3DPC construction is generally performed by depositing printable concrete through a nozzle in a three-dimensional environment by moving on a gantry system. This enables a wide range of intricate wall cross-section geometries that can be constructed, each with a different thermal transmittance. Marais et al (2021) found that a façade geometry with cavities of 20 mm in width performs better thermally than a solid façade of the same lightweight foamed concrete (LWFC), due to the low conductivity relative to heat transferred by cavity convection and radiation. The difference in thermal properties of LWFC (Marais et al 2021) and typical dense concrete (CIBSE 2006) is illustrated in Table 2 This renders a façade section with a higher number of thin cavities to perform better than one with a few larger cavities. An overall void-to-façade footprint ratio of less than 50% is recommended.
FINITE ELEMENT ANALYSIS OF HEAT TRANSFER THROUGH CAVITY WALLS
This section covers the development of an appropriate finite element analysis (FEA) approach for heat transfer through cavity walls, appropriately incorporating conduction, as well as cavity radiation and convection. The simulation is validated against measured data from a physical experiment on a 3DPC wall containing large cavities. Subsequently, equivalent thermal transmittance values of cavity walls are determined computationally with the FEA approach. Commercial thermal simulation packages that enable simulation of complete buildings and relevant surroundings require transmittance values. DesignBuilder (2022) has predetermined transmittance values for typical wall types, most appropriately determined by physical testing. However, those of non-standard wall types, in this case 3DPC walls with intricate cross-sectional shapes containing non-standard cavities and arrangements, are not available.
Methodology
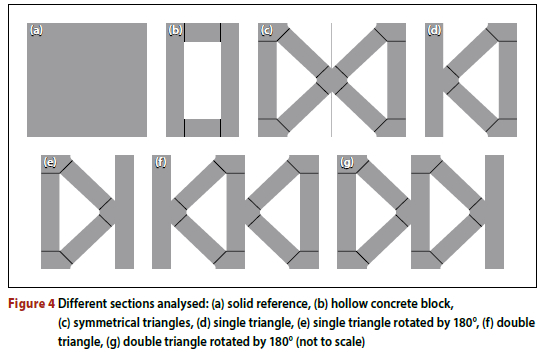
In this research, different wall geometries from literature and a reference solid section illustrated in Figure 4 were analysed, all manufactured from lightweight foam concrete (LWFC). For consistency, ±140 mm thick sections were used for all geometries, similar to the analysed hollow concrete blocks used for the Joe Slovo house.
Applied ambient temperature and solar heat flux
From the nearby Cape Town International Airport's measured meteonorm weather data, included in the DesignBuilder (2022) database, a three-day average ambient temperature and solar heat flux were calculated for 15-minute increments. This data could then be applied in a transient response analysis where environmental loads are applied at specific time increments. The ambient temperature was used as reference for convection and radiation (qconvection + qradiation) while the solar heat flux was applied as a surface heat flux (qsolar rad) on the external face.
Steady state
For the first iteration, the external temperature and solar flux were applied to a system that had a predefined temperature of 20°C, but the convection interaction could not be applied to the internal cavities since their temperatures were unknown. The radiation interaction was still applied to internal closed cavities because the temperature changes linearly through the cavity based on radiation viewfactors. The resultant surface temperature could then be used for input of the convection interaction of internal cavities in the second iteration. This procedure could be followed until the internal surface of the section reached steady state, occurring when there was no, or an acceptably small, change in temperature at the internal surface between successive iterations. A Python script was developed for this iterative process.
Results and discussion
An example of steady state reached after five iterations for configuration g during summer is given in Figure 5 It can be seen that the maximum internal temperatures of trial four and trial five are consistent when rounded to one decimal.
The thermal transmittance of each configuration wall cross-section, calculated with the FEA procedure described above, is summarised in Table 3 The configurations are as per Figure 4 for a summer period, winter period, and an average with different thicknesses and rotations. The thermal transmittance, thermal resistance, and time constant are indicated on three-point colour scales where green is the best, and red the worst, respectively.
Closer investigation was done on configuration g since it had the lowest thermal transmittance compared to all ±140 mm thick configurations. The temperature curves illustrated in Figure 6 can be compiled for locations throughout the section to clearly see the reduction in temperature from the outside to the inside surface.
From Table 3 it is clear that configuration g performed the best when comparing sections similar in thickness to the existing 140 mm hollow concrete blocks of the selected baseline building. The thermal transmittance of the existing building façades, configuration b, can be reduced by 71.5% from 5.6 to 1.57 W/m2 if replaced with configuration g. Comparing configuration d and e concludes that more cavities throughout the section and layering sections on each other reduce the thermal resistance.
From Figure 6 it is also clear that all cavities and surfaces of configuration g reach steady state after about three hours. From comparing the temperature difference between the exterior and cavities numbered 1 and 2 respectively in Figure 6 and the temperature difference between cavities 1 and 3, it is clear that there is a greater temperature reduction to cavity 3 than to cavity 2. The concrete filaments bounding the number 2 cavity conducts heat at 45° angles through the section. The diagonal concrete bridge affects cavity 3 less, and thus results in a greater temperature reduction. The large temperature reduction between the node 2 and 4 cavities proves that the layering of two sections is effective.
Validation
Experimental setup
Physical testing of configuration c (see Table 3 was done to validate the FEA in collaboration with colleague Heidi Christen at Stellenbosch University (Christen et al 2023). The test setup was designed with one surface of the façade exposed to solar radiation and external ambient temperature, while the other was completely insulated as per the cross-section illustrated in Figure 7(a). For the testing to be as accurate as possible, the insulated part should add as little heat gain as possible. A 40 mm polystyrene insulation was used all around to reduce additional heat gain or loss by conduction through these sides. Type T thermocouples (Energi Solutions @ Africa 2015) were placed in the cross-section, as seen in Figure 7b. These thermocouples had a measuring accuracy of 0.5°C when connected to a 34980A BenchLink Data Logger.


The FEA methodology described in the previous section was then followed to perform an analysis under similar circumstances using the measured solar radiation and external ambient temperature from the adjacent Sonbesie Weather Station (Meijers 2021). The temperatures of the same nodes were then compared using the Pearson correlation coefficient according to Equation 10:
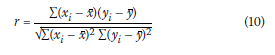
Where: r is the correlation coefficient, xt are the values of the test sample, x is the mean of the test sample, yi are the computed values of the FEA sample, and y is the mean of the FEA sample.
Results
The physical test data and results from the last 24 hours of FEA are presented in Figure 8 for comparison. Only nodes 8, 2, 12, 3 and 11 (refer to Figure 7(b)) are compared, since they represent a straight line of thermal energy transference through the cross-section. The same colour and line markers represent the same nodes. The solid lines with abbreviation T represent the data from physical testing, and dashed lines with abbreviation A represent the data from FEA. The calculated Pearson correlation coefficient for the last 24 hours is summarised in Table 4 The correlation is shown on a three-point colour scale where green is the best correlation and red the worst.
Discussion
A reasonable correlation was found between the physical test data and FEA, with average Pearson correlation coefficient of 0.83. From Figure 8 the temperatures for the tested and analysed data sets correlated well, with maximum and minimum peaks accounted for. The gradients, representing the change in temperature between time steps, were constant and of similar shape. From Table 4 it is clear that the temperatures on the external surface (nodes 8 and 9) correlate well with a correlation coefficient of 0.95. This is expected, since the ambient conditions were applied there. As the thermal energy was conducted to the internal surface, the correlation reduced to 0.79 at node 11, which is still acceptable.
DESIGNBUILDER SIMULATION OF THE JOE SLOVO HOUSE
Following from the FEA of integral façade parts, the resulting equivalent transmittance properties were incorporated in full building simulations to conclude on the thermal comfort levels in the Joe Slovo house, and for the case of replacing the cavity walls with 3DPC façades. State-of-the-art DesignBuilder software can be used to determine thermal comfort for occupants of buildings, approved by SANS 10400-XA in South Africa (DesignBuilder 2022; SANS 2021).
Methodology
Environment modelling
Site modelling involves modelling of the building layout, orientation and location, ground temperatures, weather conditions, and stipulating adjustment factors influencing the weather conditions. Since the meteonorm weather data supplied by DesignBuilder (2022) was measured, no weather adjustment factors had to be applied. The building and neighbouring buildings that could cast shadows or radiate heat, as seen in Figure 9 were also modelled.
Construction
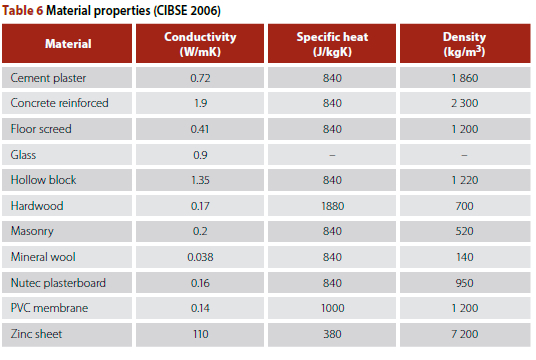
Specific details of the existing construction elements according to the construction drawings were reported and modelled according to CIBSE Guide A 2006 (CIBSE 2006) for the baseline building. This guide is useful, with a wide range of material properties to be used, and is also adopted by the DesignBuilder software for default parameter values. The elements were then constructed in layer formats according to Table 5 where layer 1 is the outermost layer. These layers were parallel to each other with different thicknesses perpendicular to the thermal energy transfer direction. In Table 6 the material properties are quantified to be used in the layered construction. The 3 mm thick glass, excluding the window steel frame, had a solar transmittance factor of 0.837, and all other material had a surface emissivity of 0.9 according to the CIBSE Guide A (CIBSE 2006). The steel frames of relatively high thermal conductivity were a concern for thermal bridging. Nevertheless, their equivalent transmittance was simulated in the model.
Natural ventilation from open windows and doors can be controlled in the software, but was not specified for this simulation. The opening of doors was assumed to follow occupancy, while windows were assumed to be closed at all times. Air could still filter into or out of the building through construction gaps and was assumed to be constant at 7 m3/hm2, similar to Meyer (2022).
3DPC walls
Since the geometry of the 3DPC walls cannot be layered parallel as easily, alternative methods were used to transform the configurations into a layered format, as required by DesignBuilder. The thermal transmittance values were calculated for these methods in DesignBuilder and compared with FEA, combining the sections in a useful tool.
Three-, five- and nine- layered alternatives were used, as presented in Figure 10
In each case the internal and external flanges of the section were kept constant at 20 mm thick, since these were already parallel to each other, while the thickness of triangular cavity parts was calculated by 3DPC-to-cavity cross-sectional area ratios. Since the unusual shape of the triangular cavity part would not transfer thermal energy linearly, the thickness of this part was iterated until the calculated thermal transmittance in DesignBuilder was equal to 1.57 W/m2K as calculated by the FEA. The three-layered alternative was represented by two parallel 3DPC external elements, but the centre parts were represented by only one air layer. Similarly, the five-layered alternative had an additional parallel 3DPC element in the centre. For the nine-layered alternative, however, the thickness of parts was calculated according to ratios. It had two triangular parts between parallel 3DPC elements with an area of 3 950 mm2, of which 21% was the first air cavity, 51% 3DPC, and 28% the second air cavity. Multiplying these ratios with the triangular cavity part thickness of 12 mm, calculated by iteration, resulted in the nine-layered alternative which was used for further analysis.
Simulation parameters
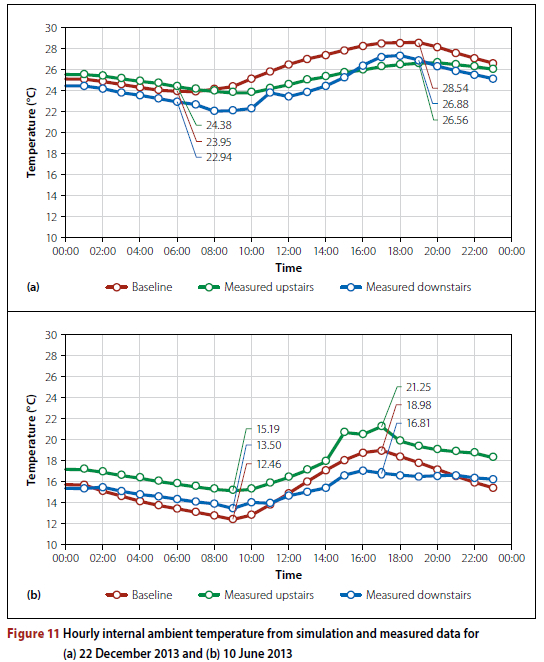
A wide range of outputs are generated by DesignBuilder, including surface and ambient temperatures, thermal heat gains for elements, internal heat gains and thermal comfort for occupants. All of these outputs can be useful, but for this research the focus was mainly on the thermal comfort for occupants. This can be calculated by ASHRAE Standard 55 Adaptive models discussed earlier. Based on the validation done below, well-correlated representative days for both a summer month, 22 December, and a winter month, 10 June, were chosen.
Validation
The results of the baseline simulation model were validated against the measured data from Sustainable Energy Africa (2014) for both the summer and winter periods in Figure 11 The Pearson correlation coefficient according to Equation 10 was calculated to be 0.88 and 0.79 for the summer period, and 0.93 and 0.96 for the winter period, for the downstairs and upstairs internal ambient temperature, respectively. The Pearson correlation coefficient of the outside surface temperature was 0.94 for both periods, showing good correlation of the façade's ability to absorb ambient heat. A further validation was done by checking that the thermal transmittance values, according to Equation 9, of all façades were equal to those calculated in the FEA.
Results and discussion
Temperature
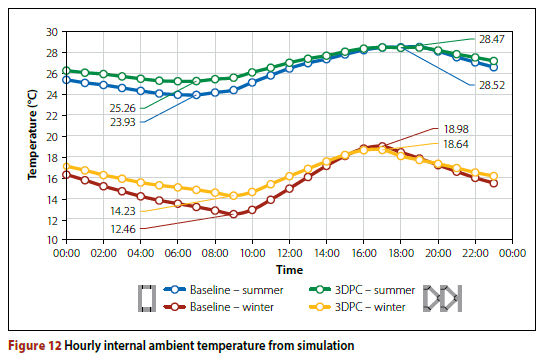
The computed internal ambient temperatures for the baseline building with hollow concrete blocks were compared to the building with 3DPC façades in Figure 12 for 22 December and 10 June 2013. These temperatures were averaged over all internal spaces. The thermal comfort for occupants is not dependent only on the internal ambient temperatures, but they do give a good indication thereof.
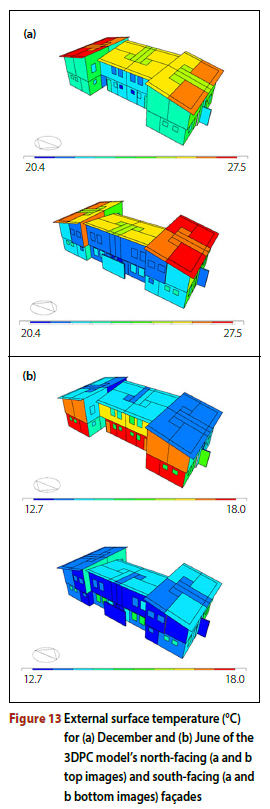
The external monthly average surface temperatures of the 3DPC building are presented on a colour scale in Figure 13 for both the months of December and June. Similar results were found for the 3DPC and baseline buildings, with the latter having 1% cooler surface temperatures. The thermal absorptivity of both façade materials was similar, but the difference in temperature was because of the convection close to the rougher, layered 3DPC surface. From the external surface temperature in Figure 13 it is useful to see which wall and roof surfaces experienced comfort.
Heat gains by elements
The thermal heat gains and losses per element are presented in Figure 14 for 22 December and 10 June 2013. Presented are all major external elements, including the 3DPC and baseline building walls. A positive heat gain is when the heat flux through an element increases the internal ambient temperature, and vice versa. Solar heat gains by the windows are the largest contributor to heat gains of the building, followed closely by roofs in the summer and walls in the winter months. The optimised design of the building can clearly be seen by the solar heat gain curve of the windows. The solar heat gain is reduced during the peak temperature hours of 12:00 to 14:00 by shadowing solar heat gains from the windows. The solar heat gains are also higher during the winter period when additional heat is required, which further improves the design. The heat gains and losses from the ground floor interaction are beneficial for thermal comfort during winter and summer periods, respectively.
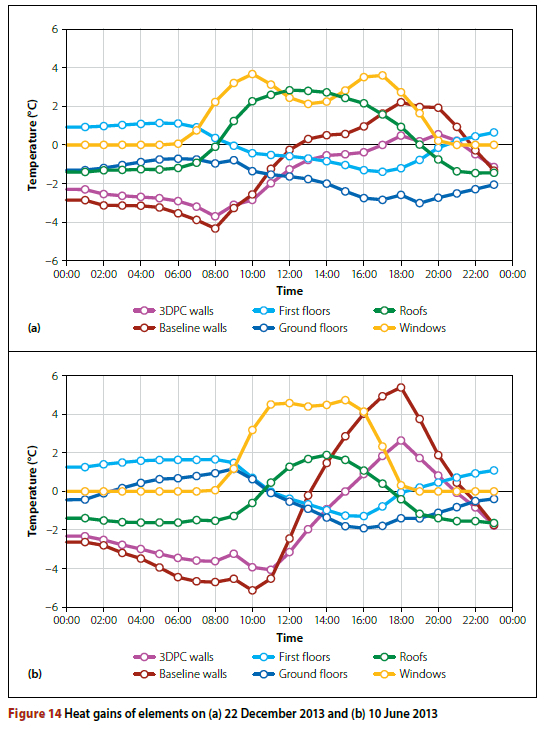
The heat gain data of elements confirms that the walls are not the largest contributor to heat gains in this building model. The positive heat gain of wall elements is outweighed by both solar heat gains through windows and heat gains via the roof element during the summer period, but not the winter period. This can be seen as a positive attribute because for summer periods additional heat gains will have a negative influence on the thermal comfort, while for winter periods additional heat gains are beneficial. The heat gains of the 3DPC wall follow the same trend as the baseline wall, but reduce the maximum and minimum heat gain range. The occupant thermal comfort was improved by reducing the temperature range.
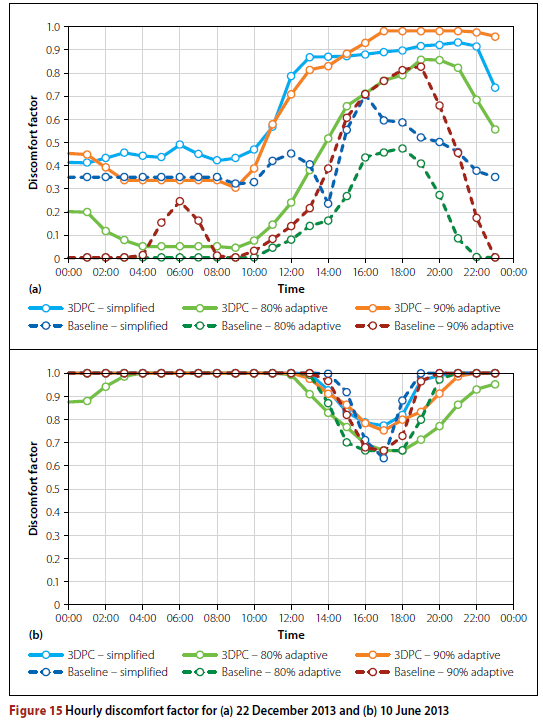
Thermal comfort
The thermal comfort is represented by the discomfort hours for occupants of the building for the simplified, 80% adaptive and 90% adaptive methods. The hourly discomfort factor for both baseline and 3DPC façade buildings for summer and winter representative days are presented in Figure 15 The vertical axis ranges from zero to one representing the hours of discomfort per hour interval. Zero would represent zero minutes of discomfort per hour interval, while one represents 60 minutes of discomfort per hour interval. The solid lighter-coloured line represents the 3DPC façade, and the dashed darker-coloured lines represent the baseline façade for all three thermal comfort methods. At a quick glance, one can observe that the 3DPC façade is less comfortable for occupants than the baseline façade for the summer day, but the opposite is true for the winter day.
The thermal discomfort hour results for all three ASHRAE methods are summarised in Table 7 for the whole year, i.e. the summer, autumn, winter and spring periods. The table includes the percentage of improvement for each method between the baseline and 3DPC façade buildings on a three-point colour scale where green is the greatest improvement and red the least improvement for the simple, adaptive 80% and adaptive 90%, respectively. During the summer and winter months the thermal comfort improved slightly for occupants of the 3DPC façade building, but these improvements were outweighed over the whole year by the significant improvement in comfort during the autumn and spring transition months when temperatures are not at extremes.
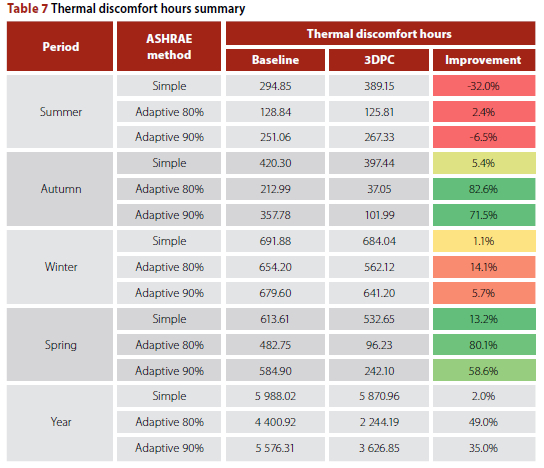
The thermal comfort data is plotted for all three thermal comfort methods. From the hourly data it can be seen that the simplified and 90% adaptive methods are more sensitive to sudden changes in temperature, which can lead to inaccurate and non-uniform results. Since the 80% adaptive method also takes into account a wider range of data points with 80% acceptability, it would be the method referred to for results. The winter month of the existing building proved to be the least comfortable, followed by spring, autumn, then summer the most comfortable. A 2.4% improvement in thermal comfort summer periods, and a 14.1% improvement for winter periods can be seen from the results. The transition seasons of autumn and spring, where the maximum and minimum temperatures are not as extreme, had a much greater improvement of 83% and 80%, respectively. The discomfort hours for occupants reduced form 4 400 hours per annum for the baseline façade to 2 244 hours per annum for the 3DPC façade. This yields a 49% improvement in thermal comfort for occupants according to the 80% adaptive method.
CONCLUSION
There is a need for better thermal performance of buildings in South Africa to improve occupant comfort and to reduce the energy consumption in residential buildings. Significant progress has already been made, as suggested in literature, concluding that this approach is the future for construction. Significantly improved indoor thermal conditions were recently reported in a Joe Slovo Phase Three house compared to a traditional RDP house in the vicinity. The Joe Slovo house was selected for this research on thermal comfort, since all necessary information on construction details, materials, and thermal performance monitored data was available. This building represents the new improved approach for construction of RDP buildings in South Africa, designed to be thermally efficient and leaning towards higher-density housing. The computational approach in this paper aimed at developing a predictive capacity for further thermal improvement by 3DPC walls, with careful consideration for heat transfer through the 3DPC façade configurations with cavities. From this research the following conclusions are drawn:
■ Finite element heat flow analysis performed on a 3DPC wall section with an appropriate iterative procedure to capture cavity radiation and convection was validated with physical tests on an instrumented 3DPC wall part. The measured and computed temperatures were in reasonable agreement, with an average Pearson correlation coefficient of 0.83.
■ The validated computational procedure justified its use to compute equivalent thermal transmittance values for different 3DPC façade configurations and the existing façade of the Joe Slovo phase house, in lieu of thermal transmittance test data from the standardised Hot Box procedure of ASTM C1363:2014.
■ From the FEA, the thermal transmit-tance of the existing building façades can be reduced by 71.5% from 5.6 to 1.57 W/m2 if replaced with a 3DPC façade alternative. The 3DPC façade also performed better than a double-layered masonry wall with 1 m2K/W insulation according to SANS 204:2011.
■ DesignBuilder, a commercial simulation software accredited for Green Star Rating analysis, was used to simulate the building as a whole. The level of detail on the material parameters, occupancy usage, and surrounding building modelling considered by the software reflects the complexity of simulating an existing, occupied building in its local environment. However, the results helped in reaching conclusions on the thermal comfort of occupants, as well as understanding and designing for a building to perform thermally efficient. With the weather data for a nearby location, and no attempt made to improve the agreement between results, an average Pearson correlation coefficient of 0.89 was obtained, representing a good correlation between model results and measured data.
■ Three methods for calculating the thermal comfort are available according to ASHRAE Standard 55, but the 80% adaptive method was chosen, since it is not as sensitive to sudden temperature changes and takes into account a larger range of data points. For the existing building the winter period proved to be the least comfortable, followed by spring, autumn, and then summer being the most comfortable. The simulation predicts a 49% improvement in thermal comfort hours for occupants per annum, with peak improvements of 83% and 80% during transition seasons. A 14.1% improvement for the least comfortable winter period was noted. This improvement relates directly to the energy-saving potential of 3DPC buildings, since occupants would not need to rely on active energy-consuming heating and cooling devices to keep themselves comfortable.
This work contributes to the success of 3DPC construction and creates a framework for continued research to further improve the thermal comfort for occupants. In a broader context, the research brings understanding of how building design may improve thermal comfort in South African housing, and potentially reduce energy consumption and associated harmful emissions for heating and cooling.
REFERENCES
ASHRAE (American Society of Heating Refrigerating and Air-Conditioning Engineers) 2020. ANSI/ ASHRAE Standard 55. Thermal Environmental Conditions for Human Occupancy. Peachtree Corners, GA: ASHRAE. Available at: www.ashrae.org. [ Links ]
ASTM (American Society for Testing and Materials) 2014. ASTM C1363:2014. Standard Test Method for Thermal Performance of Building Materials and Envelope Assemblies by Means of a Hot Box Apparatus. West Conshohocken, PA: ASTM. [ Links ]
Bergman, T L, Lavine, S A, Incropera, F P & Dewitt, D P 2011. Fundamentals of Heat and Mass Transfer (7th ed). Hoboken, NJ: Wiley. [ Links ]
BS (British Standard) 2019. BS EN 16798-1:2019 Energy Performance of Buildings. Ventilation for Buildings. London: British Standards Institution. [ Links ]
Christen, H E, Van Zijl, G P A G & De Villiers, W I 2023. Improving building thermal comfort through passive design: An experimental analysis of phase-change material 3D printed concrete. Journal for Cleaner Production, 392(5). https://doi.org/10.1016/j.jclepro.2023.13624 . [ Links ]
CIBSE (Chartered Institution of Building Services Engineers) 2006. Guide A: Environmental Design (7th ed). London: CIBSE. [ Links ]
Dassault Systemes Simulia 2020. ABAQUS. Johnston, IO: Dassault Systemes. Available at: https://www.3ds.com/products-services/simulia/products/abaqus. [ Links ]
De Dear, R J & Brager, G S 1998. Developing an adaptive model of thermal comfort and preference. ASHRAE Transactions, 104(Pt 1A): 145-167. [ Links ]
DesignBuilder 2022. DesignBuilder Release Software. Available at: https://DesignBuilder.co.uk/download/release-software(accessed on 8 June 2022). [ Links ]
Energi Solutions @ Africa 2015. Temperature Sensors. Available at: https://www.thermon.co.za/catalogue/temperature-sensors(accessed on 7 June 2022). [ Links ]
Kruger, P J 2019. Rheo-mechanics modelling of 3D concrete printing constructability. Stellenbosch University. Available at: https://scholar.sun.ac.za. [ Links ]
Marais, H , Christen, H, Cho, S, Villiers, W I D & Van Zijl G 2021. Computational assessment of thermal performance of 3D printed concrete wall structures with cavities. Journal of Building Engineering, 41: 1-21. doi: 10.1016/j.jobe.2021.102431. [ Links ]
Meijers, J 2021. Stellenbosch Weather. Stellenbosch University. Available at: http://weather.sun.ac.za (accessed on 30 September 2021). [ Links ]
Meyer, E S 2022. South African Building Envelope Thermal Performance Simulation : Parameters and the Role of Moisture Content. Stellenbosch University. Available at: http://hdl.handle.net/10019.1/124504. [ Links ]
NDHS (National Department of Human Settlements) 2013. Joe Slovo Phase 3 Low-Income Housing Development: Sustainable Housing Delivery Lessons Learnt Document. Cape Town: NDHS. [ Links ]
Ormandy, D & Ezratty, V 2012. Health and thermal comfort: From WHO guidance to housing strategies. Energy Policy, 49: 116-121. https://doi.org/10.1016/j.enpol.2011.09.003. [ Links ]
RSA (Republic of South Africa) 1996. The Constitution of the Republic of South Africa, 1996. Available at: https://www.gov.za. [ Links ]
SANS (South African National Standard) 2011. SANS 204:2011. Energy Efficiency in Buildings. Pretoria: SABS Standards Division. [ Links ]
SANS 2012. SANS 10400-N:2012. The Application of the National Building Regulations. Part N: Glazing. Pretoria: SABS Standards Division. [ Links ]
SANS 2015. SANS 10400-K: 2015. The Application of the National Building Regulations. Part K: Walls. Pretoria: SABS Standards Division. [ Links ]
SANS 2021. SANS 10400-XA:2021. Energy Usage In Buildings (2nd ed). Pretoria: SABS Standards Division. Available at: https://store.sabs.co.za. [ Links ]
Statistics South Africa 2016. Community Survey, 2016. Pretoria: StatsSA. Available at: http://cs2016.statssa.gov.za. [ Links ]
Sustainable Energy Africa 2014. Joe Slovo Phase 3: Sustainable densification in well located areas, Cape Town. Available at: http://sustainable.org.za/sustainable.org.za/uploads/files/file79.pdf. [ Links ]
 Correspondence:
M Moelich
Department of Civil Engineering AECOM Stellenbosch University
PO Box 112, Private Bag X1 Bellville 7535, Matieland 7600 South Africa, South Africa
E: migael.moelich@aecom.com
G van Zijl
Department of Civil Engineering, Stellenbosch University
Private Bag X1, Matieland 7600, South Africa
E: gvanzij l@sun.ac.za
W de Villiers
Department of Civil Engineering, Stellenbosch University
Private Bag X1, Matieland 7600, South Africa
E: wdv@sun.ac.za

MIGAEL MOELICH (MEng) is a Candidate Structural Design Engineer at AECOM in Bellville, where he has worked for the past year. He graduated with a Bachelor and a Master's in Civil Engineering from Stellenbosch University in 2020 and 2022 respectively.

PROF GIDEON VAN ZIJL (DEng, Pr Eng, FSAICE) is Distinguished Professor of Structural Engineering at Stellenbosch University (SU). After graduating with a Bachelor and a Master's in Civil Engineering at SU, and a PhD in Civil Engineering at Delft University of Technology, The Netherlands, hejoined SU in 2001 asprofessorof structural engineering. He established the Centre for Development of Sustainable Infrastructure (CDSI) in 2002, with research interests in structural, computational and durability mechanics, currently applied in 3D concrete printing.

DR WIBKE DE VILLIERS is a senior lecturer at Stellenbosch University, where she obtained her BEng (2006), MScEng (2008) and PhD (2019), the latter in the development of performance-based specifications for alternative masonry units. As a member of the Unit of Construction Materials, her research interests lie in alternative and sustainable construction materials and their structural and thermal performance. She has supervised a number of postgraduate students and authored or co-authored several publications over the past nine years. Prior to this, she spent two years at Aurecon (now Zutari) as a structural design engineer.

